


Abstract
Galaxy spectral energy distribution (SED) modelling is a powerful tool, but constraining how well it is able to infer the true values for galaxy properties (e.g. the star formation rate) is difficult because independent determinations are often not available. However, galaxy simulations can provide a means of testing SED modelling techniques. Here, we present a numerical experiment in which we apply the SED modelling code magphys to ultraviolet–millimetre synthetic photometry generated from hydrodynamical simulations of an isolated disc galaxy and a major galaxy merger by performing three-dimensional dust radiative transfer. We compare the properties inferred from the SED modelling with the true values and find that magphys recovers most physical parameters of the simulated galaxies well. In particular, it recovers consistent parameters irrespective of the viewing angle, with smoothly varying results for neighbouring time steps of the simulation, even though each viewing angle and time step is modelled independently. The notable exception to this rule occurs when we use a Small Magellanic Cloud-type intrinsic dust extinction curve in the radiative transfer calculations. In this case, the two-component dust model used by magphys is unable to effectively correct for the attenuation of the simulated galaxies, which leads to potentially significant errors (although we obtain only marginally acceptable fits in this case). Overall, our results give confidence in the ability of SED modelling to infer physical properties of galaxies, albeit with some caveats.
1 INTRODUCTION
A galaxy's spectral energy distribution (SED) encodes much information about the galaxy, including its star formation history (SFH), its stellar, gas, and metal content, and the physical conditions of its interstellar medium (ISM). The number of galaxies, both local and high-redshift, with well-sampled ultraviolet (UV) to millimetre (mm) integrated SEDs has increased rapidly in recent years, and much effort is being made to attempt to extract galaxy properties from these SEDs. Accurately extracting physical properties, such as stellar mass and star formation rate (SFR), from galaxy SEDs is crucial to answer many open questions in galaxy formation, including the following: what is the SFH of the Universe? How do properties such as the SFR, metallicity, and gas fraction depend on redshift and galaxy mass? What processes quench star formation in galaxies? Furthermore, knowledge of galaxies’ physical properties is often necessary to compare observations with theoretical models because models typically do not directly predict observables.
The simplest method to determine some property of a galaxy is to use a single photometric data point. For example, if the redshift is known, SFRs are commonly derived from UV, Hα, or 24-μm photometry (Kennicutt 1998b), and stellar mass can be derived from a galaxy's near-infrared (NIR) flux (e.g. Bell & de Jong 2001). However, such methods require various simplifying assumptions and can suffer from significant systematics and degeneracies.
Use of multiple data points simultaneously can yield more information and break some degeneracies, such as that between age and metallicity. In a technique known as SED modelling or stellar population synthesis1 (e.g. Leitherer et al. 1999; Bolzonella, Miralles & Pelló 2000; Bruzual & Charlot 2003, hereafter BC03; Le Borgne et al. 2004; Burgarella et al. 2005; Maraston 2005; da Cunha, Charlot & Elbaz 2008; Kotulla et al. 2009; Kriek et al. 2009; Noll et al. 2009; Conroy & Gunn 2010; Serra et al. 2011; see Walcher et al. 2011; Conroy 2013 for reviews), a galaxy is treated as the sum of its parts: as input, one must use template SEDs for single-age stellar populations (SSPs), which depend on the age and metallicity of the stellar population, the stellar initial mass function (IMF), and the stellar libraries used. By assuming an SFH and metallicity, which may be a function of age, the total SED of the stellar population can be calculated. In addition to stellar emission, nebular emission lines (e.g. Charlot & Longhetti 2001) and AGN emission (e.g. Burgarella et al. 2005; Noll et al. 2009; Berta et al. 2013) can also be included. Dust attenuation can be treated using an empirical attenuation curve (e.g. Calzetti, Kinney & Storchi-Bergmann 1994; Calzetti 1997; Calzetti et al. 2000) or a simple analytic model (e.g. Charlot & Fall 2000, hereafter CF00). A large set of templates is generated by varying the model parameters, and, in principle, the parameters of the template SED that best fits the UV–NIR photometry can be used to infer physical properties of the galaxy, including SFR, age, metallicity, and stellar mass.
The above discussion has largely ignored infrared (IR) emission from dust, but this, too, can be used to infer galaxy properties. Indeed, if IR data are unavailable, it is possible to mistake a heavily obscured, rapidly star-forming galaxy for a passive galaxy (e.g. Carter et al. 2009). The simplest way to interpret a galaxy's far-IR (FIR) through mm emission2 is to fit one or more modified blackbodies to the SED, and in doing so infer the IR luminosity (which can be used to estimate the SFR), effective dust temperature(s), and dust mass (see sections 4.2 and 4.3 of Casey, Narayanan & Cooray 2014). IR SED models, such as those of Dale & Helou (2002) or Draine et al. (2007), can also be used. Because the UV–NIR and MIR–mm regions of an SED yield complementary information, it is preferable to use both simultaneously. An example of a simple method to do this is to infer the SFR by using a combination of the UV or Hα luminosity and the IR luminosity to account for both unobscured and obscured star formation (e.g. Kennicutt et al. 2007, 2009; Relaño & Kennicutt 2009; Wuyts et al. 2011a,b; Reddy et al. 2012; Lanz et al. 2013).
A more sophisticated approach is to use all available data when fitting SEDs. One method is to perform radiative transfer calculations assuming some simple galaxy geometry (e.g. Silva et al. 1998; Efstathiou, Rowan-Robinson & Siebenmorgen 2000; Granato et al. 2000; Popescu et al. 2000; Tuffs et al. 2004; Siebenmorgen & Krügel 2007; Groves et al. 2008; Michałowski et al. 2010a,b). Alternatively, one can take a more empirical approach and treat the FIR SED as a sum of modified blackbodies (e.g. da Cunha et al. 2008, hereafter dC08) or use IR SED templates (e.g. Noll et al. 2009). Regardless of the manner in which the IR SED is obtained, the luminosity of the IR SED should be equal to the luminosity absorbed by the dust. This requirement is necessary for the SED model to be self-consistent and can also enable the model to be more constraining because it explicitly links the UV–NIR and MIR–mm regions of the SED.
The SED modelling methods described above are very flexible, and they can be applied to large samples of galaxies (e.g. Kauffmann et al. 2003; Brinchmann et al. 2004; Gallazzi et al. 2005; Salim et al. 2007; da Cunha et al. 2010a; Smith et al. 2012). However, there are multiple simplifying assumptions and uncertainties inherent in the models (e.g. Conroy, Gunn & White 2009; Conroy & Gunn 2010; Conroy, White & Gunn 2010), some of which we will discuss here. The SEDs depend strongly on the IMF, but the shape of the IMF and whether it is universal are both actively debated (e.g. Davé 2008; van Dokkum 2008; van Dokkum & Conroy 2010, 2011; Conroy & van Dokkum 2012; Narayanan & Davé 2012, 2013; Hayward et al. 2013; Hopkins 2013; see Bastian, Covey & Meyer 2010 for a review). The SSP templates are also uncertain; one particular area of disagreement is the treatment of thermally pulsating asymptotic giant branch (TP-AGB) stars (Maraston 2005; Maraston et al. 2006; Kriek et al. 2010; Henriques et al. 2011; Zibetti et al. 2013). SED modelling codes typically assume relatively simple SFHs, and changing the assumed form can significantly affect the results of the modelling (e.g. Michałowski et al. 2012, 2014). Furthermore, the models must necessarily assume simple geometries. In many cases, the dust is treated as a foreground screen or mixed slab. Some models include somewhat more complicated geometries in that they allow the young stars and older stars to be attenuated by different amounts (e.g. Silva et al. 1998; CF00; dC08; Groves et al. 2008), but this geometry is still only a crude approximation to reality. Spatial variation in metallicity is typically not accounted for (except perhaps indirectly in the form of an age dependence), and uncertain dust composition can significantly affect the amount and wavelength dependence of the attenuation, the shape of the dust emission SED, and the inferred dust mass. Finally, treating the FIR emission as one or more modified blackbodies may be problematic if one's goal is to infer physical quantities rather than simply describe the SED (e.g. Shetty et al. 2009a,b; Hayward et al. 2012; Kelly et al. 2012; Smith et al. 2013), but more sophisticated models, such as those of Dale & Helou (2002) and Draine et al. (2007), may be able to yield physical insight.
Given the complexity of and assumptions inherent in SED modelling, it is desirable to compare the results of different methods and, if possible, to test how well the methods can recover the galaxy properties that they intend to recover. There have been extensive efforts to ‘internally validate’ SED modelling methods, i.e. search for systematics and uncertainties that are inherent in the methods using either a sample of synthetic SEDs constructed using the same assumptions that are inherent in the SED modelling codes or samples of real galaxies (dC08; Walcher et al. 2008; Giovannoli et al. 2011; Boquien et al. 2012; Buat et al. 2012, 2014; Smith et al. 2012; see sections 4.4.4 and 4.5.3 of Walcher et al. 2011 for an extensive discussion). ‘External validation’ of the quantities recovered by SED modelling is possible for only a few quantities, such as the SFR and mass-to-light ratio; however, when there is a discrepancy between e.g. the SFR inferred from the FIR luminosity and SED modelling, it is not clear a priori which SFR value is more accurate (e.g. Hayward et al. 2014b; Utomo et al. 2014).
Fortunately, it is possible to test some (but definitely not all) of the assumptions inherent in SED modelling by applying SED modelling to synthetic SEDs generated from semi-analytical models (e.g. Lee et al. 2009; Trager & Somerville 2009; Pforr, Maraston & Tonini 2012, 2013; Mitchell et al. 2013) or simulations (e.g. Wuyts et al. 2009a; Lanz et al. 2014; Michałowski et al. 2014; Torrey et al., submitted) as a type of controlled numerical experiment. Wuyts et al. (2009a) were the first to perform such tests using hydrodynamical simulations. They were able to investigate discrepancies caused by mismatches between the true SFH in the simulations and that assumed, different amounts of attenuation for stars of different ages and AGN, metallicity variations, and AGN contamination unaccounted for in the SED modelling. However, their method for calculating the photometry was relatively simple: first, it is not clear that the Calzetti et al. (2000) attenuation curve, which is an empirically derived attenuation curve that is meant to be applied to integrated galaxy SEDs of starburst galaxies, should be applied to attenuate individual lines-of-sight within galaxies. Furthermore, because Wuyts et al. did not perform radiative transfer, they could not investigate the effects of scattering. Additionally, they did not account for the obscuration of young stellar clusters on subresolution scales. Finally, because Wuyts et al. did not calculate dust re-emission, they restricted their SED modelling to synthetic optical–NIR photometry. As we explain below, we avoid these limitations by performing dust radiative transfer on hydrodynamical simulations.
Now that radiative transfer is routinely applied to three-dimensional (3D) hydrodynamical simulations (e.g. Jonsson et al. 2006; Wuyts et al. 2009b, 2010; Bush et al. 2010; Jonsson, Groves & Cox 2010; Narayanan et al. 2010a,b; Hayward et al. 2011, 2012, 2013, 2014b; Snyder et al. 2011, 2013) and increasingly sophisticated SED modelling is applied to observed galaxies (e.g. dC08; da Cunha et al. 2010a,b; Buat et al. 2012; Smith et al. 2012; Lanz et al. 2013), it is appropriate to revisit the work of Wuyts et al. (2009a); we do so here by performing radiative transfer on hydrodynamical simulations of a disc galaxy and a galaxy major merger and applying the SED modelling method of dC08, magphys, to the synthetic photometry. Because magphys is now very commonly used (e.g. da Cunha et al. 2010a,b; Wijesinghe et al. 2011; Rowlands et al. 2012, 2014a,b; Smith et al. 2012; Banerji et al. 2013; Berta et al. 2013; Fu et al. 2013; Gruppioni et al. 2013; Ivison et al. 2013; Lanz et al. 2013; Bitsakis et al. 2014; Delvecchio et al. 2014; Presotto et al. 2014; Toft et al. 2014) this work should be of great relevance to many researchers.
This approach is critical for our ability to interpret the results of SED fitting. In addition to the aforementioned, our approach has several further advantages over previous attempts to validate SED modelling methods. For example, because each line of sight to a galaxy is uniquely affected by dust, it is possible that our ability to infer its properties is viewing angle dependent. It is difficult to address this issue using real galaxies, although dC08 attempted to do so statistically by using the ratio of the projected major and minor axes as a crude proxy for viewing angle; this test revealed no evidence for bias in the averaged values of different magphys parameters across a sample of 1658 Infrared Astronomical Satellite (IRAS; Neugebauer et al. 1984) selected galaxies. In contrast, our approach to generating emergent SEDs at different viewing angles for the same temporal snapshot enables us to address this issue directly. Second, it is highly likely that the extent of our ability to infer the properties of a galaxy depends on the evolutionary stage of that galaxy (e.g. the length of time since the most recent burst of star formation); this method of external validation enables us to quantify this effect over time-scales in excess of a gigayear, a task that is clearly impossible using real galaxies.
One concern with this method of validation is whether the simulations resemble real galaxies well enough that the test is relevant. This concern is one reason that we utilize idealized simulations in which the progenitor galaxies are constructed ‘by hand’, as our goal is not to form galaxies ab initio but rather to perform a controlled numerical experiment on simulated galaxies with reasonable properties. This approach helps to ensure that the properties of the simulated galaxies (e.g. the radial and vertical profiles of the discs, gas fraction, and metallicity) are similar to those of real galaxies.
Furthermore, other works that used the same hydrodynamical and radiative transfer codes and similar initial conditions have demonstrated that the SEDs agree with those of real galaxies: Jonsson et al. (2010) found that for a variety of colour–colour plots spanning the UV through submm, the simulated discs typically occupied regions that are also occupied by real galaxies from the SIRTF Nearby Galaxies Survey (SINGS; Kennicutt et al. 2003; Dale et al. 2007) sample (but the full variation in real galaxies’ colours was not captured by the simulations, likely because of the limited parameter space spanned by the simulations and because no early-type or interacting galaxies were simulated). Lanz et al. (2014) used a library of ∼12 000 synthetic SEDs of simulated isolated and interacting disc galaxies to fit the UV–FIR SEDs of a subset of isolated and interacting galaxies (originally presented in Lanz et al. 2013) from the Spitzer Interacting Galaxies Survey (Brassington et al., in preparation). They found that most of the real galaxy SEDs were reasonably well fit by one or more of the simulated galaxy SEDs.3 Similarly, the simulated high-redshift galaxy SEDs of Hayward et al. (2011, 2012, 2013) provide acceptable fits to the SEDs of 24-μm-selected starbursts and AGN (Roebuck et al., in preparation). Thus, we are confident that the simulations are sufficiently reasonable for the purposes of this work.
The remainder of this paper is organized as follows. In Section 2, we describe the combination of hydrodynamical simulations and dust radiative transfer used to create the synthetic photometry and the SED modelling code of dC08, magphys. Section 3.1 presents an example magphys fit to a synthetic SED. Sections 3.2 and 3.3 discuss the results of applying magphys to the SEDs calculated for the isolated disc and galaxy merger simulations, respectively, using the default sunrise parameters. Section 3.4 investigates the influence of potential sources of systematic error, such as the treatment of dust attenuation, in the SED modelling procedure. In Section 4, we discuss some implications of our results. Section 5 presents our conclusions.
2 METHODS
To investigate the effectiveness of SED modelling, we first generated synthetic UV–mm SEDs by performing dust radiative transfer on hydrodynamical simulations of an isolated disc galaxy and a major galaxy merger. We then applied magphys to the synthetic photometry and compared the physical parameter values inferred by magphys with the true values for the simulated galaxies. Note that the comparison was performed in a blind fashion; CCH (first author) generated the synthetic photometry and provided it to DJBS (second author) without the corresponding physical parameter values. Then, DJBS fit the synthetic photometry and provided the inferred parameter values to CCH for comparison. No modifications to the simulations or SED modelling procedure were made after this comparison was performed, and each snapshot was modelled independently (i.e. magphys did not ‘know’ that different viewing angles correspond to the same galaxy or that successive snapshots are in any way related).
Now, we present the key details of our method for calculating SEDs from hydrodynamical simulations and the SED modelling code magphys.
2.1 Calculating SEDs of simulated galaxies
This work uses a combination of 3D gadget-3 (Springel, Yoshida & White 2001; Springel 2005) smoothed particle hydrodynamics (SPH)4 galaxy simulations and the sunrise5 (Jonsson 2006; Jonsson et al. 2010) Monte Carlo dust radiative transfer code to calculate synthetic SEDs of the simulated galaxies. The methods have been described in detail elsewhere (e.g. Jonsson et al. 2006, 2010; Hayward et al. 2011, 2012), so we only summarize them briefly here.
The gadget-3 simulations include star formation following a volume-density-dependent Kennicutt–Schmidt relation (Schmidt 1959; Kennicutt 1998a) with a low-density cut-off, a subresolution prescription for the multiphase ISM (which implicitly includes supernova feedback; Springel & Hernquist 2003), and a model for black hole accretion and thermal AGN feedback (Springel, Di Matteo & Hernquist 2005). The current work utilizes two gadget-3 simulations. One is a simulation of an isolated disc galaxy, the vc3 model of Cox et al. (2006). The initial conditions consist of a dark matter halo and a rotationally supported exponential disc of gas and stars. The dark matter halo has a Hernquist (1990) profile with an effective concentration of 9, spin parameter λ = 0.033, and circular velocity V200 = 160 km s−1. The exponential disc has a radial scale length of 3.9 kpc, a total mass of 5.6 × 10¹⁰ M⊙, and an initial gas fraction of 40 per cent. The second simulation is the vc3vc3e model of Cox et al. (2006), which is a merger of two of the previously described disc galaxies. For this simulation, the two disc galaxies were initialized on a parabolic orbit with a pericentric passage distance of 5 kpc and an initial separation of 100 kpc. The two discs were initially oriented such that their spin axes are specified by the spherical coordinates (θ, ϕ) = (30°, 60°) and (−30°, 45°) (the ‘e’ orbit of Cox et al. 2006). The masses and gravitational softening lengths for the baryonic (dark matter) particles are 3.9 × 10⁵ M⊙ and 100 pc (7.6 × 10⁶ M⊙ and 200 pc), respectively. See Cox et al. (2006) for further details of the gadget-3 simulations.
At 10-Myr intervals, we saved snapshots of the gadget-3 simulations and processed them with sunrise, which calculates the emission from the star and black hole particles present in the gadget-3 simulations, propagates the emission through the dusty ISM, and calculates the IR re-emission from dust. The default sunrise assumptions and parameters used in this work are identical to those used by Jonsson et al. (2010), except that we include AGN emission as first introduced in Younger et al. (2009).
Star particles with ages >10 Myr were assigned starburst99 (SB99; Leitherer et al. 1999; Vázquez & Leitherer 2005) SSP SED templates according to their ages and metallicities. Younger star particles were assigned templates from Groves et al. (2008; see also Dopita et al. 2005, 2006a,b), which include emission from the H ii and photodissociation regions that surround young star clusters. The black hole particles were assigned luminosity-dependent templates from Hopkins, Richards & Hernquist (2007), which are based on observations of unreddened quasars. Because the luminosity of the black hole particle(s) is determined self-consistently from the accretion rate in the gadget-3 simulations, the AGN contribution varies significantly with time; see Section 3.4.1 for details. The dust density distribution was calculated by projecting the gadget-3 metal density on to a 3D adaptive mesh refinement grid and assuming a dust-to-metal density ratio of 0.4 (Dwek 1998; James et al. 2002). sunrise calculates dust absorption and scattering using a Monte Carlo method. Our default dust model is the Milky Way (MW) RV = 3.1 model of Weingartner & Draine (2001) as updated by Draine & Li (2007).
The results of the sunrise calculations are spatially resolved UV–mm SEDs (i.e. integral field unit spectrograph-like data) for the simulated galaxies viewed from seven different cameras. To sample uniformly in solid angle, the positions were selected by uniformly sampling the cosine of the polar angle, cos θ, starting at the north pole and excluding the south pole (cos θ = {−1/3, 1/3, 1}). For each cos θ value except for cos θ = 1, for which all azimuthal angles are equivalent, the azimuthal angle ϕ was sampled uniformly (ϕ = {0, 2π/3, 4π/3}). The camera positions in spherical coordinates are specified in Table 1.
Viewing angles (i.e. camera positions) used in the sunrise radiative transfer calculations.
| Angle numbera | θb | ϕc |
|---|---|---|
| (°) | (°) | |
| 1 | 0 | 0 |
| 2 | 73.4 | 0 |
| 3 | 73.4 | 120 |
| 4 | 73.4 | 240 |
| 5 | 124.8 | 0 |
| 6 | 124.8 | 120 |
| 7 | 124.8 | 240 |
| Angle numbera | θb | ϕc |
|---|---|---|
| (°) | (°) | |
| 1 | 0 | 0 |
| 2 | 73.4 | 0 |
| 3 | 73.4 | 120 |
| 4 | 73.4 | 240 |
| 5 | 124.8 | 0 |
| 6 | 124.8 | 120 |
| 7 | 124.8 | 240 |
b,cCamera positions (θ and ϕ denote the polar and azimuthal angles, respectively) in spherical coordinates. The isolated disc galaxy and merger orbit lie in the xy plane. Thus, angle 1 provides a face-on view of the disc galaxy.
We calculated the integrated photometry by summing the SEDs of all pixels and convolving with the appropriate filter response curves. We assumed that the simulated galaxies are at redshift z = 0.1. In this work, we used the bands that were used for the initial Herschel Astrophysical Terahertz Large Area Survey (H-ATLAS; Eales et al. 2010) investigations because one of the motivations of the work was to validate the SED modelling approach used in Smith et al. (2012) for 250-μm-selected galaxies with r-band Sloan Digital Sky Survey (SDSS; York et al. 2000) counterparts from Smith et al. (2011). The likelihood ratio cross-matching in Smith et al. (2011) was performed in order to associate redshift information primarily from SDSS and the Galaxy and Mass Assembly (GAMA; Driver et al. 2011) survey with the H-ATLAS sources, and to leverage the matched multiwavelength photometry from GAMA for the purposes of fitting SEDs (we refer the interested reader to Driver et al. 2011, for further details). Specifically, we used simulated photometry in the near-UV (NUV) and far-UV (FUV) bands of the Galaxy Evolution Explorer (GALEX) satellite (Martin et al. 2005), the ugriz bands from the SDSS, the YJHK bands from the UK Infrared Deep Sky Survey (UKIDSS; Lawrence et al. 2007), and FIR data from IRAS at 60 μm, Herschel Photoconductor Array Camera and Spectrometer (PACS; Poglitsch et al. 2010) at 100 and 160 μm, and Herschel Spectral and Photometric Imaging Receiver (SPIRE; Griffin et al. 2010) at 250, 350, and 500 μm. Note that at all times, the photometry is integrated over the entire system (i.e. both galaxies in the merger).
Because the goal of this work is to test the efficacy of SED modelling under ideal conditions and investigate intrinsic systematic uncertainties rather than those that arise from noisy or limited data, we did not add any noise to the photometry. However, for the purposes of applying magphys, we assumed uncertainties identical to those assumed in Smith et al. (2012), amounting to 0.2 mag in the FUV and NUV bands, 0.1 mag in the ugrizYJHK bands, 20 per cent at 60 μm, 10 (20) per cent at 100 (160) μm, and 15 per cent at 250, 350, and 500 μm. Although in Smith et al. (2012), the motivation for these uncertainties was to do with issues regarding absolute calibration uncertainties and hard-to-quantify aperture effects (e.g. Hill et al. 2011), they are arbitrary for this investigation (but are similar to the quantifiable model uncertainties in the radiative transfer calculations; Lanz et al. 2014).
2.2 SED modelling
As previously discussed, we performed SED modelling using magphys (dC08), which is now very commonly used for interpreting observed galaxy SEDs (see example references in Section 1). We used the version described in Smith et al. (2012), which was used for the H-ATLAS analysis therein; here, we summarize the most relevant details, and we refer the reader to dC08 for full details of the method.
The FIR dust emission is treated as a sum of multiple optically thin10 modified blackbodies with different normalizations, dust temperatures, and dust emissivity indices, β. We do not discuss the implementation in full detail here, instead referring the interested reader to dC08. However, we will briefly highlight some salient features of the magphys dust implementation, in which some of the parameters are fixed based on observational constraints and some are allowed to vary. The FIR emission is dominated by ‘warm’ and ‘cold’ grains in thermal equilibrium decomposed into the birth cloud and diffuse ISM components of the CF00 model. The birth clouds and diffuse ISM both have warm dust components, which are treated as modified blackbodies with β = 1.5; the temperature of the warm birth cloud component, |$T_{\rm W}^{\rm BC}$|, is allowed to vary within a prior between |$30 \le T_{\rm W}^{\rm BC}\le 60$| K, whereas the ISM warm component has a fixed temperature of 45 K. In contrast, only the diffuse ISM has a cold dust component, which is represented as a modified blackbody with β = 2.0 and variable temperature |$15 \le T_{\rm C}^{\rm ISM}\le 25$| K. For the purpose of calculating dust masses, the dust emissivity is normalized at κ850 μm = 0.77 g−1 cm2 (Dunne et al. 2000).
Given the SED components described above, dC08 generated libraries of template SEDs, including a set of 25 000 stellar population models with a wide variety of SFHs (which have the general form of an exponentially declining component with superimposed bursts), metallicities, and dust attenuation. dC08 also generated a separate set of 50 000 dust SED templates with a range of dust temperatures and relative contributions of different dust components (see dC08 for the details of the sampling and the assumed prior distributions for the model parameters).
Applying the condition specified in equation (5) to all possible combinations of the 25 000 stellar population and 50 000 dust emission template SEDs yields a library of millions of UV–mm SED templates. magphys then fits galaxy SEDs in a Bayesian manner using the χ2 estimator to determine the goodness-of-fit (see Kauffmann et al. 2003 for an early application of such a technique). That magphys uses χ2 for the SED fitting requires that each datum has an associated error estimate to appear in the denominator of the χ2 calculation. In the case of real data, this uncertainty can include several different components, such as photon shot noise, calibration uncertainties, and aperture effects, which are clearly not applicable to our model (which is noise-free, precisely calibrated, and includes integrated photometry). As noted in Section 2.1, we arbitrarily adopt uncertainties in each band identical to those used in the magphys fits for H-ATLAS galaxies in Smith et al. (2012). This is potentially problematic because if the simulated SEDs were perfectly represented in the magphys libraries, this would result in extremely small values of best-fitting χ2, a point to which we shall return when discussing our results below.
3 RESULTS
3.1 Example fit
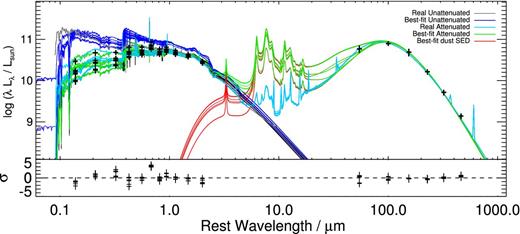
Fig. 1 shows the results of applying magphys to the t − t(SFRmax) = −0.5 Gyr snapshot of the merger simulation. The spread in the photometric points at a given wavelength reflects the viewing-angle-dependent variation in dust attenuation, which is self-consistently computed for the simulated galaxy through dust radiative transfer. In the UV, the output SEDs for the seven cameras span a range of ∼0.5 dex in luminosity over the different viewing angles. For the most obscured viewing angle, the observed NUV luminosity is an order of magnitude fainter than the intrinsic luminosity. Longward of ∼ 1 μm, the variation of the photometry with viewing angle and the attenuation are considerably less (although still non-negligible).
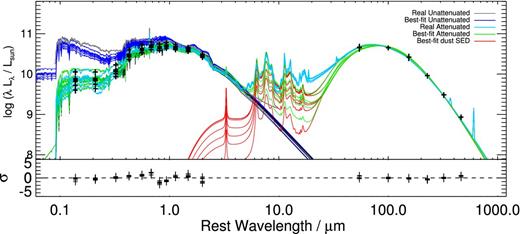
The top panel shows an example of the magphys SED fits for the t − t(SFRmax) = −0.5 Gyr snapshot (between first passage and coalescence) of the merger simulation observed from seven viewing angles. The black points are the simulated photometry. The cyan lines correspond to the ‘observed’ SEDs of the simulated galaxy for each of the seven viewing angles, and the grey line indicates the true input (unattenuated) SED. The green, blue, and red lines denote the best-fitting total output (i.e. the sum of the attenuated emission from stars and the dust emission), unattenuated stellar, and dust SEDs, respectively, yielded by magphys for each of the seven viewing angles. The bottom panel shows the residuals in the photometry, |$(L_{\rm true}-L_{\small {magphys}})/\sigma$|. For each of the viewing angles, magphys yields an acceptable fit to the photometry, and the true intrinsic stellar SED is recovered reasonably well. The larger residuals near i band occur because Hα falls in this band at z = 0.1, and emission lines are not accounted for in our magphys modelling; this has the effect of leaving a positive residual in i band and affecting the neighbouring residuals (because neighbouring bands are not independent in SED modelling). In the MIR, the magphys SEDs vary strongly with viewing angle, and the true SEDs are not recovered for most of the viewing angles. In the FIR shortward of the observed-frame 60-μm data point, magphys underestimates the true SEDs.
For each of the seven viewing angles, magphys yields an acceptable fit to the photometry, although the models underpredict the i-band data points because at z = 0.1 (the assumed redshift of the simulated galaxy), the high equivalent width Hα emission line, which is not considered in this implementation of magphys, falls roughly in the centre of that band's transmission function.11 Encouragingly, magphys is able to recover the intrinsic (unattenuated) stellar SED to within ∼0.1–0.4 dex. This success indicates that the CF00 two-component dust attenuation model used in magphys is effective at correcting for the effects of dust attenuation (for this particular SED; we present an example in which this is not the case in Section 3.4.2). In the simulations, the dust attenuation for a given viewing angle depends on the 3D spatial distribution of sources of emission and dust, spatial variations in the stellar populations, and dust scattering into and out of the given line of sight. Differential extinction is significant because for a given line of sight, there is, in principle, a unique line-of-sight optical depth for each stellar particle; thus, a two-component model is surely a crude approximation to the actual geometry of the simulated galaxy. Consequently, it is impressive that the dust attenuation correction is as effective as it is.
Using these input data, magphys is significantly less effective at recovering the true dust SED in the MIR, primarily because of the lack of ‘observations’ at wavelengths in the range of ∼ 2–50 μm, where the MIR SED is poorly recovered for most viewing angles. At these wavelengths, the variation in the best-fitting SEDs for each viewing angle output by magphys is greater than an order of magnitude in luminosity (whereas the variation in the true SED is negligible). In the FIR between ∼25 and the 60 μm data point, all of the best-fitting SEDs for this snapshot underpredict the true SED (although this is not necessarily the case for other snapshots, this trend was also noted by Ciesla et al. 2014). As noted in Smith et al. (2012), these difficulties are not unexpected because the only constraints on the MIR SED in the absence of MIR observations come from the prior on the MIR component of the dust SED library (which is chosen at random and thus deliberately broad) and the energy balance criterion. This latter constraint is also weakened in the MIR regime as a result of the small contribution of the hot dust component to the total dust luminosity.
The uncertainty in the MIR highlights the fundamentally phenomenological (rather than physical) nature of the model for the IR emission: for a given total energy absorbed, the dust emission does not depend a priori on the SED of the absorbed light. In reality, the shape of the radiation field that heats the dust, which can vary significantly throughout a galaxy, affects the dust-temperature distribution. For this reason, as noted in dC08 and Smith et al. (2012), the efficacy of the dust emission model in magphys at observationally unsampled wavelengths (particularly in the MIR) is limited. The model may be useful for recovering the IR luminosity and dust mass (we address these possibilities below), but it should not be used to interpret the detailed physical state of the dust or to make predictions for regions of the SED that are unconstrained by the available photometry. Using a more physically motivated model for dust emission, such as that of Draine et al. (2007), may alleviate this problem (Ciesla et al. 2014).
3.2 Isolated disc
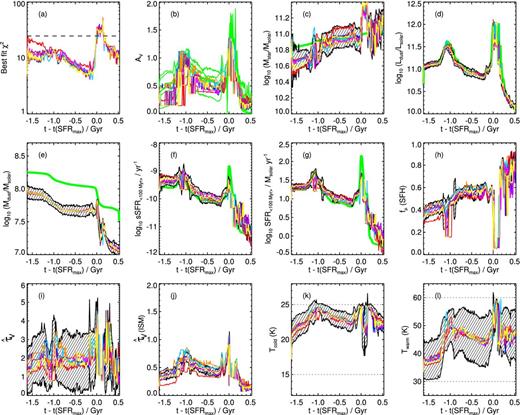
Fig. 2 shows the time evolution of various quantities for the isolated disc simulation. In each panel, the thin non-green lines indicate the median likelihood values output by magphys (except for the χ2 and AV panels, which show the values for the best-fitting SED); different colours correspond to different viewing angles, and the shaded region represents an estimate of the typical uncertainty about the median (specifically, it represents the median of the symmetrized 16th and 84th percentiles of the cumulative frequency distribution about the median of each set of parameters, averaged over the seven viewing angles). The thick green lines represent the true values of the quantities for the simulations (when possible; not all magphys parameters have a direct physical counterpart in the simulations). See the figure legend for details of the parameters shown in each panel.
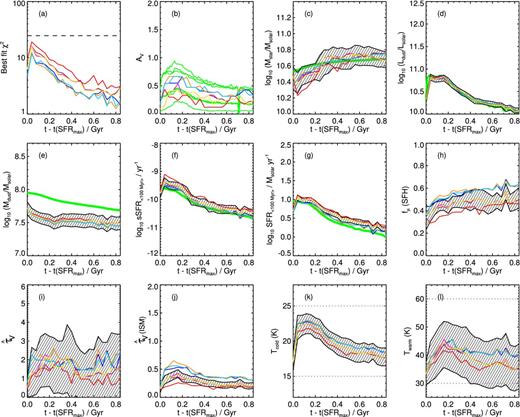
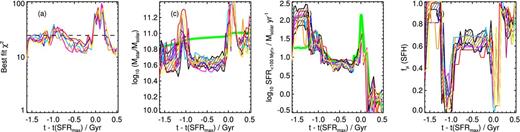
Results of applying magphys to the synthetic integrated photometry for the isolated disc simulation. Each panel shows the evolution of a magphys parameter versus simulation snapshot time t in Gyr. The coloured lines indicate median likelihood values inferred from magphys, and different colours denote different viewing angles (in order of angle number as specified in Table 1, red, blue, orange, light blue, pink, purple, and yellow). The shaded regions represent the median of the symmetrized 16th and 84th percentiles of the cumulative frequency distribution about the median of each set of parameters averaged over the seven viewing angles. When possible (not all magphys parameters correspond to physical parameters of the simulations), the true values from the simulation are plotted as a solid green line (in panels b–g). The panels are as follows: (a) χ2 value for the best-fitting SED, where the dashed line indicates the threshold for an acceptable fit from Smith et al. (2012); (b) V-band attenuation (AV); (c) stellar mass; (d) total luminosity of the dust emission; (e) dust mass; (f) sSFR; (g) SFR; (h) fraction of luminosity absorbed by the diffuse ISM in magphys (|$f_{\mu }^{\rm SFH}$|); (i) total V-band optical depth in magphys (τV); (j) V-band optical depth of the diffuse ISM in magphys (τV,ISM); (k) cold-dust temperature parameter of magphys (|$T_{\rm C}^{\rm ISM}$|); and (l) warm-dust temperature parameter of magphys (|$T_{\rm W}^{\rm BC}$|). In the last two panels, the dotted lines represent the limits imposed by the assumed priors. Most parameters are recovered well; see the text for details.
At all times during this isolated disc simulation, acceptable fits can be found, which is to say that the χ2 values (shown in panel a) are always below the threshold value for an acceptable fit (shown as the horizontal dashed line). This threshold value of χ2 was derived in Smith et al. (2012) on the basis that it corresponds to the χ2 value above which there is a probability of <1 per cent that the best fit is consistent with the model given the seventeen bands of photometry available, their total errors, and a statistical estimate of the number of free parameters in the model (see Smith et al. 2012 for the technical details of this derivation). In Section 2, we have already mentioned the arbitrary nature of the photometric errors that we have adopted in this study (given the absence of e.g. calibration uncertainties and aperture effects in our simulated photometry). That the best-fitting χ2 values are non-negligible (1 < χ2 < 20) highlights that there are differences between the SEDs emergent from the simulation and the magphys fitting libraries (which is not surprising because it is unlikely that the simple treatment of dust attenuation used in magphys can perfectly capture the relatively complex source and dust geometry of the simulated galaxies). As we shall discuss below, the generally reasonable parameter estimates that magphys derives, relative to the known simulated values, suggest that the χ2 threshold appears sufficiently large to allow us to confidently recover reasonable SED fits for the simulated SEDs; we shall return to this topic below.
The physical evolution of the isolated disc is simple: because there is no gas accretion in this idealized simulation, as time progresses, the gas content is depleted, the SFR decreases, and M⋆ increases. The time evolution of the various simulation quantities is qualitatively recovered by the SED modelling: the physical and fitted values of AV (panel b), dust luminosity Ld (panel d), Mdust (panel e), specific SFR (sSFR; panel f), and SFR (panel g) all decrease with time, whereas both the physical and fitted values of M⋆ (panel c) increase with time.
As well as the general trends, it is worth noting that the output parameters vary smoothly within the errors between adjacent time snapshots. This is reassuring because magphys fits each snapshot (and viewing angle) independently without knowledge that the snapshots/angles are related; the lack of discontinuities in the derived parameters offers considerable support for the reliability of the parameters that magphys produces.
However, the quantitative agreement between the physical and fitted parameters is more varied. Ld (panel d) is recovered exceptionally well because the simulated photometry samples the FIR SED well, in particular around the peak (e.g. Smith et al. 2013), and the model SEDs typically provide good fits to the simulated photometry. Although the inferred and true SFR12 values (panel g) agree well at early times, the true SFR is increasingly overestimated as the simulation progresses; the overestimate can be as much as ∼0.2 dex.
The dust mass13 (panel e) is systematically underestimated by ∼0.2–0.3 dex. This underestimation is at least partially due to the assumption in the simulations that the cold phase of the subresolution ISM has a negligible volume filling factor and thus does not absorb photons. Consequently, dust contained in the cold phase does not emit light and cannot be recovered. In Section 3.4.3, we discuss this issue in more detail.
Within the uncertainties, the inferred and true stellar masses (panel c) agree throughout the simulation. However, at early times, the median likelihood values can be less than the true values by ∼0.1–0.3 dex. Because the stellar mass is well recovered and the SFR is slightly overestimated, the sSFR (panel f) is also overestimated slightly.
For some viewing angles, AV (panel b) tends to be underestimated, whereas for others, it is typically overestimated. This is indicated more clearly in Fig. 3, which shows the AV recovered by magphys versus the true AV. For less attenuated (closer to face-on) viewing angles (angles 1, 5, 6, and 7), AV is slightly overestimated, whereas for more attenuated (closer to edge-on) viewing angles, AV is slightly underestimated by magphys. On average, AV is recovered to within 0.006 ± 0.129. For a given viewing angle, the inferred and true AV values typically differ by less than 0.2 mag.
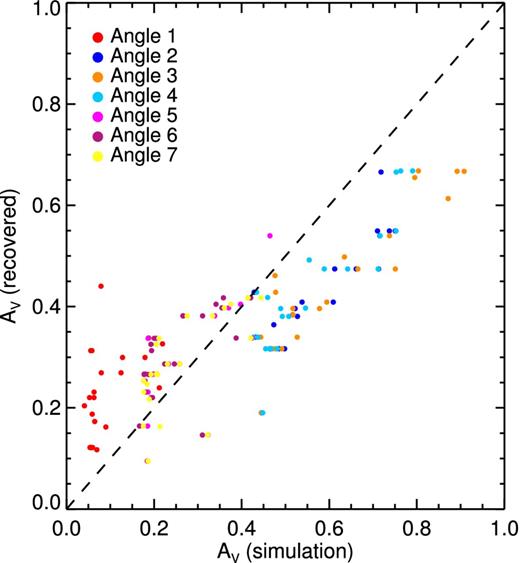
AV values of the magphys best-fitting SEDs versus the true AV values for the isolated disc simulation. The points are coloured according to the viewing angle, as specified in the legend. For viewing angles for which the true AV value is relatively low (angles 1, 5, 6, and 7), magphys tends to overestimate the AV values. Conversely, for viewing angles with higher AV values (angles 2, 3, and 4), magphys tends to underestimate AV. The average offset between the magphys and true AV values is 0.006 ± 0.129.
Although the other plotted quantities do not have direct physical analogues in the simulations, their time evolution is also of interest. Panels (k) and (l) show the magphys dust temperatures TCISM and TWBC versus time. TCISM and TWBC both tend to decrease as the simulation progresses. This decrease reflects the shifting of the simulated galaxy's SED to longer wavelengths with time because the strong decrease in luminosity coupled with a relatively weak decrease in the dust mass results in colder dust (see the discussion in Hayward et al. 2011). The median likelihood values for TCISM (TWBC) are in the range ∼18–23 (33–46) K, and the uncertainty, which is more significant than the variation with viewing angle, is ∼2 (5–10) K.
The total V-band optical depth, |$\hat{\tau }_{{V}}$| (panel i), and the V-band optical depth contributed by the diffuse ISM, |$\hat{\tau }_{{V,{\rm ISM}}}$| (panel j), both remain relatively constant over time. At all times, the diffuse ISM is optically thin and the total effective optical depth (birth clouds plus diffuse ISM) is ∼1–2, although there is significant variation with both time and viewing angle, and the uncertainty is relatively large. As the simulation progresses and the sSFR decreases, the fraction of the luminosity absorbed by the diffuse ISM, |$f_{\mu }^{\rm SFH}$| (panel h), increases. The diffuse ISM absorbs of order half of the total luminosity (|$f_{\mu }^{\rm SFH}\sim 0.3\hbox{--}0.6$|).
The variation with viewing angle is indicated by the differences among the magphys parameter values at a given time. For most parameters, the variation is less than the magphys uncertainties14 (i.e. the coloured lines lie within the shaded region). The notable exceptions are |$\hat{\tau }_{{V,{\rm ISM}}}$| and, to a lesser extent, |$f_{\mu }^{\rm SFH}$|. Physically, |$\hat{\tau }_{{V,{\rm ISM}}}$| should vary with viewing angle because as the disc is viewed closer to edge-on, the typical column depths along the line of sight are greater. For the same reason, |$f_{\mu }^{\rm SFH}$|, which is the fraction of the absorbed stellar light that is absorbed by the diffuse ISM rather than the birth clouds, should also vary with viewing angle. The physical viewing-angle-dependent variation in the obscuration is demonstrated by panel (b) of Fig. 2 and further highlighted in Fig. 3; as discussed above, the true AV values (the green lines) typically differ by only ∼0.2 mag from the best-fitting estimates.
3.3 Major galaxy merger
We now turn to the evolution of the major galaxy merger simulation. This merger exhibits the characteristic evolution of major mergers that induce strong starbursts (not all orbits result in such starbursts; see Cox et al. 2006). Because the progenitor galaxies are not initialized with bulges, which tend to stabilize the discs, a starburst with maximum SFR of ∼ 60 M⊙ yr− 1 is induced at first pericentric passage (t − t(SFRmax) ∼ −1.1 Gyr). Subsequently, the SFR decreases below the initial value. As the progenitor disc galaxies approach final coalescence (t − t(SFRmax) ∼ 0 Gyr), a starburst that is even stronger than that at first passage is induced by the tidal torques exerted by the galaxies upon one another. The SFR and Ld briefly exceed 100 M⊙ yr− 1 and 1012 L⊙, respectively (i.e. the simulated galaxy would be classified as an ultraluminous IR galaxy, ULIRG). Shortly after the peak of the starburst, the AGN contribution (see Section 3.4.1) is maximal; the AGN can contribute as much as 75 per cent of the total UV–mm luminosity (see e.g. Smith et al. 2010, for a detailed study of a real merger-induced starburst in a ULIRG exhibiting AGN activity). During the final starburst, a significant fraction of the available gas is consumed. Shock heating and AGN feedback heat the bulk of the remaining gas (see e.g. Hayward et al. 2014a for details). Consequently, the SFR plummets from ∼100 to less than ∼ 0.5 M⊙ yr− 1, and the AGN emission decreases rapidly.
To put the simulated merger in context, the time evolution of the simulated merger in the SDSS u − r colour versus r-band absolute AB magnitude Mr colour–magnitude diagram (CMD) is shown in Fig. 4. For completeness, the time evolution of the isolated disc is also shown. During most of the duration of the simulations, the galaxies are in the blue-cloud region of the CMD (see e.g. Baldry et al. 2004, 2006; Darg et al. 2010). After the starburst that is induced at final coalescence of the merging galaxies, the simulated merger continues its evolution towards the green valley, the locus of which is denoted by the green dot–dashed line (from Baldry et al. 2006). Because the simulation was terminated ∼0.5 Gyr after the peak of the starburst, the system does not transition on to the red sequence. Our aim is to investigate how well magphys can fit the SEDs of actively star-forming, IR-luminous galaxies, for which the full panchromatic capabilities of magphys can be utilized. Thus, the fact that the simulated merger does not enter the red sequence is irrelevant for the purposes of this work.
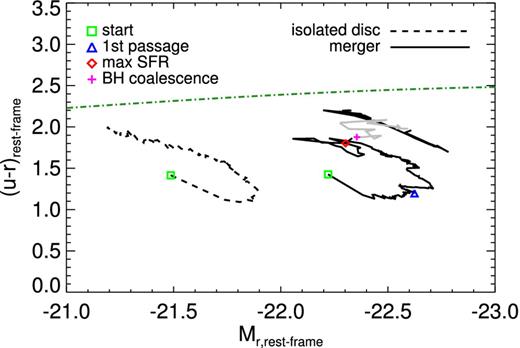
SDSS u − r colour versus r-band absolute AB magnitude for the simulated disc galaxy (dashed line) and galaxy merger (solid line). Various times of interest are marked, as described in the legend. The grey segment of the solid line indicates the time period of the merger simulation during which magphys does not yield acceptable fits to the simulated SEDs. The dashed line indicates the optimal separator between the blue cloud and red sequence from Baldry et al. (2006). For most of the duration of both simulations, the simulated galaxies are within the blue cloud. After the final starburst (red diamond), the simulated merger continues to approach the green valley. Because the merger simulation was terminated ∼0.5 Gyr after the starburst, there is not sufficient time for it to move to the red sequence.
It is worthwhile to note that the simulated galaxies occupy regions of the CMD that are populated by real galaxies (e.g. Baldry et al. 2004, 2006; Darg et al. 2010). This is true even in the phase of the merger simulation during which magphys is unable to yield an acceptable fit to the simulated SEDs; this time period is indicated by the grey segment of the solid line in Fig. 4.
Fig. 5 shows the results of applying magphys to the SEDs of the merger simulation; the panels are the same as in Fig. 2. As was the case for the isolated disc, magphys qualitatively recovers the true evolution of the physical parameters except for the stellar mass and dust mass for a short time near merger coalescence. For example, the times and amplitudes of the starbursts are captured exceptionally well. The success of magphys at inferring the time evolution of the merger is reassuring and perhaps even surprising because (1) the version of magphys used here was designed to treat relatively normal local galaxies, not ULIRGs; (2) magphys does not include emission from AGN, which is significant at some times (near-coalescence) during this merger simulation (the issue of AGN contamination will be discussed in detail in Section 3.4.1); (3) magphys treats each viewing angle and time snapshot individually without knowledge of one another; and (4) because of the first two reasons, magphys does not formally achieve a good fit to the SEDs during the coalescence stage of the merger [i.e. for − 0.1 ≲ t − t(SFRmax) ≲ 0.2 Gyr, the χ2 value is greater than the threshold for an acceptable fit; see panel (a)].
Similar to Fig. 2, but for the galaxy major merger simulation. The x-axis in each panel indicates the time relative to the peak of the starburst induced at coalescence. This convention thus provides some insight into the physical state of the system at a given time. The qualitative evolution and values of the various physical parameters are recovered very well, even during the coalescence-induced starburst phase, when the fits are formally unacceptable. As for the isolated disc case, the dust mass is systematically underestimated.
For most of the snapshots and viewing angles, the values inferred by magphys for most of the parameters are consistent with the true values within the uncertainties. Because the FIR photometry are typically well fit by magphys, Ld (panel d) is recovered extremely well. The SFR (panel g) is also typically recovered well; note that this is not necessarily a consequence of the excellent recovery of Ld because magphys includes a possible contribution to the dust luminosity from evolved stars that are not linked with the most recent burst of star formation. In the pre-coalescence phase [ − 1 ≲ t − t(SFRmax) ≲ −0.2 Gyr], the SFR tends to be overestimated slightly (by ≲ 0.1 dex), and in the post-starburst phase, it can be overestimated by as much as 0.6 dex (which is a smaller factor than would occur if a simple conversion from LIR were used; see Hayward et al. 2014b), irrespective of whether we consider magphys SFRs averaged over 10 or 100 Myr (i.e. the magphys default 100 Myr SFR-averaging time-scale is not the source of this discrepancy). The stellar mass (panel c) is recovered to within ∼0.2 dex except during the final coalescence/starburst phase, when the fits are statistically unacceptable. At early times, it is systematically underestimated.
In Sections 2 and 3.2, we discussed the choice of χ2 threshold that we use to identify bad fits, a threshold that is exceeded during the coalescence phase at the time of the peak starburst and AGN activity. That the threshold is exceeded here offers further encouragement for our arbitrary choice of photometric errors: using this χ2 threshold, we are able to get an acceptable fit to ∼95 per cent of the snapshots, and it is only during the ∼5 per cent of the simulation when the starburst and AGN activity are most intense that we are unable to derive a good fit to the simulated photometry. This time period is when the physics of the galaxy and the magphys library are most discrepant, and visual inspection of the ‘best-fitting’ SEDs suggests that these fits should be rejected.15 To summarize, although we adopt uncertainties on the simulated data out of necessity for the purposes of applying magphys rather than because of the physical effects that blight real data, the results that they produce do seem to be at least plausible and the resulting threshold value appears to function broadly as expected.
Returning to the recovered parameters, the sSFR (panel f) is typically recovered within the uncertainties, although at early times, the median likelihood values from magphys can be as much as ∼0.5 dex greater than the true values because of the underestimate of M⋆ at these times. The sSFR is slightly overestimated in the post-starburst phase because of the overestimate of the SFR at these times.
The dust mass (panel e) is systematically underestimated by ∼0.2–0.5 dex. However, as for the isolated disc, a significant part of the underestimate is because in the simulation, by construction, the dust in the ‘cold phase’ of the subresolution ISM does not absorb or emit radiation. We investigate and discuss this issue in detail in Section 3.4.3.
The time evolution of AV is shown in panel (b), but how well it is recovered can be read more easily from Fig. 6. For most of the merger simulation, the true AV is recovered to within ∼0.2 mag. The average offset |$\Delta A_{{V}}= A_{{V, \text{true}}} - A_{{V, \small {magphys}}} = 0.106 \pm 0.213$|. The upper panel of Fig. 6 indicates that, unlike for the isolated disc simulation, there is no significant viewing angle dependence because there are no ‘special’ viewing angles for this highly asymmetric system. The lower panel shows that there is no systematic offset between the true and inferred AV values, except for during the time period near the final starburst (indicated by the light-blue symbols), when the AV tends to be underestimated by magphys, sometimes by greater than 1 mag; however, as we have previously mentioned, we are unable to derive acceptable fits to the photometry during this stage of the merger.
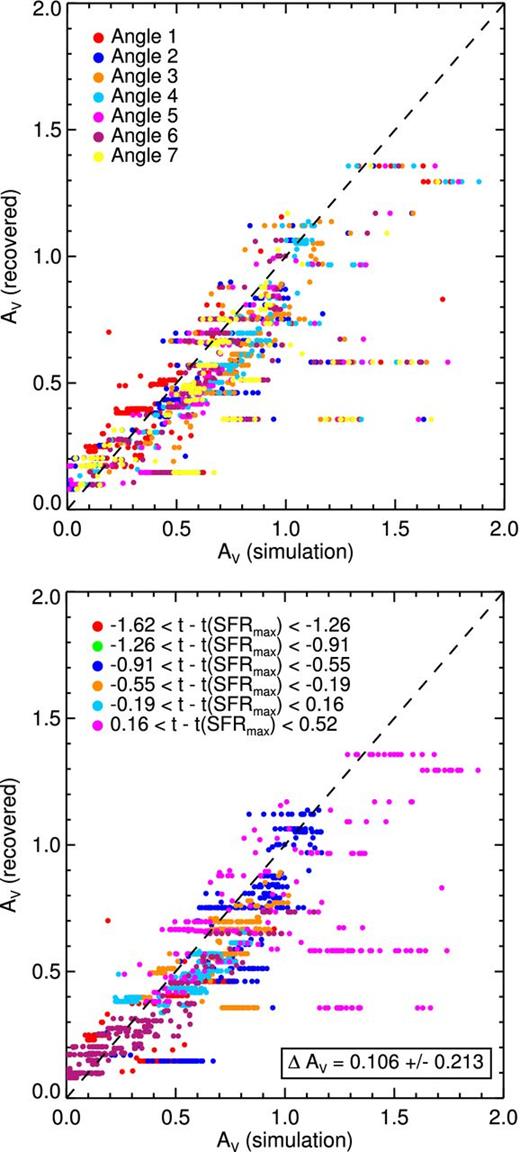
Median likelihood AV values from magphys versus true AV for all snapshots of the merger simulation. In the top panel, the points are coloured according to the viewing angle, whereas in the bottom panel, the colours indicate the time relative to the peak of the final starburst. For most of the simulation, magphys recovers the true AV to within ∼0.2 dex. However, near the time of the final starburst (the cyan points in the lower panel), AV can be underestimated by as much as ∼1 mag. Unlike for the isolated disc simulation, there is no significant viewing angle dependence.
The evolution of the magphys parameters that have no direct physical analogue in the simulations still provides some interesting insights into the physical state of the simulated galaxies. The cold (panel k) and warm (panel l) dust temperatures are in the range ∼20–25 and ∼36 − 60 K, respectively. Thus, they tend to be higher for the merger than for the isolated disc. The formal uncertainties are similar to those for the isolated disc, ∼1–2 and ∼5–10 K for TCISM and TWBC, respectively. Both temperatures increase sharply during the starburst induced at first pericentric passage (t − t(SFRmax) ∼ −1.15 Gyr); this behaviour reflects the increase in effective dust temperature (i.e. the shift of the IR SED peak to shorter wavelength; e.g. Smith et al. 2013) that is caused in starbursts primarily by the simultaneous sharp increase in luminosity and decrease in dust mass (Hayward et al. 2011).16 Although it is encouraging that the evolution of the magphys dust temperatures reflects this physical effect, this result should be interpreted with caution because of the significant error bars associated with TCISM and TWBC and the proximity of the median likelihood values to the bounds on the temperature priors (dotted grey horizontal lines in panels k and l).
The effective optical depths (panels i and j) are especially interesting. For most of the simulation, |$\hat{\tau }_{{V,{\rm ISM}}}\lesssim 1$|. Interestingly, |$\hat{\tau }_{{V,{\rm ISM}}}$| peaks during both starbursts, which is physically reasonable because the emission at those times is dominated by relatively compact, obscured starbursts. The variation with viewing angle is small, but it is greater than the formal uncertainty on |$\hat{\tau }_{{V,{\rm ISM}}}$|. The typical total optical depth |$\hat{\tau }_{{V}}$| is ∼2, but this value varies significantly with time and viewing angle and is very uncertain (i.e. at fixed time and viewing angle, the confidence interval can span the range |$\hat{\tau }_{{V}}\sim 0\hbox{--}4$|).
The fraction of the total luminosity absorbed by the diffuse ISM, |$f_{\mu }^{\rm SFH}$| (panel h), decreases sharply during the starbursts. This result is consistent with the physical expectation that in starbursts, the dust luminosity is dominated by highly obscured young stars. This is certainly true in the simulations, and it is impressive that the magphys parameter evolution reflects this effect, even when the fits are formally unacceptable during the starburst induced at merger coalescence. However, the decrease in |$f_{\mu }^{\rm SFH}$| during the starbursts may simply be a consequence of the assumed prior because by construction, only the birth clouds contain dust with T > 45 K.
As for the isolated disc case, most of the modelled parameters show little or no viewingangle dependence once the uncertainties are taken into account. The only exception is |$\hat{\tau }_{{V,{\rm ISM}}}$|; as explained above, this quantity should vary with viewing angle, whereas quantities such as the SFR and stellar mass should not.
3.4 Systematic uncertainties
In this section, we present tests in which we performed additional sunrise radiative transfer calculations on the merger simulation. In each test, we varied one of the assumptions in the sunrise calculation and kept all others identical to those of the default parameter run. The assumptions used for these tests are summarized in Table 2. These tests enable us to characterize how our ignorance of the underlying ‘microphysics’, such as the details of stellar evolution and the dust grain composition, affects the accuracy of the SED modelling.
sunrise runs used to investigate systematic uncertainties.
| Designationa | Descriptionb |
|---|---|
| fiducial | starburst99 SSP templates, AGN emission enabled, MW-type dust, default (clumpy) subresolution ISM model |
| agn-off | AGN emission disabled (solely in the radiative transfer calculations; see footnote 7) |
| lmc-dust | LMC-type dust used instead of MW-type dust |
| smc-dust | SMC-type dust used instead of MW-type dust |
| alternate-ism | Alternate subresolution ISM model (no subresolution clumpiness) |
aRun designation.
bDescription of the assumptions used in the sunrise calculations.
3.4.1 AGN contamination
The fiducialsunrise runs include emission from the AGN particles in the gadget-3 simulation. The AGN luminosity varies considerably with time because it is determined by the rate of gas inflow to the nuclear region(s) of the merging galaxies. The fractional contribution of the AGN to the total 1–1000 μm luminosity is shown in Fig. 7. The contribution is most significant during the time periods shortly after the starbursts induced at first pericentric passage and final coalescence, when the fractional contribution reaches ∼25 and ∼75 per cent, respectively. Thus, near those times, the AGN emission has a significant effect on the simulated SEDs (see Snyder et al. 2013 for a detailed study). Because magphys does not include a treatment of AGN emission, it is possible that the AGN emission can affect the ability of magphys to obtain a satisfactory fit and infer accurate parameters during the time periods of the simulation when the AGN contribution is significant. Thus, it is worthwhile to check how the results differ when the AGN emission is not included in the radiative transfer calculations.
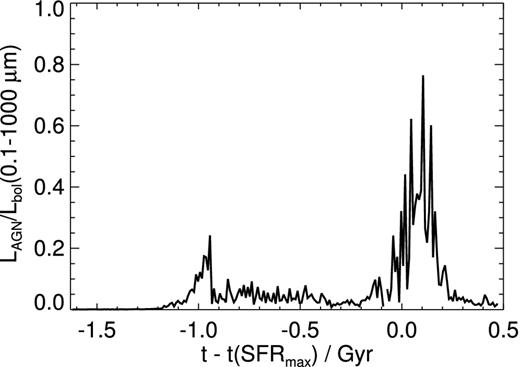
Fractional contribution of the AGN to the total 1–1000 μm luminosity versus time. The AGN contribution is most significant during the time periods shortly after first pericentric passage and final coalescence. The maximum AGN contribution, ∼75 per cent of the 1–1000 μm luminosity, is ∼100 Myr after the coalescence-induced starburst.
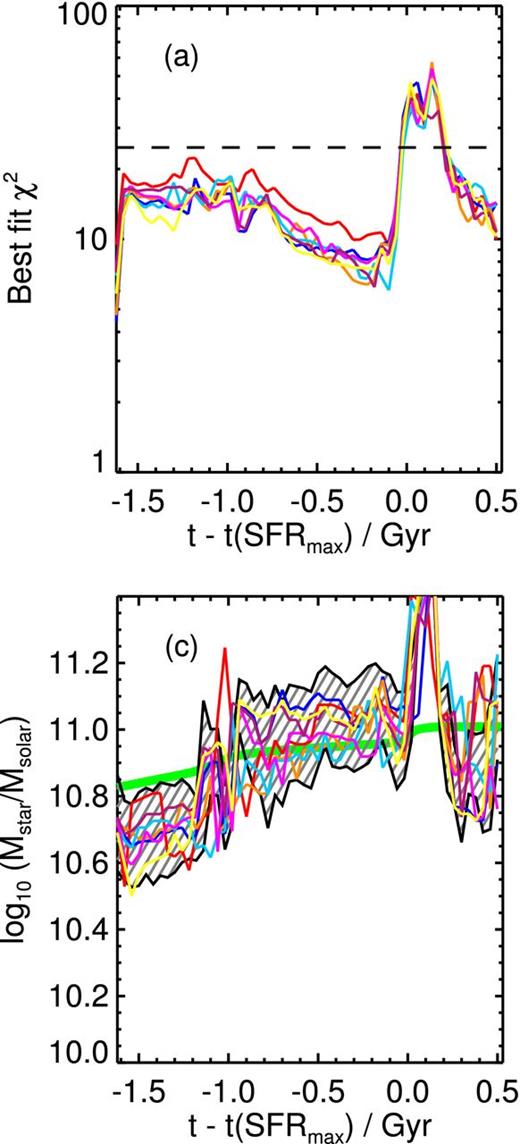
For the merger simulation, we performed a sunrise run in which we artificially set the AGN luminosity to zero (the agn-off run); by comparing the results of this run with the fiducial run, we can determine how AGN contamination affects the magphys results.17 For most parameters, the magphys results for the fiducial and agn-off runs do not differ significantly. However, the differences in the χ2 values and recovered stellar masses are of interest. The time evolution of these two quantities for the agn-off run is shown in Fig. 8. The χ2 values at the peak of the starburst and AGN activity [ − 0.1 ≲ t − t(SFRmax) ≲ 0.2 Gyr] are less when the AGN emission is disabled, which indicates that AGN contamination is part of the reason that magphys did not yield satisfactory fits for the fiducial run during that phase of the merger (however, the fits are still formally unacceptable at this time for the agn-off run). For the agn-off run, the stellar mass is recovered more accurately than for the fiducial case (compare panel c of Fig. 5 and the bottom panel of Fig. 8). Thus, AGN contamination partially causes the overestimate of the stellar mass in the fiducial run during the coalescence phase of the merger. Still, it is reassuring that although magphys does not account for AGN emission, most of the recovered parameters are robust to AGN contamination. Even when the AGN contributes ∼25 per cent of the UV–mm luminosity [at t − t(SFRmax) ∼ −1 Gyr], magphys is able to obtain acceptable fits to the photometry and recover the parameters accurately.18
![Selected results for the agn-off test. At the time of maximum AGN luminosity [t − t(SFRmax) ∼ 0.2 Gyr], the χ2 values for the best-fitting model (top panel) are less than for the fiducial run, which demonstrates that AGN contamination hinders the ability of magphys to obtain a satisfactory fit at the time when the AGN is most active. Note that the stellar mass (bottom panel) is recovered more accurately than for the fiducial run, which indicates that AGN contamination partially causes the overestimate of the stellar mass at that time in the fiducial run.](https://oup.silverchair-cdn.com/oup/backfile/Content_public/Journal/mnras/446/2/10.1093_mnras_stu2195/2/m_stu2195fig8.jpeg?Expires=1716611580&Signature=SYGUSWcBn3q1d60Vlngdc1tZLPmILZlm6sAuGWdhnzaMztnc5sW8KD3-KDZy5b33PwJcPn-~5fnMg36BdfHKNWM~jy9DufNjiCUFgf1Lu8G8QaEKSCO3oMfSCoBSvHYknjUywbGOW~Ga8PJy2EjqBWZatkBXeptIQdEuADi7oO6x-vLNFr-UXrzkzryFo43AuezWq2BhueRJJuhH6uJA6T97bDAwEvstCJ-UtGO8RsSPmceUgDPeagOOiJczxNEzMVcoyxJ9zQn-NdURZO~AiA9~90B3~RkWsm-bwUw79i1OxPIOtiN~1EUYlqorxNhTv0014e~6DFpcMT35Ar7DoQ__&Key-Pair-Id=APKAIE5G5CRDK6RD3PGA)
Selected results for the agn-off test. At the time of maximum AGN luminosity [t − t(SFRmax) ∼ 0.2 Gyr], the χ2 values for the best-fitting model (top panel) are less than for the fiducial run, which demonstrates that AGN contamination hinders the ability of magphys to obtain a satisfactory fit at the time when the AGN is most active. Note that the stellar mass (bottom panel) is recovered more accurately than for the fiducial run, which indicates that AGN contamination partially causes the overestimate of the stellar mass at that time in the fiducial run.
3.4.2 Dust grain composition
The dust properties are another source of uncertainty in the SED modelling procedure because the dust composition and grain size distribution affect the attenuation curve and shape of the dust SED. Dust in the ISM is a complex topic (see Draine 2003 for a review): even for the MW, LMC, and SMC, it is far from trivial to determine the detailed dust properties in some region of the ISM. Furthermore, the dust properties are likely very different in different regions of the ISM of a galaxy; for example, it is possible that typical grain sizes are greater in higher density regions (e.g. Kelly et al. 2012). Naturally, dust in high-redshift galaxies is even less understood than for local galaxies, and it may be possible that dust properties vary significantly with redshift because of e.g. the differences in the time-scales for the various dust production channels (e.g. Valiante et al. 2009; Michałowski et al. 2010b). Indeed, there is some observational evidence that dust in high-redshift galaxies differs from that in the MW (e.g. Buat et al. 2011, 2012; Kriek & Conroy 2013; Aller et al. 2014). Thus, dust is a potentially significant uncertainty inherent in SED modelling that cannot be ignored.
Because we typically do not have a detailed understanding of a galaxy's dust properties when fitting its SED, an empirically supported attenuation curve is typically assumed; at best, one can use a flexible attenuation curve parametrization, as is done in magphys, or multiple attenuation curves to help characterize the significance of this uncertainty. We have investigated this uncertainty by varying the intrinsic properties of the dust, which affect the effective attenuation curve and the FIR SED shape, used in the sunrise calculation. In addition to the default MW model, we performed sunrise runs in which the Draine & Li (2007) LMC and SMC models were used. Because the attenuation curve used by magphys was not changed, these tests mimic the situation in which the dust properties assumed when fitting a galaxy's SED do not correspond to the true dust properties of the galaxy.
Fig. 9 shows selected results for the lmc-dust run. The results for when LMC-type dust was used in the radiative transfer calculations are similar to those of the fiducial case, for which the MW dust model was used. The χ2 values (top panel) for the lmc-dust run tend to be greater than for the corresponding snapshot of the fiducial run, but the fits are still acceptable except during the near-coalescence phase of the merger. The only parameter that differs noticeably is the stellar mass: the median likelihood values yielded by magphys for the lmc-dust run are marginally (∼0.1 dex) greater than for the fiducial run.
Selected results for the lmc-dust test. When LMC-type dust is used to calculate mock SEDs of the simulated merger, the χ2 values (top panel) and stellar mass (bottom panel) differ considerably from the fiducial case; for all other parameters, the time evolution does not differ significantly from the fiducial case. For the lmc-dust run, the χ2 values are slightly higher. The median likelihood stellar mass values are systematically ∼0.1 dex greater, but for most of the evolution of the merger, they are still consistent with the true values.
Fig. 10 presents selected results for the smc-dust case, in which SMC-type dust was used in the radiative transfer calculations rather than the default MW-type dust. In this case, the χ2 values (leftmost panel) are significantly greater than for the fiducial case, and for most mock SEDs, magphys yields fits that are only marginally acceptable or unacceptable. For almost all snapshots, the median likelihood values for the stellar mass (second panel from left) differ from the true values by ∼0.2–0.4 dex, even when the fits are formally acceptable [e.g. − 0.8 ≲ t − t(SFRmax) ≲ −0.2 Gyr]. The median likelihood values for the SFR (third panel from left) and sSFR (not shown) can also differ significantly. Most notably, for most mock SEDs from the time period − 1.6 ≲ t − t(SFRmax) ≲ −1.2 Gyr, when the fits are still formally acceptable (although the χ2 values are often very close to the threshold for an acceptable fit), magphys infers an SFR of zero, but the true value is ∼ 20 M⊙ yr− 1. The reason for this considerable error can be understood from the rightmost panel of Fig. 10, which shows |$f_{\mu }^{\rm SFH}$|, the fraction of stellar luminosity that is absorbed by the diffuse ISM rather than the birth clouds. When the inferred SFR is zero, |$f_{\mu }^{\rm SFH}= 1$|, which indicates that magphys has attributed the considerable FIR luminosity (LIR > 1011 M⊙; see panel d of Fig. 5) exclusively to older stellar populations.
Selected results for the smc-dust test. When SMC-type dust is used, the quality of the magphys fits decreases considerably, as indicated by the systematically greater χ2 values (leftmost panel) compared with the fiducial case. For much of the evolution of the merger, the fits are only marginally acceptable or unacceptable. The median likelihood stellar mass values (second panel from left) agree much less well with the true values than for the fiducial run; although the fits are formally acceptable for − 0.8 ≲ t − t(SFRmax) ≲ −0.1 Gyr, magphys underestimates the stellar mass by as much as ∼0.3 dex. The inferred SFR (third panel from left) can be severely incorrect: for − 1.6 ≲ t − t(SFRmax) ≲ −1.2 Gyr, magphys infers an SFR of zero for most viewing angles when the true SFR is ∼ 20 M⊙ yr− 1, which is likely because magphys attributes all of the FIR emission to the diffuse ISM rather than the stellar birth clouds (i.e. |$f_{\mu }^{\rm SFH}= 1$|, as indicated in the rightmost panel).
To understand the origin of this discrepancy, it is instructive to investigate how well magphys is able to recover the true intrinsic SEDs. Fig. 11 shows an example of the SED fits for the t − t(SFRmax) = −1.47 Gyr snapshot of the smc-dust case. This figure is similar to Fig. 1, which shows SED fits for the fiducial case (refer to the caption of Fig. 1 for full details regarding what is plotted). For all viewing angles, magphys yields acceptable fits to the synthetic photometry. However, the intrinsic SEDs inferred by magphys (blue lines) differ considerably from the true intrinsic SED (grey line). magphys tends to underestimate (overestimate) the intrinsic UV (optical through NIR) emission. Because the true intrinsic SED is not recovered well by magphys (because the attenuation curve inferred by magphys differs significantly from the true attenuation curve; see below), it is unsurprising that the parameter values yielded by magphys can differ significantly from the true values. We suggest that this may be less likely to occur for real observations of actual galaxies than it is in our simulations because the inevitable addition of photometric measurement errors should ensure larger χ2 values, thereby making these discrepant fits unacceptable. Indeed, it may also be possible to ‘tune’ the arbitrary photometric errors assumed in the fitting to alleviate this potential issue, but we make no attempt to do so here.
Example SED fits for the t − t(SFRmax) = −1.47 Gyr snapshot of the smc-dust run; see the caption of Fig. 1 for a complete description of what is plotted. Unlike for the fiducial case, the intrinsic SEDs inferred by magphys (blue lines) differ significantly from the true intrinsic SED (grey line), even though magphys yields acceptable fits to the synthetic photometry. Consequently, for some parameters (e.g. the SFR), magphys recovers the true values poorly.
Fig. 12 shows a comparison of the true attenuation curve and the attenuation curve inferred by magphys for each viewing angle for the t − t(SFRmax) = −1.47 Gyr snapshot of the smc-dust run (for which the SEDs are shown in Fig. 11); the intrinsic SMC dust opacity curve (which has been arbitrarily normalized) is also plotted for comparison. For all snapshots, the true attenuation curve is significantly steeper than that inferred by magphys. Consequently, even if the AV value recovered by magphys is accurate, magphys will undercorrect (overcorrect) for dust attenuation in the UV (optical through NIR). This effect explains why the intrinsic SED tends to be underestimated (overestimated) in the UV (optical through NIR), as shown in Fig. 11 and described above.
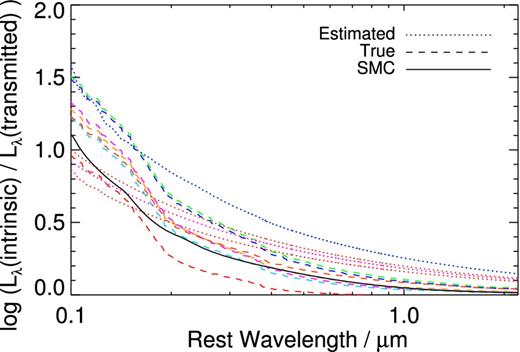
Comparison of the true attenuation curves (dashed lines) and attenuation curves inferred by magphys (dotted lines) for the t − t(SFRmax) = −1.47 Gyr snapshot of the smc-dust run. The different colours correspond to different viewing angles. The black solid line denotes the intrinsic SMC-type opacity curve (with arbitrarily normalization) that is used in the radiative transfer calculations. Generically, the true attenuation curves are significantly steeper than those inferred by magphys. Consequently, for the smc-dust case, magphys is unable to effectively correct for dust, and the unattenuated SED inferred by magphys differs considerably from the true intrinsic SED, as shown in Fig. 11. Thus, the recovered values of parameters such as the SFR can differ significantly from the true values.
Recall that the shape of the attenuation curve in magphys depends on the assumptions of the CF00 model, in which the optical depth scales as λ−1.3 in the ‘birth clouds’ and λ−0.7 in the ‘diffuse ISM’. In the simulations, the attenuation curve that results for a given snapshot and viewing angle depends not only on the intrinsic opacity curve of the dust but also the spatial distribution of stars and dust, which results in differential attenuation, and spatial variations in age and metallicity, which cause the intrinsic emission to spatially vary. Thus, it is perhaps unsurprising that the attenuation curves of the simulated galaxies are sometimes not described effectively by the standard CF00 model.19
The results for the smc-dust and, to a lesser extent, lmc-dust cases highlight the difficulty of accurately correcting for dust attenuation. Unfortunately, our understanding of the dust grain composition is still limited, even for relatively nearby galaxies (Amanullah et al. 2014; Patat et al. 2014), and there is evidence that galaxy attenuation curves can systematically vary with galaxy properties (e.g. Buat et al. 2012; Kriek & Conroy 2013). Thus, dust is likely to remain a significant uncertainty in SED modelling for some time, and one should interpret results that depend sensitively on the assumed attenuation curve with caution.
3.4.3 The presence of very cold dust
The Springel & Hernquist (2003) subresolution model implicitly splits the gas contained in a given SPH particle into cold, dense clouds (which contain the bulk of the mass but have a relatively low volume filling fraction) and a diffuse phase. In the default ISM treatment in sunrise, it is assumed that the cold phase has negligible volume filling fraction. Thus, the dust associated with the cold phase does not absorb photons and consequently does not emit radiation. This subresolution model is used as the default model in sunrise because the real ISM of galaxies is certainly not smooth on ∼100-pc scales. Unfortunately, the resolution of our simulations and subresolution ISM model used prevent us from resolving the full phase structure of the ISM. Simply ignoring the dust in the cold phase of the ISM is a crude approach for treating this unresolved clumpiness. However, for the purpose of testing how well magphys can recover the dust mass, it is clearly undesirable to include dust that does not absorb or emit radiation by construction.
To investigate the uncertainty in the result that is associated with unresolved clumpiness in the ISM, it is also possible to use the dust associated with both phases of the subresolution ISM, which may be more appropriate in some regimes; see Jonsson et al. (2010), Hayward et al. (2011), Snyder et al. (2013), and Lanz et al. (2014) for detailed discussions of this issue. We refer to this alternate treatment of subresolution clumpiness of the ISM as the ‘alternate ISM’ (or ‘multiphase-off’ in the parlance of Hayward et al. 2011) model. When the alternate ISM model is used, each cell in the sunrise grid contains the same or a greater mass of dust as in the fiducial case; for regions of high gas density (e.g. the central starburst), the difference can be an order of magnitude. Consequently, when the alternate ISM model is used, the attenuation along any line of sight is greater, and the dust temperatures tend to be colder because of dust self-absorption.
Fig. 13 shows the results for the merger simulation when we use the alternate ISM model in the sunrise calculation, which we refer to as the alternate-ism case. The trends for most magphys parameters are qualitatively the same as for the fiducial case. However, there a few interesting differences. Most importantly, the dust mass (top panel) is recovered significantly more accurately than for the fiducial run shown in Fig. 5. The reason for the superior agreement is that when the alternate ISM model is used in the sunrise calculation, all of the dust in the simulated galaxies can potentially absorb and emit radiation. In the fiducial run, the dust in the subresolution cold clouds does not absorb or reemit any radiation but is still counted as part of the total dust mass.
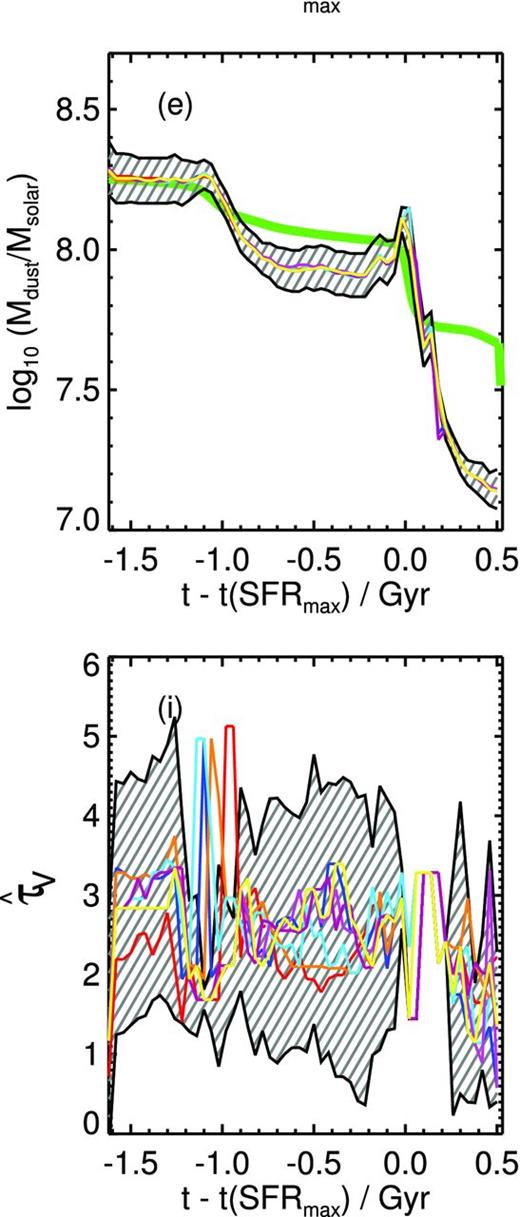
Selected results for the alternate-ism test, in which all dust in the simulated ISM (rather than just that in the diffuse ISM) was used. The dust mass (top) is recovered significantly more accurately than for the fiducial case, although it is still underestimated by ≲ 0.2 (as much as ∼0.6) dex during the phase between first pericentric passage and final coalescence (post-starburst phase). Furthermore, the total optical depth (bottom) and AV values (not shown) are greater than in the fiducial case, which reflects the fact that the attenuation along any line of sight is guaranteed to be greater in this case than when the default ISM model is used.
However, even in the alternate-ism case, the dust mass inferred by magphys is slightly ( ≲ 0.2 dex) underestimated during the phase between first pericentric passage, and it is significantly underestimated (by up to ∼0.6 dex) during the post-starburst phase. The likely reason for the remaining underestimate is that after the strong starburst and AGN activity, much of the remaining gas (and thus dust) is contained in a low-density, extended hot halo. Consequently, the optical depth through this halo is very low, and the dust contained in it absorbs little radiation. As a result, a significant fraction of the dust cannot be detected via emission. Furthermore, the total optical depth (bottom panel) and AV values (not shown) are typically greater than in the fiducial case. This result demonstrates that magphys qualitatively captures the key physical difference between the two runs.
Unfortunately, the need to use a subresolution ISM model in the sunrise calculations precludes us from determining which case is more correct. Ideally, use of the next generation of galaxy simulations, which are able to achieve parsec-scale resolution (e.g. Hopkins et al. 2013a,b, 2014), may eliminate this uncertainty.
4 DISCUSSION
4.1 Dependence on viewing angle
One of the strengths of our approach is its ability to test how, for a given simulated galaxy, the results of SED modelling vary with viewing angle. Ideally, estimates of intrinsic physical parameters of a galaxy, such as the SFR and stellar mass, should be insensitive to the perspective from which the galaxy is observed. For almost all magphys parameters plotted in this work, for a given simulation snapshot, the median likelihood values vary with viewing angle by less than the uncertainty; thus to all intents and purposes, viewing angle effects do not cause systematic errors in the results. This result is naturally quite reassuring because for real galaxies, only one viewing angle is available.
Some parameters (primarily |$\hat{\tau }_{{V,{\rm ISM}}}$|) do vary with viewing angle, but, in so far as the parameters can be interpreted physically, they should depend on viewing angle. Thus, this variation is not a cause for concern.
4.2 Other potential sources of error
In this section, we will briefly discuss other potential sources of error in SED modelling. This issue will be investigated in greater detail in future work.
4.2.1 Photometric uncertainties
Throughout this work, no noise was added when generating the mock photometry. Thus, the tests represent the ideal situation in which there are no observational uncertainties and the inherent physical uncertainties (i.e. those that originate from discrepancies between the model assumptions and reality) are the only source of discrepancies between the inferred and true parameters (i.e. they are the sole contributors to the best-fitting χ2). These tests are useful for understanding the fundamental limitations of the method that cannot be overcome through the use of more accurate photometry, but they are clearly unrepresentative of the real-world process of modelling galaxy SEDs. Consequently, it is worthwhile to examine the effects of including observational uncertainties when generating the mock photometry.
We performed a series of tests in which we added a simple Gaussian noise model to the mock photometry for the fiducial run, and used magphys to fit the noisy photometry with the same assumed errors discussed in Section 2.1 (similar tests were performed in Smith et al. 2012 to validate the consistency of magphys by feeding it photometry derived from several of the best-fitting SEDs with simulated Gaussian measurement errors superposed). As expected, the χ2 values were greater than for the noiseless case, and magphys did not yield a statistically acceptable fit for a significantly greater number of mock SEDs. However, the recovered median likelihood values for the physical parameters did not differ qualitatively (although the confidence intervals became wider), and the qualitative evolution of the various physical parameters of the simulation was captured just as well as for the fiducial case. This result suggests that the median likelihood parameter values yielded are robust to the inclusion of realistic random uncertainties and demonstrates the effectiveness of the Bayesian fitting method employed by magphys.
4.2.2 SED coverage
The results of SED modelling can potentially depend on the wavelength sampling of the photometry used (e.g. Pforr et al. 2012, 2013; Smith et al. 2012). In this work, the photometric bands used are those that were available for the initial H-ATLAS investigations, which provide relatively good coverage of the SEDs in the UV–NIR and FIR; MIR data are noticeably absent. Including MIR data could potentially change the results significantly. For example, MIR data may help to better constrain the relative contributions of young and old stellar populations to the dust heating. However, the MIR tends to be sensitive to the presence of AGN (see e.g. Snyder et al. 2013 for a detailed discussion). Thus, inclusion of MIR data could make it significantly more difficult to fit the synthetic SEDs using magphys.
Because galaxy surveys vary considerably in terms of the available photometry, it would be worthwhile to investigate the effects of varying the photometry used in the SED modelling. As a first test, we investigated the effects of excluding the PACS photometry. Although the agreement was generally good in the comparatively quiescent phases of the simulation, the most significant discrepancy was that the IR luminosity and SFR were underestimated by ∼0.5 dex during the starburst that occurs at first passage (but it is possible that this underestimate could be corrected by modifying the priors; da Cunha, private communication). This test further highlights the importance of the available photometry sampling the peak of the temperature-dependent SED for the purposes of recovering the true dust luminosity, in agreement with the investigation by Smith et al. (2013) which used isothermal models to fit the dust SEDs of H-ATLAS galaxies.
4.2.3 Emission lines
Another potential source of uncertainty is the contribution of nebular emission lines (which are typically not accounted for by SED modelling codes) to the broad-band photometry (e.g. Charlot & Longhetti 2001; Schaerer & de Barros 2009; Pacifici et al. 2012; Schenker et al. 2013; Stark et al. 2013). At certain redshifts, especially z ∼ 6–7, not accounting for contamination from nebular emission can cause the stellar ages (Schaerer & de Barros 2009) and stellar masses (Schenker et al. 2013; Stark et al. 2013) to be overestimated. Our simulated SEDs include nebular emission lines; thus, they can contribute to the broad-band photometry. Indeed, the contribution of Hα emission is the cause for the larger residuals near the i band that can be observed in Fig. 1, and this effect is also often seen in the SED fits of H-ATLAS galaxies in Smith et al. (2012). magphys is able to consider Hα emission as part of the input data set (although these data were unavailable at the time that Smith et al. 2012 was written); we defer a detailed investigation of the influence of emission lines on the derived SED parameters to a future investigation.
4.3 Applicability of the results to other SED modelling codes
It is important to keep in mind that we have only employed one SED modelling code, magphys, which has multiple advantages, including the following. (1) It utilizes the full UV–mm SED, and including information yielded by the dust emission can potentially break degeneracies that could not be addressed using UV–NIR data alone. (2) The underlying SFHs are continuous SFHs with superimposed random bursts. Consequently, it is not subject to the potential systematic errors that are associated with single-component SFHs (e.g. Michałowski et al. 2012, 2014). (3) Through its use of the CF00 dust attenuation model, differential attenuation of young stellar populations can be (approximately) accounted for.
Because magphys represents a relatively sophisticated, state-of-the-art SED modelling code, its success at recovering the physical properties of our simulated galaxies cannot be generalized to all SED modelling codes. Thus, it would be worthwhile to perform similar tests for other commonly used SED modelling codes. As a first step, Michałowski et al. (2014) tested the ability of multiple SED modelling codes to recover the stellar masses of simulated submm galaxies (SMGs). They found that as long as a single-component SFH was not used, all of the codes were able to accurately recover the stellar masses, albeit with a factor of ∼2 uncertainty. However, this work was deliberately limited in scope to the stellar masses of SMGs, and a more comprehensive comparison of SED modelling codes is warranted.
4.4 Recommendations for applying SED modelling codes
We have demonstrated that for the fiducial runs, magphys recovered the true physical parameter values of the simulated galaxies well. However, uncertainties in the ‘microphysics’, especially regarding the dust attenuation law, can cause serious discrepancies between the median likelihood parameter values output by magphys and the true values even when the fits are formally acceptable (although as we have discussed in Section 3.4.2, this should only affect a small fraction of SED fits). Consequently, for real galaxies, for which e.g. the dust attenuation law or IMF may vary with galaxy properties, there is a risk of making significant errors for some subset of the observed galaxy population when attempting to recover the physical parameters of the galaxies through SED modelling.
Because SED modelling is now applied to data sets that contain hundreds to hundreds of thousands of galaxies, it is infeasible to check the individual fits one-by-one to search for irregularities. One approach for avoiding significant misestimates of physical parameters would be to use a significantly more conservative χ2 threshold than what was used in this work. However, this would result in discarding many galaxies for which the vast majority of fits are acceptable and the parameters are well recovered, which is clearly undesirable.
Perhaps the best approach is to broaden the experimental priors in an attempt to ‘marginalize’ over our ignorance. This could be achieved, for example, by comparing the results derived using multiple distinct SED modelling approaches; ideally, the approaches should utilize different assumptions about e.g. the dust attenuation (see e.g. Bolzonella et al. 2000; Burgarella et al. 2005; Buat et al. 2011, 2012). Furthermore, simpler techniques, such as using empirical laws to estimate the SFR from LIR or radio continuum luminosity, should also be used; although these certainly have their own caveats, they can still provide additional insight, and current ‘panchromatic’ SED fitting codes lack the machinery to include radio continuum data in their analyses. For objects for which the results of different SED modelling approaches or/and simpler techniques differ, one should interpret the results with caution and investigate further. Such disagreements are especially likely for galaxies that differ significantly from the galaxies that were used for validation of the model, as is the case for magphys (with the standard priors) and submm galaxies (Rowlands et al. 2014a).
Such a multifaceted validation may seem tedious, and it would naturally require more human effort and computational time. However, we believe that the additional investment will be rewarded with significantly more robust results, or, at the least, a determination of the types of galaxies for which (some of) the physical properties must remain ‘known unknowns’ for the time being.
5 CONCLUSIONS
By applying the SED modelling code magphys to synthetic photometry generated by performing dust radiative transfer on hydrodynamical simulations of an isolated disc galaxy and a galaxy merger, we have investigated how well magphys can recover the intrinsic properties of the simulated galaxies. Our principal conclusions are the following.
For the isolated disc galaxy simulation, magphys yields acceptable fits at all times. The V-band attenuation, stellar mass, dust luminosity, SFR, and sSFR are recovered accurately. The dust mass is systematically underestimated, but whether this underestimation will occur for real galaxies is unclear (see conclusion vii).
For the galaxy merger simulation, when the assumptions regarding the IMF, SSP models, and dust composition in magphys and the dust radiative transfer calculations are similar, magphys yields acceptable fits and recovers all parameters except the dust mass well, except during the near-coalescence phase of the merger, when the starburst and AGN activity are most intense. During this phase, the fits are often not formally acceptable, but most parameters are still recovered reasonably well.
For most parameters, the variation in the median likelihood values with viewing angle is less than the uncertainty for a single viewing angle. For parameters that should depend on viewing angle, such as |$\hat{\tau }_{{V,{\rm ISM}}}$|, the variation with viewing angle can be greater than the uncertainty for a single viewing angle.
Although magphys does not include AGN emission, the galaxy properties that we infer are generally unaffected by AGN contamination. Even when the AGN contributes as much as 25 per cent of the UV–mm luminosity, magphys can obtain statistically acceptable fits to the photometry and recover the parameters accurately.
When either LMC- or SMC-type (rather than the default MW-type) dust is used to perform radiative transfer to calculate the mock photometry, magphys recovers some parameters less well. For the lmc-dust case, the median likelihood stellar mass values are ∼0.1 dex greater but still consistent with the true values within the uncertainties. When SMC-type dust is used, magphys yields marginally acceptable or unacceptable fits for the majority of the mock SEDs. Most notably, for some snapshots for which the SFR is ∼ 20 M⊙ yr− 1, magphys yields median likelihood SFR values of zero even though the fits are formally acceptable.
The amount by which the dust mass is underestimated depends on the subresolution ISM model used in the radiative transfer calculations. In the best case scenario, magphys recovers the dust mass well during the first passage and coalescence phases of the merger but underestimates it by ∼0.1–0.2 dex (as much as ∼0.6 dex) during the phase between first passage and coalescence (post-starburst phase).
Overall, our results constitute a somewhat mixed endorsement of the SED modelling approach: when the assumptions made regarding e.g. the dust attenuation curve are relatively consistent with the true attenuation curve, magphys performs very well. However, if, for example, the true dust attenuation curve differs significantly from that assumed by magphys, one may be better served by using less sophisticated but more transparent methods for inferring physical properties of galaxies from their SEDs. Regardless, one should use caution when performing SED modelling on large samples of galaxies and ideally cross-check the results by using multiple SED modelling codes and comparing with the results of simpler techniques.
We are very grateful to the anonymous referee, Elisabete da Cunha, Matt Jarvis, and Kate Rowlands for detailed comments on the manuscript. We thank Lauranne Lanz, Michał Michałowski, and Rüdiger Pakmor for useful discussions and Volker Springel for providing the non-public version of gadget-3 used for this work. CCH acknowledges the hospitality of the Aspen Center for Physics, which is supported by the National Science Foundation grant no. PHY-1066293, and the Centre for Astrophysics at the University of Hertfordshire, and he is grateful to the Klaus Tschira Foundation and Gordon and Betty Moore Foundation for financial support. DJBS acknowledges the hospitality of the Heidelberg Institute for Theoretical Studies. This research has made use of NASA's Astrophysics Data System Bibliographic Services.
Moore Prize Postdoctoral Scholar in Theoretical Astrophysics.
In this work, we use the more general term ‘SED modelling’ rather than ‘stellar population synthesis’ because the former can include additional sources of radiation, such as active galactic nuclei (AGN) and dust, beyond direct stellar emission.
For simplicity and in accordance with convention, throughout this work, we will use the terms ‘IR’ or ‘MIR–mm’ to denote the wavelength range 8–1000 μm, which accounts for the bulk of the dust emission.
Lanz et al. compared some of the physical properties inferred from the observed SEDs using magphys with the properties of the corresponding best-fitting simulated SEDs. However, they did not directly apply magphys to the simulated SEDs and thus only validated magphys in an indirect manner. Instead, the focus of Lanz et al. (2014) was a comparison of observed interacting galaxy SEDs with SEDs predicted from simulations. Here, we present a more direct and more detailed investigation of the ability of magphys to recover the properties of simulated galaxy SEDs.
Recently, various authors (e.g. Agertz et al. 2007; Springel 2010; Bauer & Springel 2012; Kereš et al. 2012; Sijacki et al. 2012; Vogelsberger et al. 2012) have highlighted issues with the standard formulation of SPH that may cause the results of simulations performed using the technique to be inaccurate. However, for the type of idealized simulations used in this work, the standard form of SPH yields results that are very similar to those of the more accurate moving mesh hydrodynamics technique (Hayward et al. 2014a).
sunrise is publicly available at http://code.google.com/p/sunrise/
A grain ‘species’ refers to grains of a single size and composition.
The local radiation field includes contributions both from the attenuated emission from stars and AGN and IR emission that is reradiated by dust; the latter source can be significant in e.g. the nuclear regions of starbursts, in which the optical depths can be extremely high.
Note that in principle, in a given radiative transfer calculation, there can be i × j distinct dust temperatures. In the simulations presented in this work, i can be as large as ∼106 and j = 220; thus, the total number of distinct dust temperatures in a single radiative transfer calculation can be ∼108.
The assumption of optical thinness in the FIR is likely to be reasonable for all but the most extreme local galaxies, and modelling normal galaxies was the original purpose for which magphys was designed. However, this assumption may be problematic for extremely IR luminous, highly obscured galaxies, such as submm galaxies (Hayward et al. 2012; Rowlands et al. 2014a).
Interestingly, this systematic bias is also seen in the H-ATLAS magphys analysis of 250-μm-selected galaxies in Smith et al. (2012).
The magphys SFRs plotted in this work correspond to SFRs averaged over the past 100 Myr, although our results are almost identical if we instead consider magphys SFRs with 10 Myr averaging. The value for the simulations is the ‘instantaneous’ SFR, i.e. the sum of the SFRs of the individual gas particles, which are calculated based on their gas densities and the assumed subresolution star formation prescription. Consequently, the SFR value for the simulations corresponds to an average over a shorter time-scale (i.e. less than the maximum time step, 5 Myr) than the magphys values. If the SFR varies significantly on 10–100 Myr time-scales, this difference could lead to discrepancies between the magphys and simulation values even if magphys recovers the SFH exactly. However, for most times in the simulations, this effect is minor.
The dust emissivities assumed by the two codes differ: in magphys, the emissivity is normalized by |$\kappa _{850\,{\mu \text{m}}} = 0.77$| g−1 cm2 (Dunne et al. 2000), whereas the MW dust model used in the simulations has |$\kappa _{850\,{\mu \text{m}}} = 0.38$| g−1 cm2. Consequently, we multiply the dust masses output by magphys by 2 to account for this difference.
Note that the none of the viewing angles is edge-on (but three have relatively high inclinations of 73| $_{.}^{\circ}$|4). Had we used an edge-on camera, the overall variation among viewing angles would certainly be greater. However, it is unlikely that our conclusions regarding the importance of viewing angle variation would change qualitatively, and the probability of observing real disc galaxies almost perfectly edge-on is low.
This effect also raises the tantalizing possibility of using poor fits as a means of identifying sources that have undergone recent mergers, though as discussed in Smith et al. (2012), there are several other possible reasons for poor fits (e.g. errors in the photometry, incorrect cross-identification, and/or artificially narrow prior libraries).
This effect is also seen around the peak associated with the merger coalescence, but the unacceptably high χ2 values during this stage of the simulation preclude any physical interpretation.
Because we used the same gadget-3 simulation, which includes black hole accretion and thermal AGN feedback, this sunrise calculation is technically not physically self-consistent. However, the virtue of this test is that it enables us to quantify the impact of the AGN emission on the simulated galaxy SEDs with all else (e.g. the SFH and galaxy geometry, which would be altered had we disabled black hole accretion and AGN feedback in the gadget-3 simulation) being equal. See Snyder et al. (2013) for a detailed analysis of similar tests.
Note that the lack of MIR photometry may be partially responsible for the robustness of the results to AGN contamination. However, in a similar test, Michałowski et al. (2014) included mock MIR photometry and also found that the stellar masses were robust to AGN contamination.
However, it may be possible to better correct for attenuation using the CF00 model by allowing the power-law indices of |$\hat{\tau }_{\lambda }^{\rm {BC}}$| and |$\hat{\tau }_{{V,{\rm ISM}}}$| to vary and marginalizing over this additional uncertainty.
REFERENCES
FULL FITTING RESULTS FOR ALTERNATE ASSUMPTION SUNRISE RUNS
For completeness, in this appendix, we present the full fitting results for the sunrise runs in which the physical assumptions were varied. The most interesting panels of these figures were already presented and discussed above.
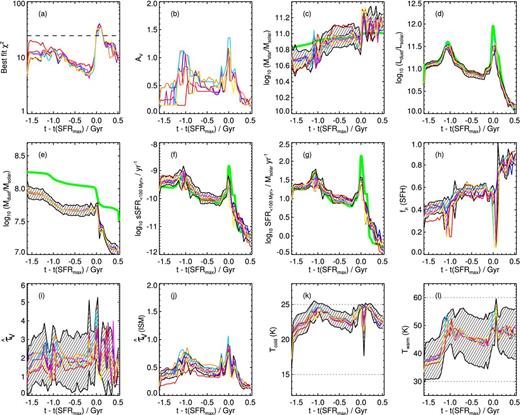
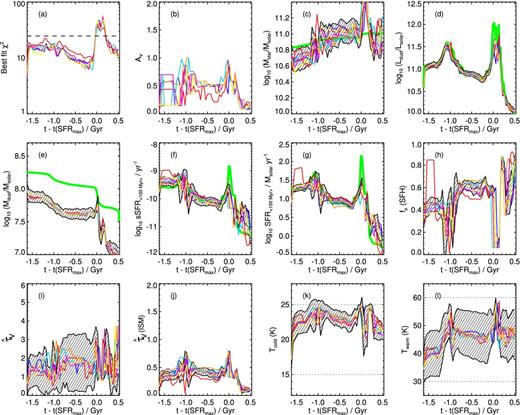
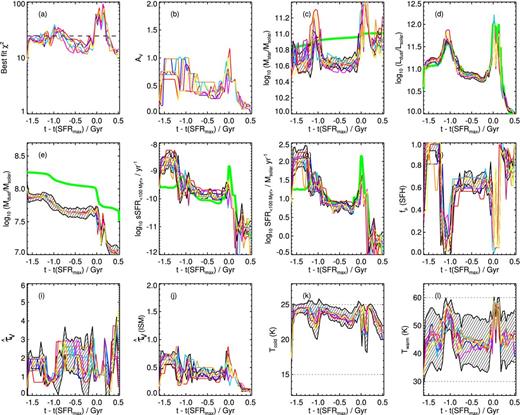
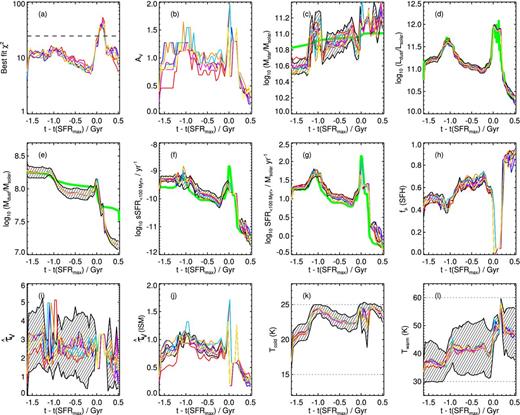
