


Abstract
We present the fiducial sequences of a sample of Galactic star clusters in the five bands of the Pan-STARRS1 (PS1) photometric system (gP1, rP1, iP1, zP1, and yP1). These empirical sequences – which include the red giant and sub-giant branches, the main sequence, and the horizontal branch – were defined from deep colour–magnitude diagrams reaching below the oldest main-sequence turn-offs of 13 globular and 3 old open clusters covering a wide range of metallicities ( − 2.4 ≲ [Fe/H] ≲ +0.4). We find excellent agreement for the nine clusters in common with previous studies in similar photometric systems when transformed to the PS1 system. Because the photometric and spectroscopic properties of these stellar populations are accurately known, the fiducials provide a solid basis for the interpretation of observations in the PS1 system, as well as valuable constraints to improve the empirical colour–Teff relations.
1 INTRODUCTION
Since its introduction by the Sloan Digital Sky Survey (SDSS; York et al. 2000), the ugriz photometric system has been widely adopted for optical observations, and adapted to the various instruments and needs of the surveys. In particular, the recent progress in deep-depletion CCD technology enhancing the quantum efficiency at the reddest wavelengths allows the addition of a y filter, which benefits greatly from being more immune to interstellar reddening – and therefore the possibility to peer deeper into the Milky Way disc – as well as higher temperature sensitivity for brown dwarfs studies and better constrained photometric redshifts. Thanks to the high throughput of the SDSS filters, it has become the reference system for many current and upcoming large sky surveys (e.g. Pan-STARRS1 (PS1): Kaiser et al. 2002; Large Synoptic Survey Telescope: Tyson 2002; Dark Energy Survey: The Dark Energy Survey Collaboration 2005; Subaru Hyper Suprime-Cam Project: Takada 2010; VST ALTAS: Shanks et al. 2013).
However, proper interpretation of the observed stellar populations depends on understanding the relation between the measured properties (e.g. colour, magnitude) and the physical properties (e.g. temperature, metallicity). One possibility is to compare directly the observations to stellar systems for which the properties are accurately known, such as globular and open clusters (GCs and OCs, respectively). It is also possible to use the observations of these clusters as robust empirical constraints to improve theoretical models. For example, previous studies have highlighted the difficulty of fitting the colour–magnitude diagrams (CMDs) of Galactic GCs using the current stellar evolution libraries (e.g. VandenBerg & Clem 2003; Dotter et al. 2007; An et al. 2008; Brasseur et al. 2010), and the need for semi-empirical colour–temperature relations obtained from accurate star cluster fiducials (e.g. VandenBerg & Clem 2003, see also Salaris, Cassisi & Weiss 2002).
We have taken advantage of the recently completed PS1 3π survey (see below) to define a library of empirical fiducial sequences in the five bands of the PS1 photometric system (gP1, rP1, iP1, zP1, and yP1) based on deep observations of a sample of Galactic star clusters. Our goal is to use these fiducials for comparison with the stellar populations of the Milky Way halo, satellites, and GCs; hence, we focus on old clusters. We briefly introduce PS1 in Section 2 and describe the photometry in Section 3. The cluster fiducials are defined and compared to literature values in Section 4. A summary is given in Section 5.
2 THE PS1 3π SURVEY
PS1 (Kaiser et al. 2010; Chambers et al., in preparation) is a 1.8 m optical telescope installed on the peak of Haleakala (Hawaii) and designed for dedicated survey observations. It is equipped with a 1.4 gigapixel imager (Onaka et al. 2008; Tonry & Onaka 2009) covering a 7 square degree field of view (∼3|$_{.}^{\circ}$|3 diameter). The 3π survey, which forms the basis of the work presented here, covers 3/4 of the sky in five optical to near-infrared bands (gP1rP1iP1zP1yP1; Tonry et al. 2012).
With an exposure time ranging from 30 to 45 s, individual exposures have median 5σ limiting AB magnitudes of 21.9, 21.8, 21.5, 20.7, and 19.7 for the gP1rP1iP1zP1yP1bands, respectively (Morganson et al. 2012); saturation occurs at ∼13.5 for gP1, rP1, and iP1, ∼13.0 for zP1, and ∼12.0 for yP1(Magnier et al. 2013). The whole sky visible from Hawaii is being observed four times per band and per year, over a period of about 4 yr, which will lead to an increased depth of ∼1.2 mag on the final stacked images (Metcalfe et al. 2013). The median seeing is a function of wavelength, ranging from 1.0 arcsec in yP1 to 1.3|$\,\text{arcsec}$| in gP1(Metcalfe et al. 2013). The individual frames are automatically processed with the Image Processing Pipeline (Magnier 2006) to produce a photometrically and astrometrically calibrated catalogue. In particular, the images are resampled to a uniform pixel size (0.25 arcsec) and aligned to the equatorial axes on regular areas on the sky (called skycells). These skycells are roughly 6250 pixels across (∼26|$\,\text{arcmin}$|), and the resulting images are called warps.
3 CLUSTER PHOTOMETRY
Using the 2010 edition of the Harris (1996) catalogue of Galactic GCs (Harris 2010, hereafter H10), we count 96 known GCs located in the footprint of PS1 (i.e. δ > −30; see Fig. 1). Because the objective of our work is to obtain well-defined cluster fiducials over a wide range of magnitudes, including the main-sequence turn-off (MSTO), we limited our analysis to nearby, well-populated, and low foreground reddening clusters. All the clusters from H10 satisfying the following constraints were selected: (m − M) < 16, E(B − V) ≤ 0.1, and MV < −6. This reduced the list to 11 clusters. To extend the range of metallicities covered by the sample, we added NGC 6838 (M71) and Pal 12, as well as the old OCs NGC 188, NGC 6791, and NGC 2682 (M67). The properties of the whole sample are summarized in Table 1.
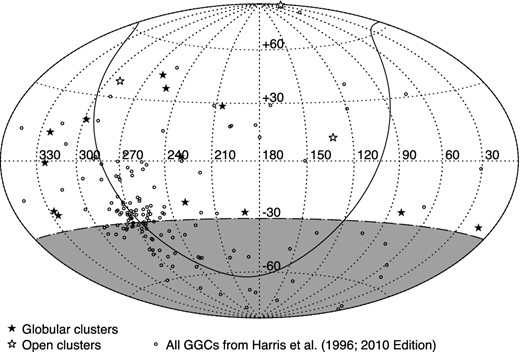
Distribution in equatorial coordinates of the GCs analysed in this work (filled stars), selected from the H10 catalogue of Galactic GCs (open circles). The three OCs in our sample are shown as open stars. The solid line traces the Galactic disc, while the greyed area represents the fraction of the sky not observable from the PS1 3π telescope.
Properties of the GCs and OCs in our sample, from H10 (GCs) and Dias et al. (2002, OCs).
| Name | Alt. name | RA (J2000) | Dec. (J2000) | [Fe/H] | E(B − V) | (m − M) | ra (arcmin) |
|---|---|---|---|---|---|---|---|
| NGC 288 | – | 00 52 45.24 | −26 34 57.4 | −1.32 | 0.03 | 14.84 | 13.2 |
| NGC 1904 | M79 | 05 24 11.09 | −24 31 29.0 | −1.60 | 0.01 | 15.59 | 8.0 |
| NGC 4590 | M68 | 12 39 27.98 | −26 44 38.6 | −2.23 | 0.05 | 15.21 | 14.9 |
| NGC 5272 | M3 | 13 42 11.62 | +28 22 38.2 | −1.50 | 0.01 | 15.07 | 28.7 |
| NGC 5897 | – | 15 17 24.50 | −21 00 37.0 | −1.90 | 0.09 | 15.76 | 10.1 |
| NGC 5904 | M5 | 15 18 33.22 | +02 04 51.7 | −1.29 | 0.03 | 14.46 | 23.6 |
| NGC 6205 | M13 | 16 41 41.24 | +36 27 35.5 | −1.53 | 0.02 | 14.33 | 21.0 |
| NGC 6341 | M92 | 17 17 07.39 | +43 08 09.4 | −2.31 | 0.02 | 14.65 | 12.4 |
| NGC 6838 | M71 | 19 53 46.49 | +18 46 45.1 | −0.78 | 0.25 | 13.80 | 8.9 |
| NGC 7078 | M15 | 21 29 58.33 | +12 10 01.2 | −2.37 | 0.10 | 15.39 | 27.3 |
| NGC 7089 | M2 | 21 33 27.02 | −00 49 23.7 | −1.65 | 0.06 | 15.50 | 12.4 |
| NGC 7099 | M30 | 21 40 22.12 | −23 10 47.5 | −2.27 | 0.03 | 14.64 | 19.0 |
| Pal 12 | – | 21 46 38.84 | −21 15 09.4 | −0.85 | 0.02 | 16.46 | 19.1 |
| NGC 188 | – | 00 47 28 | +85 15 18 | −0.03 | 0.08 | 11.56 | 8.5 |
| NGC 2682 | M67 | 08 51 18 | +11 48 00 | +0.03 | 0.04 | 9.49 | 12.5 |
| NGC 6791 | – | 19 20 53 | +37 46 18 | +0.42 | 0.16 | 13.51 | 5.0 |
aThe characteristic radius r represents the tidal radius for the GCs and the apparent radius for the OCs.
Because the survey data reduction is still ongoing, neither the reduced images nor the photometric catalogues are final. At the beginning of this project, the quality of the pipeline photometry in crowded regions was not optimal. It was thus decided to perform the stellar photometry on the PS1 images with the standard daophot/allstar/allframe suite of programs (Stetson 1994), which was specifically developed for crowded field photometry.
For each cluster (except NGC 188, see below), a single skycell was analysed; a region of ∼26 arcmin on a side is sufficient to sample a significant fraction of the area within the tidal radius of any cluster, regardless of their precise location within the skycell. Fig. 2 shows the spatial distribution of stellar objects within the studied skycell for an extended (NGC 5904) and a more compact (NGC 6791) cluster. All the warps in all five bands of a given skycell were retrieved from the PS1 Science Interface.1 Between 2 and 25 images per band were available for each cluster, with a median of 12 images per band.
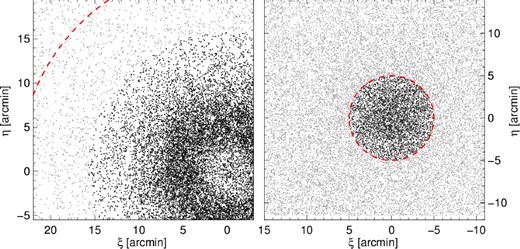
Spatial distribution, in standard coordinates, of the stars within the analysed skycell for GC NGC 5904 (left) and OC NGC 6791 (right). Black and grey points represent the stars used to determine the cluster fiducial and the rejected stars, respectively. The dashed circle in each panel shows the characteristic radius r (see Table 1).
We performed a first source detection at the 10σ level on the individual warps, which was used as input for aperture photometry. From this catalogue, 200 bright, non-saturated stars per warp were selected as potential point spread function (PSF) stars; an automatic rejection based on the shape parameters was used to clean the lists. Modelling of the empirical PSF was done iteratively with daophot: the clean lists were used to remove all the stars from the warps except PSF stars, so that accurate PSFs could be created from non-crowded stars. At each iteration, the PSF was modelled more accurately and the neighbouring stars thus removed better. Every few iterations, the degree of PSF variability across the image was also increased, from constant to linear, then quadratically variable.
We then created a median, master image by stacking all the warps from all the bands using the stand-alone program montage2. This master image, free of chip gaps and much deeper than any individual frame, was used to create the input star list for allframe by performing a second source detection. The output of allframe consists of a catalogue of PSF photometry for each image. A robust mean magnitude was obtained for each star by combining these catalogues with daomaster. The final photometry was calibrated to the PS1 system by matching our resulting catalogue to that produced and calibrated by the pipeline (see Schlafly et al. 2012) for the given skycell. Using several hundreds of stars in common in the uncrowded areas of the skycells, the residuals have a standard deviation ≲ 0.02 mag and show no trend with either magnitude or colour. The contribution of these transformations to the uncertainty of the individual magnitudes is therefore negligible (∼0.001).
The photometry of NGC 188 was performed in a slightly different manner from the other clusters. It is located in a part of the sky for which the data were not fully processed by the pipeline yet, leading to two minor differences: (i) the warps were not available, so the photometry was carried out on the unresampled, unrotated images of the cluster and (ii) the photometric calibration is preliminary and may not be as accurate as for the other clusters.
The final step consisted of cleaning the photometric catalogues of non-stellar objects and blended stars in order to obtain a well-defined stellar locus. This was possible thanks to the photometric quality parameters returned by allframe (χ and sharp), as well as the separation index sep (see Stetson, Bruntt & Grundahl 2003) to reduce the effects of photometric degradation due to crowding. Specifically, we used |$|\text{sharp}|\le 1.5$|, sep ≥ 3.5, and a magnitude-dependent χ. To limit the number of foreground contaminants, we only included objects within ∼1/2–1 characteristic radius r (see Table 1), depending on the density of surrounding field stars. The CMDs of the OCs NGC 188 and NGC 6791 were further cleaned by removing the foreground Milky Way stars based on their proper motions (Platais et al. 2003, 2011).
4 CLUSTER FIDUCIALS
4.1 Defining the cluster fiducials
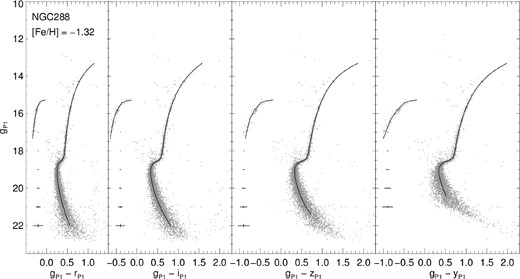
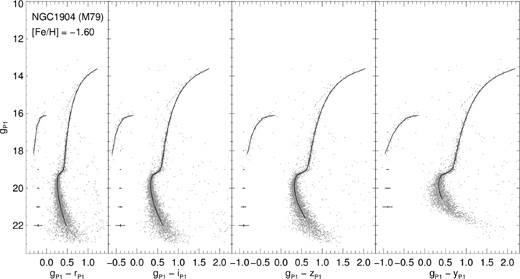
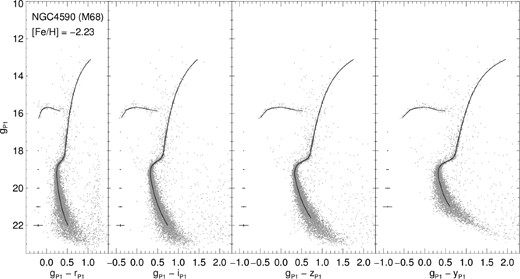
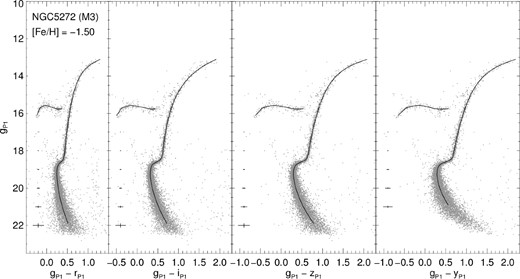
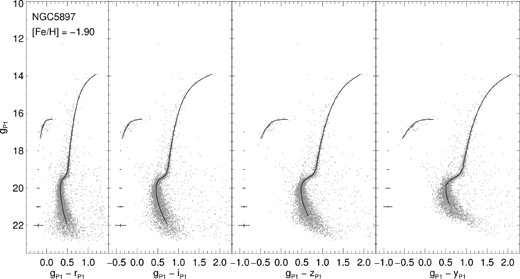
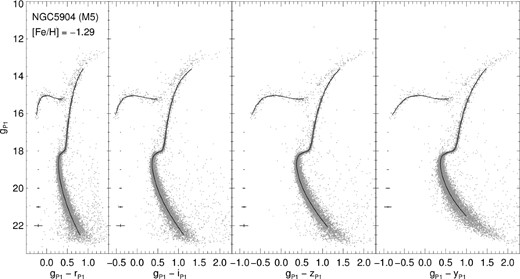
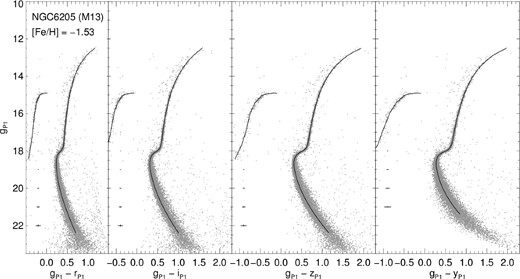
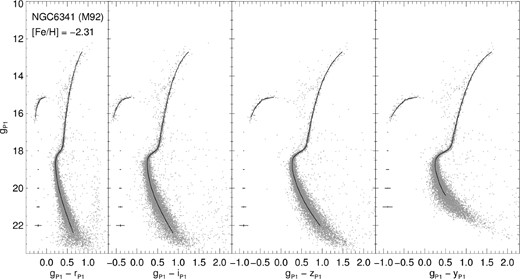
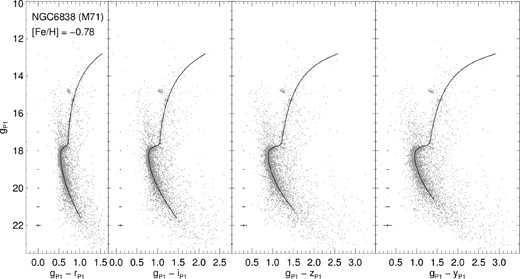
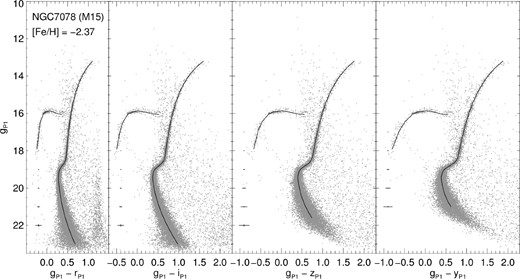
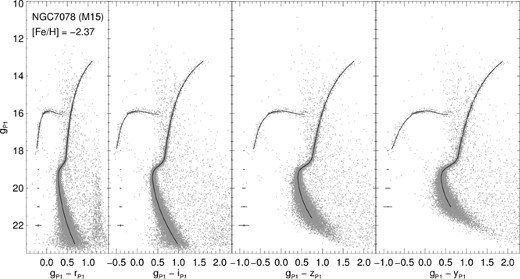
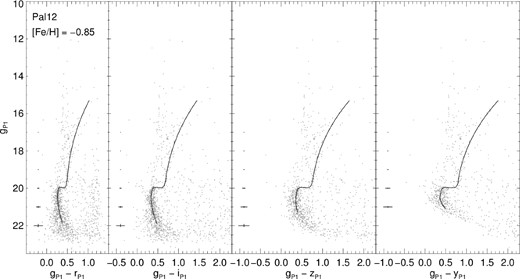
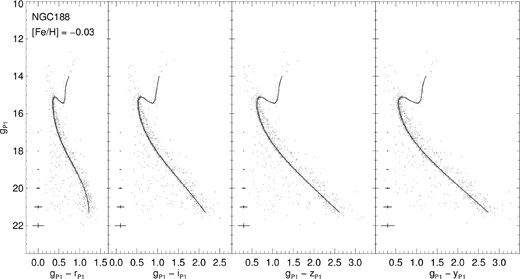
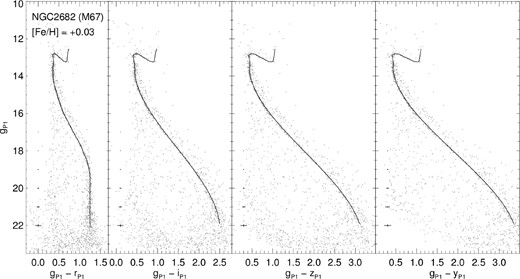
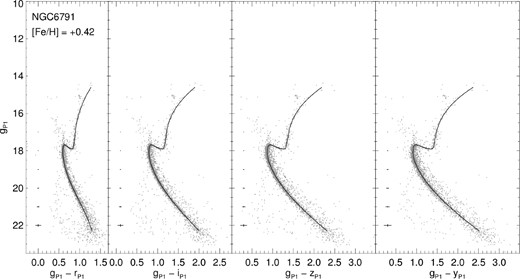
To determine the cluster fiducials, we found that the (gP1 − X, gP1) plane, where X represents one of the rP1, iP1, zP1, or yP1 filter, produced the best results since the MSTO is better defined by including bluer bands. Sample CMDs corresponding to these band combinations are shown in Fig. 3 .
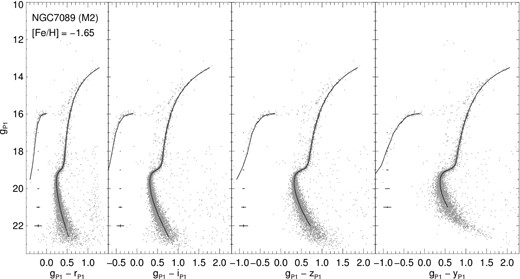
CMDs and corresponding fiducials for GC NGC 7089.
Given the typically small number of stars on the horizontal branch (HB) of individual clusters, we first created a robust HB fiducial by combining the HB stars of all the clusters together after correcting for the difference in distance and reddening. For each cluster, this fiducial was then simply offset in colour and magnitude, and then trimmed to match the observed HB. Fig. 3 shows the fiducials obtained in the various band combinations for NGC 7089, overplotted on the cleaned CMDs. The fiducials for the other clusters are shown in Appendix and are provided in tabular form available as Supporting Information with the online version of the paper.
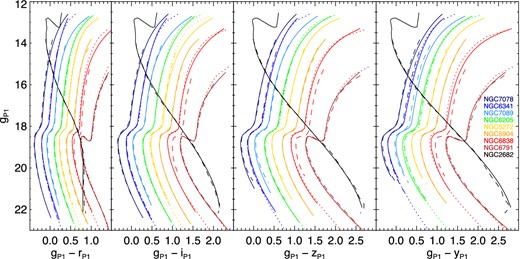
In Fig. 4, we present the fiducials of all the clusters colour-coded by their metallicity: the top and bottom panels show a CMD and a colour–colour diagram, respectively. The fiducials were converted to absolute magnitude and intrinsic colour assuming the distances and reddening from H10 and Dias et al. (2002), and the extinction in each band from Schlafly & Finkbeiner (2011). Note that the bright end of several fiducials does not include the tip of the RGB as stars brighter than gP1 ∼ 13.5 are saturated in the PS1 images. The CMDs clearly show the expected trend of redder colour and fainter SGB with increasing metallicity. A mild metallicity trend is also visible in the bottom panel; since this diagram is distance independent, it may prove useful for constraining the metallicity of field stars.
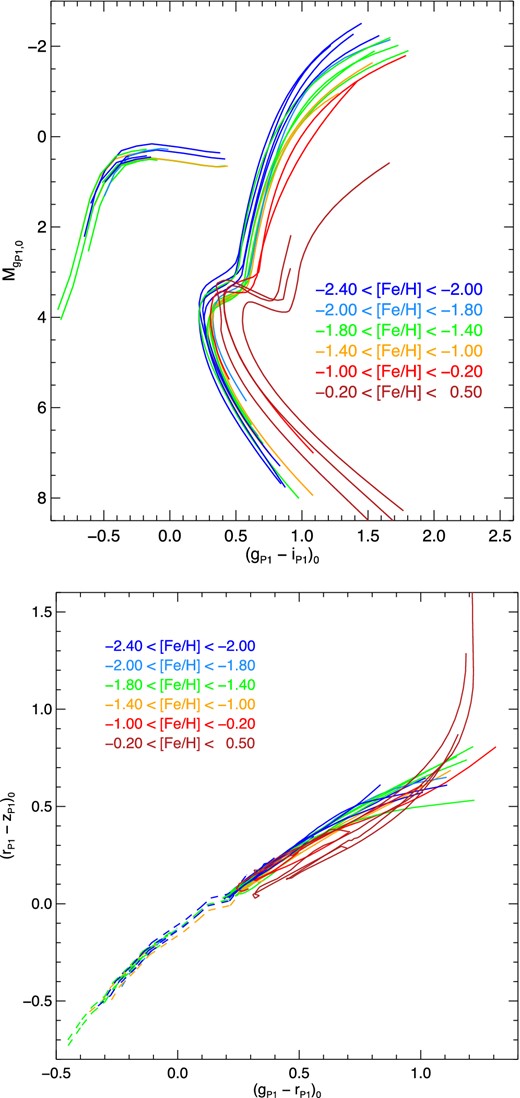
Comparison of the fiducials obtained for all the clusters, colour-coded by their metallicity as described in the insets, in a CMD (top) and colour–colour diagram (bottom). In the latter, the HBs are shown as dashed lines for clarity.
4.2 Comparison with literature fiducials
Given that the filter set has been designed specifically for PS1, there are no fiducials in the literature that are directly comparable to ours. However, fiducials have been obtained for a number of clusters in the SDSS ugriz and Canada–France–Hawaii Telescope (CFHT)/MegaCam u′g′r′i′z′ systems. The similarity of the PS1 filters to these allows the determination of robust transformations between the systems (see Tonry et al. 2012).
The first extensive set of fiducials was obtained by Clem, VandenBerg & Stetson (2008). They secured very deep observations of four GCs and one OC with the CFHT. The combination of long and short exposure times allowed them to obtain high-quality fiducials ranging from the tip of the RGB to roughly 4 mag below the MSTO. All the clusters they analysed are included in our sample. The work of An et al. (2008) was carried out with the SDSS images. Since the standard SDSS photometric pipeline could not handle the high stellar density in and around Milky Way clusters, An et al. (2008) re-analysed the images around the 17 GCs found in the SDSS footprint, as well as 3 OCs, with daophot/allframe. Seven GCs and two OCs are in common with ours.
We first converted the Clem et al. (2008) fiducials to the SDSS photometric system using the transformations from Tucker et al. (2006); both sets of fiducials were then transformed to the PS1 system using equation 6 in Tonry et al. (2012). Note that the SDSS and CFHT filter sets do not have a y filter, so this is extrapolated from the z band (see Tonry et al. 2012). Finally, we corrected the SDSS and CFHT r-band magnitudes for a systematic offset, in the sense that they appear too faint by 0.03 mag (Tonry et al. 2012, see also Fukugita et al. 2011).
The comparison is shown in Fig. 5. The fiducials defined in this work are shown as solid lines, while the ones from Clem et al. (2008) and An et al. (2008) are shown as dashed and dotted lines, respectively. For magnitudes fainter than gP1 ∼ 14, we find excellent agreement between the various sets (i.e. better than 0.02 mag in gP1, rP1, iP1, and zP1, and better than 0.06 mag in the yP1band), indicating that the photometric calibration and transformations between systems are accurate. The only exception is for NGC 6838 (M71). An et al. (2008) already noted an ∼0.1 mag offset to the red compared to the fiducials of Clem et al. (2008), citing the difficulty to obtain a reliable calibration in a field with high stellar crowding which prevented the SDSS pipeline to measure a sufficient number of stars. Our fiducials for this cluster agree with the ones of Clem et al. (2008) and therefore confirm the problematic calibration of the NGC 6838 photometry of An et al. (2008).
Comparison between the fiducials obtained in this work (solid lines) and those of the literature after transformation to the PS1 system: Clem et al. (dotted lines) and An et al. (dashed lines). The fiducials of individual clusters have been arbitrarily offset in colour and magnitude for clarity.
5 CONCLUSIONS
We have obtained deep, homogeneous photometry of a sample of GCs and OCs covering a wide range of metallicities from images of the PS1 3π survey. We used this photometry to derive fiducial sequences in the five bands of the PS1 photometric system. The comparison with literature fiducials in similar photometric systems shows very good agreement and therefore that the photometric calibration and transformations between systems are accurate.
These empirical isochrones, for which the photometric and spectroscopic properties are accurately known, can be used to characterize the properties of resolved stellar systems found in the footprint of PS1 and other surveys observing with the same filters, as well as to improve the empirical colour–Teff relations predicted from model atmospheres.
We are grateful to the anonymous referee for a constructive report. This research was supported by a consolidated grant from the Science Technology and Facilities Council. EFS and NFM acknowledge support from the DFG's grant SFB881 (A3) ‘The Milky Way System’. NFM gratefully acknowledges the CNRS for support through PICS project PICS06183.
The PS1 surveys have been made possible through contributions of the Institute for Astronomy, the University of Hawaii, the Pan-STARRS Project Office, the Max Planck Society and its participating institutes, the Max Planck Institute for Astronomy, Heidelberg, and the Max Planck Institute for Extraterrestrial Physics, Garching, The Johns Hopkins University, Durham University, the University of Edinburgh, Queen's University Belfast, the Harvard–Smithsonian Center for Astrophysics, the Las Cumbres Observatory Global Telescope Network Incorporated, the National Central University of Taiwan, the Space Telescope Science Institute, the National Aeronautics and Space Administration under Grant No. NNX08AR22G issued through the Planetary Science Division of the NASA Science Mission Directorate, the National Science Foundation under Grant No. AST-1238877, and the University of Maryland.
Note that Saviane et al. (2000) used the reverse notation, with x and y representing the colour and the magnitude, respectively.
REFERENCES
APPENDIX A: FIDUCIALS
Figs A1–A15 present the CMDs and corresponding fiducials for the full sample of clusters analysed in this work. The fiducials are also provided in tabular form available as Supporting Information with the online version of the paper.
CMDs and corresponding fiducials for GC NGC 288.
SUPPORTING INFORMATION
Additional Supporting Information may be found in the online version of this article:
Please note: Oxford University Press is not responsible for the content or functionality of any supporting materials supplied by the authors. Any queries (other than missing material) should be directed to the corresponding author for the paper.
