


Abstract
We present 5 GHz e-Multi-Element Radio-Linked Interferometer Network (e-MERLIN) observations of the Great Observatories Origins Deep Surveys North (GOODS)-N region at sub-arcsec resolution (0.2–0.5 arcsec). These data form part of the early commissioning observations for the e-MERLIN interferometer and a pilot for the e-MERLIN legacy programme e-MERLIN Galaxy Evolution Survey (eMERGE). A total of 17 sources were detected with S/N > 3. These observations provide unique information on the radio source morphology at sub-arcsec scales. For twelve of these sources, deeper 1.4 GHz MERLIN+Very Large Array observations at the same spatial resolution are available, allowing radio spectral indices to be derived for 10 sources on sub-arcsec angular scales. Via analysis of the spectral indices and radio morphologies, these sources have been identified as active galactic nucleus (AGN) cores in moderate-to-high-redshift (1 < z < 4) galaxies. These results have provided AGN (or AGN-candidate) classification for six previously unclassified sources and confirmed the AGN nature of the rest of the sample. Ultimately, the eMERGE project will image the GOODS-N region at 1.4 and 5 GHz with higher resolution (about 50 mas at 5 GHz) and down to sub-μJy sensitivities. The unique combination of sensitivity and spatial resolution will be exploited to study star formation and AGN activity in distant galaxies.
INTRODUCTION
The apparent relationship between the mass of a super-massive black hole (SMBH) and that of the pressure-supported spheroid hosting it (e.g. Magorrian et al. 1998) is one of the most clear empirical indications of the potential importance of active galactic nuclei (AGN) and accretion-driven feedback mechanisms in galaxy formation and evolution theories. Indeed, the peak of quasi-stellar object (QSO) activity has been established at z ∼ 2 (e.g. Schmidt 1968; Hasinger, Miyaji & Schmidt 2005), at the same epoch when star formation activity in the Universe was also at its peak. These processes often coexist in galaxies, with observational evidence for the presence of an embedded AGN in ultraluminous starburst (SB) galaxies (Alexander et al. 2005, 2008) and in 20–30 per cent of z ∼ 2 massive star-forming galaxies in the Great Observatories Origins Deep Surveys (GOODS, Giavalisco et al. 2004) fields (Daddi et al. 2007; Mullaney et al. 2012).
It is an essential if galaxy formation theories are to be tested that an assessment of the importance of embedded AGN activity in star-forming galaxies be made at moderate to high redshifts. As such, we need to identify the contribution of obscured accretion activity in bolometric surveys of the evolution of star formation. In other words, we need to identify and separately trace the total (obscured and unobscured) star formation in the bulges of individual high-redshift galaxies, the related nuclear activity and any star formation occurring on larger scales within a disc. Only by doing this we will be able to obtain a bolometrically complete census of star formation and of the growth of galaxies and their SMBHs. However, a complete census of both star formation and AGN galaxy activity, especially at high redshifts, is challenging due to dust extinction and gas obscuration by circumnuclear material.
Deep radio surveys provide a powerful, obscuration-independent tool for measuring both star formation and AGN activity in high-redshift galaxies, hence tracing the apparently simultaneous development of the stellar populations and the black hole growth in the first massive galaxies. Indeed, multiwavelength studies of deep radio fields show a composite population of star-forming galaxies and AGN (e.g. Prandoni et al. 2001; Ciliegi et al. 2005; Afonso et al. 2006; Simpson et al. 2006; Mignano et al. 2008; Padovani et al. 2009; Seymour et al. 2008; Smolčić et al. 2008), with the former dominating at the lowest flux densities (S < 50–100 μJy). Interestingly, about half of the AGNs probed in the deepest radio fields are characterized by relatively low radio-to-optical flux density ratios (R ≪ 100), as compared to classical radio-loud AGNs (see e.g. Padovani et al. 2009). This is a direct evidence of radio-quiet AGNs being present at μJy flux levels. Such a result supports the idea that radio-quiet AGNs are not necessarily radio silent (see Kukula et al. 1998), and paradoxically opens the perspective of studying the entire AGN population, including the radio-quiet component, at radio wavelengths.
Identifying AGN and SB components
Radio-quiet AGNs share many properties with star-forming galaxies: they have similar radio luminosities (1022 − 24 WHz−1) and similar infrared/radio flux ratios. In addition radio-quiet AGNs are typically characterized by Seyfert-2-like optical spectra, which are often difficult to distinguish from those of star-forming galaxies (see e.g. Prandoni, Morganti & Mignano 2009). This makes it difficult to separate radio-quiet AGNs from star-forming galaxies, even with multiwavelength information, although the availability of Infrared Array Camera (IRAC) colours and/or X-ray data can help (Prandoni et al. 2009; Del Moro et al. 2013).
One of the most direct ways to pinpoint embedded AGN cores in galaxies is the detection of a high surface brightness radio core through high resolution – very long baseline interferometry (VLBI)-like – observations. In order to reliably separate radio structures on several scales, from AGN core/inner jets (≪1 kpc) to nuclear/disc SBs (≥1 kpc) in high-redshift (z > 1) galaxies, sub-μJy imaging sensitivity together with milliarcsec resolution is clearly crucial (see e.g. Kewley et al. 2000; Garrett 2002; Biggs & Ivison 2008; Parra et al. 2010; Chi, Barthel & Garrett 2013). Pioneering Multi-Element Radio Linked Interferometer Network (MERLIN) observations at sub-arcsec resolution of the Hubble Deep field North (HDF-N) field, included in the GOODS North (GOODS-N) region, did show that below a flux density of about 70 μJy, the majority of the radio sources consist of powerful star-forming galaxies, typically at z < 1.5 (Muxlow et al. 2005, hereafter M05). However, a radio-AGN population was also morphologically identified, which had been classified as SBs at all other wavelengths (Casey et al. 2009).
e-MERLIN Pilot Observations
The e-MERLIN interferometer is a major upgrade of the existing MERLIN array working at centimetre wavelengths. The array consists of up to seven radio telescopes spread across the UK and is equipped with a new optical fibre network and correlator, providing a 10-fold sensitivity boost, compared to MERLIN.
The e-MERLIN Galaxy Evolution Survey (eMERGE) Legacy project (Muxlow, Smail & McHardy 2008) represents the largest element of the recently approved e-MERLIN Legacy Programme, a set of large and high-impact surveys addressing fundamental questions in astronomy and astrophysics. The eMERGE Survey project aims to exploit the unique combination of e-MERLIN sensitivity (sub-μJy rms noise) and spatial resolution [50 mas at 6 cm, comparable to that of the Hubble Space Telescope (HST)], to study star formation and AGN activities in high-redshift (1 < z < 4) galaxies, with special focus on possible coexistence and coevolution of the two phenomena. One of two fields targeted by the project is the GOODS-N, the most intensively observed area on the northern sky, which includes the HDF-N.
Here, we present early e-MERLIN commissioning data at 5 GHz of a 10 arcmin field within the GOODS-N region at sub-arcsec resolution in the framework of the e-MERGE project. One of the aims of these pilot observations is to pinpoint possible problems in the upgraded e-MERLIN system. The images are the first deep, sub-arcsecond e-MERLIN at 5 GHz of such region. These 5 GHz e-MERLIN observations can be considered as complementary to those previously obtained at 1.4 GHz with MERLIN and presented by M05 who combined MERLIN and Karl G. Jansky Very Large Array (VLA) images at 1.4 GHz for 92 radio sources with S1.4 > 40 μJy (extracted from the original 1.4 GHz catalogue, see Richards 2000), and located within a region of 10 × 10 arcmin2 centred at RA 12h36m49|$_{.}^{\rm s}$|4, Dec. +62°12′58|${^{\prime\prime}_{.}}$| 00 (J2000). These images (M05), were not corrected for the primary beam attenuation, have angular resolution in the range 0.2–0.5 arcsec and reach a 1σ sensitivity of about 3 μJy beam−1. The M05 data have recently re-imaged over a large contiguous area and primary beam corrected (Wrigley et al., in preparation) reaching a 1σ sensitivity of 3.5 μJy beam−1 at the pointing centre.
The new pilot C-band study presented here is ∼5 times shallower than the previous L-band observations of M05. This, together with the lack of short spacings information, makes our pilot observations best suited to pinpoint relatively bright and compact sources associated with radio-emitting AGNs, rather than probe faint and/or large-scale radio emission. Combining these pilot 5 GHz data with the new 1.4 GHz images (Wrigley et al., in preparation), we derived for the first time spectral indices at sub-arcsec resolution.
The paper is organized as follows. Sections 2 and 3 present the 5 GHz e-MERLIN commissioning observations, the data reduction and the source detection details. The spectral indices derived on sub-arcsec scale between the pre-existing 1.4 GHz data and the new 5 GHz ones are discussed in Section 5, together with the diagnostics used to identify AGN activity in the observed galaxies. Individual source details are given in Section 5.1, where the classification of each source is discussed. Conclusions and future perspectives are summarized in Section 6.
OBSERVATIONS AND DATA REDUCTION
As part of the commissioning activities of e-MERLIN, in 2011 July and August we observed a 10 arcmin diameter region within the GOODS-N field, centred at RA 12h36m40|$_{.}^{\rm s}$| 0, Dec. +62°12′47|${^{\prime\prime}_{.}}$| 98 (J2000), for a total of 156 h in the frequency range 4.5–5 GHz (hereafter referred to as 5 GHz). This position differs by about 1 arcmin from the pointing centre used by M05, but was chosen to maximize signal-to-noise ratio (S/N) at known source locations.
A sub-array of five of the seven e-MERLIN telescopes were used throughout these pilot observations, with the 76 m diameter Lovell and the 32 m Cambridge telescopes being unavailable at the time. The absence of the Cambridge antenna reduces the maximum spatial resolution of our 5 GHz observations, making it comparable to that of the previous 1.4 GHz MERLIN+VLA observations (see M05). Furthermore, the omission of the Lovell telescope gives rise to an approximately homogeneous array with 25 m diameter elements, yielding a predictable primary beam.
The 5 GHz data were taken in four adjacent 512 × 0.25 MHz intermediate frequency channels (IFs) and observed both circular polarizations, with correlator outputs integrated every second. The observations were conducted with a cycle time of 1.5 min on the phase calibrator and 8 min on the GOODS-N target yielding a total on-source integration time of 106 h.
Calibration
The data were inspected, flagged, calibrated and imaged using the National Radio Astronomy Observatory (NRAO) aips package, following standard procedures for wide bandwidth observations.
Visibilities that were clearly corrupted by instrumental phase errors, telescope errors or radio frequency interferences were spectrally removed (channel by channel) by using the tasks spflg and ibled.
All the calibrators and target data were then combined into a single multisource file and averaged down to 128 × 1 MHz channels, considerably reducing the size of the data set. The absolute flux-density scale was calibrated through observations of sources 3C 286 (primary flux calibrator) and 1407+284 (OQ208, secondary point-source calibrator) with flux density boot-strapped to 3C 286. Assuming a point-source model and a spectrum within the observing band for OQ208 we established a flux density equal to 2.45 Jy at the central observing frequency (Baars et al. 1977 scale).
The flux calibrator 1407+284 was also used for bandpass calibration whereas phase correction of visibilities were calibrated by observing the calibrator source 1241+603, located 2° away from the pointing centre. The average flux density for 1241+603 was measured to be 0.216 ± 0.007 Jy, a value consistent with the flux reported by the VLBA Calibrator List (NRAO)1 (0.21 Jy at 5 GHz).
The visibilities were then re-weighted to take into account the different sensitivities of the telescopes within the e-MERLIN array and finally time-averaged (4 s), in order to further reduce the data volume and speed up the imaging process. The effects of frequency and time averaging on the derived source fluxes are discussed in Section 3.
Imaging
We produced total intensity images of all 92 radio sources presented in M05. These were obtained by averaging the four available IFs (task IMAGR) and restoring clean components with a circular beam of 0.5 arcsec diameter. Image dimensions measure 128 × 128 pixels and a cell size equal to 0.0625 arcsec was chosen generating fields some 8 arcsec across. Whenever a detection was found within one of the 0.5 arcsec resolution fields, a higher resolution (0.2 arcsec) map was re-imaged. The only exception is source J123725+621128, a relatively extended double radio source (see last panel of Fig. 1 and source details in Section 5.1), where higher resolution imaging was not attempted in order to probe the extended emission visible at 1.4 GHz (M05). We also imaged 10 unresolved sources from the original 1.4 GHz VLA catalogue produced by Richards (2000) (see also Biggs & Ivison 2006; Morrison et al. 2010) with arcsec-scale flux density >300 μJy, located within a distance of 10 arcmin from our field centre at 0.2 arcsec resolution. These sources lie in a region outside the usable primary beam of MERLIN so were not included in M05.
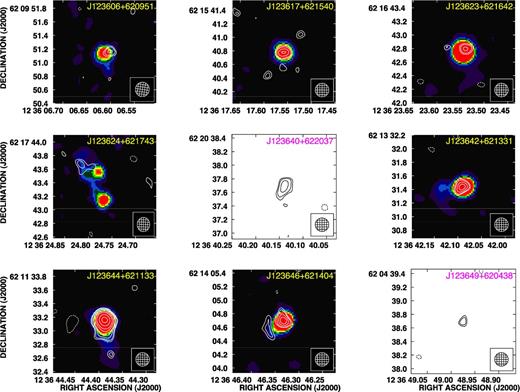
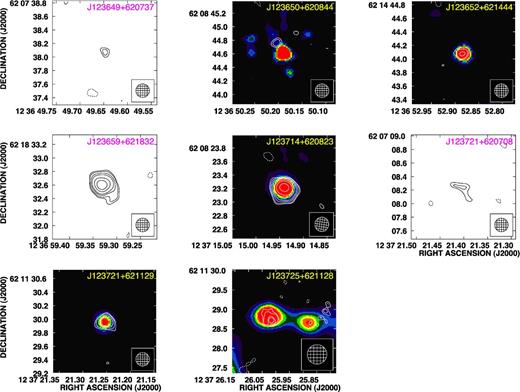
Radio contours of the sources detected at 5 GHz overlaid to the 1.4 GHz emission obtained by the combined MERLIN–VLA data (Wrigley et al., in preparation). The images with blank backgrounds do not have 1.4 GHz MERLIN–VLA data available. The restoring beam is 0.2 arcsec for all sources, except for source J123725+621128, where it is 0.5 arcsec. The contours are drawn at −2.5, 2.5, 3, 4, 5, 7, 10, 15, 20 times the local rms noise listed in Table 1.
– continued
All the images were cleaned until the peak of the residuals was about three times the rms noise (σ). Cleaning deeper risks so-called ‘clean bias’, that may affect deep imaging in presence of poor uv coverage (White et al. 1997; Condon 1998). Frequency channels at the edges of the passband are generally characterized by very low sensitivity, therefore the lowest rms noise level in the final images is obtained by excluding these channels. This results in an effective bandwidth of 120 MHz within each IF.
The average off-source noise level, measured before correction for the primary beam, in our naturally weighted images at 0.2 arcsec and 0.5 arcsec resolution is ≃15 and ≃ 20 μJy beam−1, respectively. From image analysis, we verified that the noise is close Gaussian, however, the values reported above are about two times higher than expected from thermal noise. The cause of sensitivity degradation in these early e-MERLIN commissioning 5 GHz observations have been identified with elements of the signal path introducing noise in the data signal. Following these observations, additional first stage amplification has been introduced to mitigate this effect.
The images were corrected for the primary beam attenuation, adopting the parameters used for the VLA antenna at 5 GHz. This is a reasonable assumption since all the antennas participating to our e-MERLIN observations are effectively 25 m dishes. The primary beam correction results in rms noise which increases as a function of distance from the pointing phase centre, varying from approximately 20–30 μJy within 200 arcsec of the pointing centre to 40–50 μJy at 300 arcsec before rapidly growing to several hundred micro-Janskys.
SOURCE DETECTION
At a 3σ threshold, a total of 17 sources were detected (12 from the M05 sample and five from the Richards (2000) catalogue). As expected, all these sources have relatively high measured flux densities (>80–100 μJy), and all but two are consistent with being unresolved. In contrast, all the M05 sources were resolved at 1.4 GHz. This is easily explained by the lack of short baselines in our 5 GHz e-MERLIN observations, together with a factor of ∼5 worse sensitivity than for the 1.4 GHz observations (coupled with the fact that extended synchrotron emission is typically characterized by a declining spectrum with frequency).
The five sources from the Richards (2000) catalogue are located at larger angular distances from the phase centre and are brighter than those in the M05 sample.
The measured source parameters are presented in Table 1 which include the distance from the pointing centre, the local rms noise value, the peak position, the S/N, the integrated flux density at 1.4 and 5 GHz. The source redshift is included, where available. For unresolved sources, the integrated flux density is equal to the peak brightness, obtained through a quadratic polynomial fitting (aips verb maxfit), whereas for the two extended sources, the integrated spectral flux density is derived by integrating over a circular region with radius of 5 pixels centred on the peak flux position. The peak brightness of the sources is corrected for the combined bandwidth and time smearing effects following Bridle & Schwab (1989) which predicts that sources within a distance of 300 arcsec from the pointing centre (imaged with a resolution of 0.2 arcsec) have intrinsic peak brightnesses reduced by up to 10 per cent, while at ∼400 arcsec the smearing reduces the peak flux density by up to ∼30 per cent. These smearing corrections, in combination with primary beam uncertainties, yields highly uncertain flux density measurements for sources lying beyond 400 arcsec from the pointing centre. In these cases, we only provide a rough estimate of their flux densities which, being all unresolved, are set equal to their peak flux density measurements.
Radio sources detected by e-MERLIN at 5 GHz. Column 1: source name; Column 2: distance from the pointing centre; Column 3: local rms noise after the primary beam correction; Column 4: right ascension and declination of the peak; Column 5: signal-to-noise ratio; Columns 6 and 7: integrated flux densities at 5 and 1.4 GHz, respectively; Column 8: redshift. All parameters refer to 0.2 arcsec resolution images, with the exception of source J123725+621128, for which the resolution is 0.5 arcsec. In italic are the sources with uncertain flux density due to the large primary beam and smearing corrections.
| Source | d | σlocal | Position | S/N | S5 | S|$_{1.4}^{a}$| | z | |
|---|---|---|---|---|---|---|---|---|
| (arcsec) | (μJy) | RA | Dec. | (μJy beam−1) | (μJy beam−1) | |||
| J123606+620951 | 293 | 40 | 12 36 06.60 | 62 09 51.16 | 4.0 | 161 | 302 | 0.6379b |
| J123617+621540 | 233 | 28 | 12 36 17.55 | 62 15 40.77 | 5.1 | 140 | 176 | 1.993c |
| J123623+621642 | 261 | 35 | 12 36 23.54 | 62 16 42.80 | 3.7 | 130 | 437 | 1.918c |
| J123624+621743 | 314 | 45 | 12 36 24.82 | 62 17 43.67 | 3.3 | 150 | 230 | – |
| J123640+622037 | 470 | 234 | 12 36 40.14 | 62 20 37.69 | 4.7 | ∼1100 | 0.8d | |
| J123642+621331 | 46 | 16 | 12 36 42.09 | 62 13 31.44 | 5.7 | 93 | 259 | 4.424e |
| J123644+621133 | 81 | 17 | 12 36 44.39 | 62 11 33.16 | 21.6 | 543 | 722 | 1.050f |
| J123646+621404 | 89 | 18 | 12 36 46.33 | 62 14 04.70 | 5.7 | 201 | 168 | 0.961b |
| J123649+620438 | 492 | 303 | 12 36 48.97 | 62 04 38.69 | 3.3 | ∼1000 | 0.113g | |
| J123649+620737 | 317 | 51 | 12 36 49.65 | 62 07 38.10 | 3.3 | 169 | 2.315h, i | |
| J123650+620844 | 254 | 31 | 12 36 50.20 | 62 08 44.76 | 3.5 | 109 | 160 | 0.434b |
| J123652+621444 | 147 | 20 | 12 36 52.89 | 62 14 44.08 | 4.1 | 83 | 66 | 0.321b |
| J123659+621832 | 369 | 67 | 12 36 59.33 | 62 18 32.69 | 12.6 | 850 | – | |
| J123714+620823 | 361 | 71 | 12 37 14.94 | 62 08 23.21 | 18.3 | 1305 | 1369 | – |
| J123721+620708 | 447 | 194 | 12 37 21.40 | 62 07 08.24 | 3.1 | ∼600 | – | |
| J123721+621129 | 299 | 47 | 12 37 21.25 | 62 11 29.96 | 6.7 | 300 | 199 | 1.56j |
| J123725+621128 | 331 | 49 | 12 37 26.04 | 62 11 28.67 | 3.8 | 187 | 546 | – |
Contour images at 5 GHz of the 17 detected sources are shown in Fig. 1. The radio contours are overlaid on the pre-existing 1.4 GHz images obtained at the same resolution. As mentioned earlier, the five detected sources selected from the VLA catalogue by Richards (2000) were not imaged by M05. Therefore, for such sources we do not have a sub-arcsec 1.4 GHz image.
In general the source peak positions at 1.4 and 5 GHz are coincident within the errors, suggesting a common origin of the two emissions. The two most notable exceptions are sources J123624+621743 and J123650+620844 where a significant offset is found between the 1.4 and 5 GHz emission centroids. These particular sources will be discussed further in Section 5.
Fig. 2 shows our source detection expectation based on the flux densities of the sources at 1.4 GHz used here as a proxy of those expected 5 GHz, under the assumption that the dominant component of the radio emission is a compact, flat spectrum (α = 0) AGN core. Such fluxes have to be compared to our 3σ detection threshold. It is clear that only the brightest sources in the M05 sample can be in principle detected. This is mainly a consequence of the fact that in our maps the achieved noise is, as already mentioned in Section 2, a factor of 2 higher than expected.
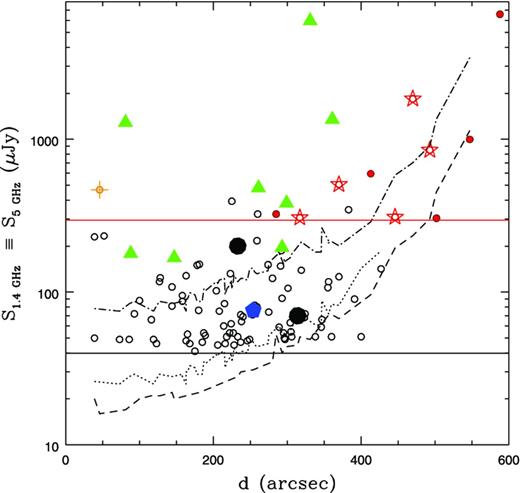
1.4 GHz flux density versus distance from the pointing centre for the 92 sources imaged by M05 and Richards (2000). Undetected sources are shown as black empty circles for the M05 sample and red filled circles for Richards (2000) sources. Detected sources are indicated by symbols in different colours corresponding to different source classifications (from M05 or Richards 2000, see discussion in Section 5): AGN (green triangles); starburst (SB, blue pentagons); possible composite source (AGN+SB?, orange pointed crosses); unclassified source (black circles and red stars for M05 and Richards 2000 sources, respectively). The black horizontal line indicates the flux density limit of the M05 sample (92 sources with S(1.4 GHz) > 40 μJy), whereas the red horizontal line indicates the flux density limit of the additional 10 sources from the Richards (2000) catalogue imaged in the framework of this work (S(1.4 GHz) > 300 μJy). The dashed and dotted lines represent the rms measured in the 5 GHz images we produced at 0.2 and 0.5 arcsec resolution, respectively. The dot–dashed line represents our 3σ detection threshold.
PINPOINTING AGN CORES IN GOODS-N GALAXIES
As discussed in Section 1, a clear separation between AGN and star formation processes in galaxy samples can be very difficult, especially at high redshifts, where gas/dust obscuration can be very important and composite systems (where both phenomena coexist) are likely to be more frequent. One of the safest way to classify extragalactic radio sources as AGN or SB is through optical spectroscopy. Unfortunately, these kind of observations can be extremely time consuming or not possible at all due to the faintness of the targets. Moreover even spectral classification is not always clear, especially in presence of low-luminosity Seyfert-2 AGNs, whose spectra are not always easily distinguished from those of SB galaxies.
AGN/SB discrimination methodology
A multiwavelength approach is typically used when attempting to separate AGN from star-forming galaxies, possibly taking advantage of all available diagnostic tools. Each diagnostic test, taken by itself, is usually not sufficient to securely classify galaxies, but when two or more criteria can be verified, the classification can be considered more reliable.
The following diagnostics have been used by M05 to classify the 92 sources in their sample.
The radio–far-infrared (FIR) correlation – this correlation is remarkably tight for star-forming galaxies and holds over a wide range of luminosities (e.g. deJong et al. 1985; Condon 1992; Beswick et al. 2008) and redshifts (e.g. Garrett 2002). However, the radio–FIR correlation is not useful to distinguish star-forming galaxies from radio-quiet AGNs (see discussion in Section 1).
The X-ray luminosity – low-redshift SB galaxies are soft-band (<2 keV) dominated sources (Ptak et al. 1999; Alexander et al. 2002) with X-ray luminosities LX < 1035 W. X-ray luminosities LX > 1035 W, on the other hand, usually indicate the presence of an AGN (Richards et al. 2007). However, exceptions exist, like e.g. low-luminosity radio galaxies with X-ray luminosities in the range LX ∼ 1033-1035 W (Evans et al. 2006).
The radio morphology – jets/lobes emission is a clear indication of the presence of a radio AGN. A sub-arcsec-scale bright compact core can be associated with an AGN, although the possibility of a compact SB can not be excluded at a resolution of 0.2 arcsec (corresponding to ∼1–1.5 kpc at 1 < z < 4, see M05; Richards et al. 2007; Batejat et al 2012 for Arp 220; Bondi et al. 2012 for Arp 299). The optical appearance, if observations with enough resolution are available, can be usefully coupled to the radio morphology to discriminate between an AGN and SB origin of the radio emission.
The radio spectral index – radio emission with spectral index α ≲ 0.4 (S ∼ ν−α) is likely to be powered by an AGN. On the other hand, steeper spectrum emission can be produced by either radio jets/lobes (and therefore still AGN dominated) or by supernova remnants (SB dominated). Inspecting the radio morphology with an adequate resolution can allow discrimination between these two possibilities.
By applying these diagnostic tools, a classification as AGN/AGN-candidate or SB/SB-candidate was proposed by M05 for most (∼82 per cent) of their 92 radio sources. Nine additional sources were later classified by Richards et al. (2007).
As discussed in Section 1, one of the most direct ways to pinpoint embedded AGN cores in galaxies is the detection of a flat-spectrum high surface brightness self-absorbed radio core through high-resolution multifrequency observations. In this paper, we take advantage of our pilot sub-arcsec 5 GHz e-MERLIN observations, to better assess the presence of AGN cores in GOODS-N galaxies. By combining our 5 GHz maps with the recently re-cleaned and primary beam corrected MERLIN+VLA data at 1.4 GHz (Wrigley et al. in preparation), obtained at same resolution, we derived 1.4–5 GHz spectral indices for 10 of the 17 detected sources. Spectral index information and radio morphologies were both used to confirm previous AGN classification, when available, and to provide a new one for the sources still unclassified. The spectral index information is particularly relevant here, first because the radio morphology alone does not necessarily allow us to discriminate a compact SB from an AGN core (see discussion above, diagnostic iii). Secondly, brightness temperature measurements would not help us in the source classification, as the spatial resolution of our observations is not high enough to be sensitive to excess of 105 K. Indeed, the angular resolutions of our maps (0.2–0.5 arcsec full width at half-maximum) give brightness temperatures in a range (700–5000 K).
Our classification also takes advantage of any pre-existing multiwavelength information, in line with those used by M05 and Richards et al. (2007).
The spectral index analysis of M05 (see diagnostic iv above) was based on 1.4 and 8.5 GHz radio fluxes obtained from arcsec resolution images (3.5 arcsec, Richards 2000), whereas our spectral indices are instead derived between 1.4 and 5 GHz sub-arcsec resolution flux densities. The latter are therefore better suited to pinpoint flat-spectrum compact AGN cores.
For the unresolved sources at 5 GHz, the spectral index is derived using the peak flux density of the corresponding 1.4 GHz component, when the peaks at the two frequencies overlap. For the two sources (J123624+621743 and J123650+620844) with a significant positional offset between the peaks at the two frequencies (see discussion in Section 3) we do not provide a spectral index. For the two extended sources at 5 GHz (J123644+621133 and J123646+621404), we derived the total flux at the lower frequency integrating over the same region used to derive the flux density at 5 GHz. It is worth noting that for source J123725+621128, we detect only the emission from a region eastwards the core, and therefore the spectral index refers to this area.
One caveat must be stated clearly: whereas the 1.4 and 8.5 GHz observations were made relatively close in time (1–2 yr), our e-MERLIN 5 GHz observations are separated from the 1.4 GHz data by more than 10 yr. Variability in the radio domain may therefore be an issue and should be considered in the interpretation of our spectral indices.
RESULTS
The derived spectral indices are presented in Table 2, together with the previous determination between 1.4 and 8.5 GHz at arcsec resolution (Richards 2000). For sources not previously imaged at sub-arcsec scale by M05, we derive a spectral index using the arcsec-scale 1.4 GHz (and 8.5 GHz, where available) flux density measurements (Richards 2000) and our sub-arcsec 5 GHz flux densities. Such spectral indices have to be considered as tentative, since sub-arcsec 5 GHz flux densities may be underestimated with respect to those obtained at lower resolution. For reasons of conservatism, such spectral index values are not included in Table 2.
Spectral index and source classification comparison. Column 1: source name, Column 2: previous radio classification based on sub-arcsec radio imaging, Column 3: spectral index between 1.4 and 8.5 GHz (Richards 2000). Column 4: spectral index between 1.4 and 5 GHz. Column 5: new classification. The five sources listed at the bottom do not belong to the M05 sample and do not possess a classification based on sub-arcsec scale imaging.
| Source | Classa | |$\alpha ^{1.4}_{8.5}$| | |$\alpha ^{1.4}_{5.0}$| | Classb |
|---|---|---|---|---|
| J123606+620951 | AGN | ≥0.56 | 0.53 ± 0.23 | AGN |
| J123617+621540 | Uncl | ≥0.55 | 0.19 ± 0.22 | AGN? |
| J123623+621642 | AGN | 0.63 ± 0.07 | 1.02 ± 0.23 | AGN |
| J123624+621743 | Uncl | – | ||
| J123642+621331 | AGN+SB? | 0.94 ± 0.06 | 0.86 ± 0.18 | AGN+SB? |
| J123644+621133 | AGN | 0.30 ± 0.05 | 0.24 ± 0.11 | AGN |
| J123646+621404 | AGN | −0.04 ± 0.06 | −0.15 ± 0.20 | AGN |
| J123650+620844 | SB | ≥0.80 | – | |
| J123652+621444 | AGN | 0.12 ± 0.07 | −0.19 ± 0.25 | AGN |
| J123714+620823 | AGN | 0.15 ± 0.08 | 0.04 ± 0.09 | AGN |
| J123721+621129 | AGN | −0.28 ± 0.06 | −0.35 ± 0.22 | AGN |
| J123725+621128 | AGN | 1.35 ± 0.06 | 0.90 ± 0.22 | AGN |
| J123640+622037 | AGN | AGN | ||
| J123649+620438 | – | AGN | ||
| J123649+620737 | – | 0.56 ± 0.07 | AGN? | |
| J123659+621832 | – | 0.26 ± 0.07 | AGN | |
| J123721+620708 | – | AGN? |
In general there is a reasonable agreement between the two spectral indices, although we notice a tendency for our 1.4–5 GHz spectral indices to be flatter than those derived between 1.4 and 8.5 GHz. This is expected, as sub-arcsec resolution spectral indices are likely to better probe self-absorbed AGN cores than those derived at arcsec resolution. This supports multifrequency sub-arcsec radio imaging as a promising technique to pinpoint AGN cores in high-redshift galaxies.
Table 2 summarizes the pre-existing source classifications based on sub-arcsec radio imaging obtained by M05 and Richards et al. (2007) and, where available, on higher resolution VLBI imaging (Garrett et al. 2001; Chi et al. 2013). The additional five sources not belonging to the M05 sample (listed at the bottom) do not therefore have such classifications available. As expected, eight of our sources are associated with galaxies classified as AGN or AGN-candidates by M05 or Richards et al. (2007) (Fig. 2). One of the additional sources was classified as a possible composite SB+AGN object (Fig. 2). Six sources were also detected by higher resolution VLBI observations at L band (Garrett et al. 2001; Chi et al. 2013), confirming the presence of an AGN core at the very centre of the galaxy. Only one source was previously classified as a SB galaxy. Our new classification is discussed for each source in Section 5.1 and the results are summarized in the last column of Table 2.
We detect sources preferentially classified as AGN/AGN-candidates rather than SB components which, as mentioned earlier (see Section 3), is a consequence of the fact that our 5 GHz observations are sensitive only to the bright compact radio sources in the observed field, and of the fact that AGNs are detected in large fractions at the brighter end of sub-mJy radio samples (78 per cent at S1.4 GHz > 500 μJy, Mignano et al. (2008). Indeed of the 19 sources in our sample S1.4 GHz > 300 μJy, 10 of the 11 detected are positively identified as AGN/AGN-candidates (Fig. 2). Under the conservative assumption that the undetected sources are all lower surface brightness star-forming galaxies, we can conclude that at such flux densities ∼53 per cent (10/19) of the sources are AGN dominated. Going to lower flux densities (100 < S1.4 GHz < 300 μJy), and limiting our statistical analysis to sources within d ≤ 300 arcsec from the image centre, where our detection threshold is sensitive enough (see Fig. 2), we detect only four additional sources (out of 19 in these flux and distance intervals). Three of such sources are associated with AGN/AGN-candidates, corresponding to ∼16 per cent of the total (3/19). This has to be considered as a conservative estimate of the AGN fraction, as we cannot exclude, in this flux interval, to have steep-spectrum AGN among the undetected sources. Nevertheless our results are consistent with a decreasing fraction of AGNs with decreasing flux density, as found in wider arcsec-scale sub-mJy samples (see e.g. Seymour et al. 2008).
Source classification
In this subsection, we present the updated classifications based on our 5 GHz sub-arcsec imaging and spectral index analysis of each source. Each classification is discussed with respect to previous indications from M05 and other multiwavelength observations.
J123606+620951: this source was unclassified by M05 and later classified as AGN by Richards et al. (2007), thanks to new X-ray band information. The integrated flux density measured directly from the 0.2 arcsec resolution 1.4 GHz images is higher than that reported in table A2 by M05 and derived from VLA only observations. It is possible that the source is variable. The core position at 5 GHz agrees within the errors with that reported by M05 at 1.4 GHz. The spectral index we obtain is consistent with the arcsec-scale previous determination between 1.4 and 8.5 GHz, and is not particularly informative (α ≃ 0.5 ± 0.2). However, the detection of a compact, possibly variable, component likely confirms the AGN origin of the radio emission.
J123617+621540: M05 observed a compact structure together with two-sided emission extended over about 1.3 arcsec, but the source was unclassified because the radio spectrum was poorly constrained (α ≥ 0.55). However, we clearly detect a bright core with flat spectral index (α ∼ 0.2 ± 0.2), strongly suggesting the presence of an AGN.
J123623+621642: the source was classified in M05 as an AGN-candidate. The presence of an AGN core was later confirmed by global VLBI observations at 1.4 GHz, that revealed a compact emission (Chi et al. 2013). At 5 GHz, we detect a compact component coincident with the peak of the 1.4 GHz radio source. The spectral index we derive is steeper (α ≃ 1.0 ± 0.2) than that found between 1.4 and 8.5 GHz, suggesting possible flux density variability between the 1996–97 1.4 and 8.5 GHz observations and our 2011 5 GHz observations. The compact structure and the possible variability both confirm the AGN origin of the radio emission.
J123624+621743: the source does not have a 1.4-8.5 GHz spectral index measurement. It has a faint X-ray counterpart but the lack of redshift information does not allow a derivation of the X-ray luminosity. We detect a weak, compact structure at 0.2 arcsec resolution with S/N of 3.3, that is not coincident with the peak of the 1.4 GHz image, but overlaps to its northern extended radio emission. To check the reliability of this detection, we used the Gaussian statistics to evaluate the probability to have a noise spike in the 5 GHz image above 3.3σ within the area covered by the 1.4 GHz VLA emission. This assumption is motivated by the fact that the rms noise distribution is very close to Gaussian. The probability for a spurious signal is of about 0.7 per cent; however, deeper observations are needed to confirm this detection.
Because of this offset, we have not calculated the spectral index. The source is associated with a relatively faint 1.4 GHz source (S(1.4 GHz) ∼ 70 μJy) and was not expected to be detected at 5 GHz (it is well below our 5 GHz detection threshold in Fig. 2). The presence of a significant positional offset between the two peaks at 1.4 and 5 GHz and the apparent flux inconsistency makes this detection uncertain. Deeper observations are therefore needed to confirm this detection.
J123640+622037: this is one of the sources not previously imaged at 1.4 GHz by M05, and therefore a classification was not previously provided. However, this object shows a radio-excess with respect to the radio/infrared correlation for radio-quiet AGNs and star-forming galaxies and was therefore classified as a radio-loud AGN (Donley et al. 2005). This source is neither detected by Chandra nor has a 1.4-8.5 GHz spectral index determination. At 5 GHz, we observe a bright compact core with a highly uncertain flux density due to the large primary beam correction. With the caveat of this uncertainty, we tentatively obtain a radio spectral index between 1.4 and 5 GHz of ∼0.4. The spectral index may be flatter, if we consider that some of the 5 GHz flux could be resolved out in our sub-arcsec 5 GHz images. This seems to confirm the AGN classification inferred by the high radio/infrared flux ratio.
J123642+621331: Waddington et al. (1999) argued that this source is most likely a distant (z = 4.424) dusty SB with a weak embedded AGN. At 1.4 GHz, the source shows both diffuse and compact structures (M05). The latter has been revealed at higher resolution by VLBI observations at 1.4 GHz (Garrett et al. 2001; Chi et al. 2013), confirming the presence of AGN emission. At 5 GHz, we detect a compact component coincident with the peak of the 1.4 GHz emission. Since at 1.4 GHz, the radio source is extended, we use only the flux of the compact emission at 1.4 GHz to derive a spectral index of α ≃ 0.9 ± 0.2. This value is consistent with the spectral index derived at arcsec-scale between 1.4 and 8.5 GHz. The steepness of the spectrum may confirm the composite nature of the source, and/or be explained by steepening effects introduced by the (large) k-correction of this high-redshift source.
J123644+621133: this is a Fanaroff–Riley type I (FR I) radio galaxy. 1.4 GHz sub-arcsec scale imaging shows a bright compact core and a short jet extending southwards (M05). 1.4 GHz VLBI observations (Garrett et al. 2001; Chi et al. 2013) detected the compact core component. A core+jet morphology is observed also in our 5 GHz image, confirming the AGN nature of the source. Considering the same area emitting at 5 and 1.4 GHz, we derive a rather flat spectrum with α ≃ 0.2 ± 0.1.
J123646+621404: an unresolved core has been detected by VLBI observations at 1.4 GHz (Garrett et al. 2001; Chi et al. 2013). Extended emission south-east of the nucleus was detected at 1.4 GHz by M05. At 5 GHz, we observe a compact core and again some extended emission south-east of the nucleus. The radio spectrum is inverted on both arcsec and sub-arcsec scales, confirming the AGN nature of the radio emission.
J123649+620438: this is one of the sources not previously imaged at 1.4 GHz by M05 which does not have a 1.4−8.5 GHz spectral index determination. The AGN/SB discriminators in this source are ambiguous. The galaxy is detected by Chandra with a 0.5–8 keV X-ray luminosity of LX ≃ 5.3 × 1033 W, and a rather soft-band-dominated emission, Γ = 1.6, that would be consistent with SB emission (Alexander et al. 2002). On the other hand, on the basis of an optical spectrum showing the Hα line, the galaxy was classified as an AGN (Hornschemeier et al. 2005). We detect a bright core at 5 GHz, that implies a flat or slightly inverted radio spectrum between 1.4 and 5 GHz (α ∼ −0.1), supporting the low-luminosity AGN scenario.
J123649+620737: This is one of the sources not previously imaged at 1.4 GHz by M05. The overall radio spectral index on arcsec-scale is steep (α ∼ 0.56 ± 0.07, see Table 2), and the 1.4 GHz arcsec-scale image shows extended emission. The radio source is associated with a hot-dust-dominated ultraluminous galaxy thought to host both an AGN and intense star-forming regions (Casey et al. 2009). Alternatively, the extended 1.4 GHz emission may be AGN-related extended emission and the 70 μm emission may be due to a dusty torus surrounding the AGN. The compact component detected at 5 GHz overlaps with the compact bright optical nucleus visible in the HST image (see fig. 3 in Casey et al. 2009). Using our 5 GHz flux density measurement, we find a possible steepening of the radio spectral index: α ∼ 0.5 between 1.4 and 5 GHz and α ∼ 0.8 between 5 and 8.5 GHz. If confirmed, this is consistent with optically thin synchrotron emission, associated with the central AGN.
J123650+620844: this source is classified as an SB by M05. It does not have a 1.4 − 8.5 GHz spectral index determination. A weak unresolved core is detected at 5 GHz with S/N of 3.5 The peak is slightly offset (0.18 ± 0.04 arcsec northwards) with respect to the 1.4 GHz peak position, but still overlaps to some extended emission detected at the lower frequency. As with J123624+621128, we have not calculated the spectral index. The presence of an offset may support the SB classification. As for J123624+621743, we estimated the probability to have a noise spike within the area corresponding to the 1.4 GHz VLA emission above 3.5σ. In this case, the probability for a spurious signal is of about 0.3 per cent. However, future observations with higher sensitivity and better uv coverage are needed to confirm this detection.
However, as for J123624+621743, the source was not expected to be detected at 5 GHz: this source has a flux S(1.4 GHz) ∼ 76 μJy and is located well below our 5 GHz detection threshold (see Fig. 2). The presence of a significant positional offset between the peaks at 1.4 and 5 GHz and the apparent flux inconsistency make this detection doubtful.
J123652+621444: this source is characterized by a flat arcsec-scale spectral index and was classified as an AGN by M05. The radio structure at 5 GHz shows a compact core coincident with the peak at 1.4 GHz. The derived spectral index is inverted (α ≃ −0.2 ± 0.2), confirming the AGN nature of the source.
J123659+621832: this is one of the sources not previously imaged at 1.4 GHz by M05. The radio source is identified with a dust-obscured galaxy, an objects showing an IR excess with respect to the optical emission (Georgantopoulos et al. 2011). The object is detected by Chandra and shows evidence for moderate absorption. The redshift is not constrained: a tentative estimate of a photometric redshift yields a value of 4.4 (Rovilos et al. 2010); in any case, the source must be at redshift ≳2 (Georgantopoulos et al. 2011). The arcsec-scale spectral index is flat. At 5 GHz, we detect a very bright compact source which implies an inverted radio spectrum between 1.4 and 5 GHz (α ∼ −0.4), and a very steep spectrum between 5 and 8.5 GHz (α ∼ 1.9). Such spectral behaviour might be due to variability. However, this kind of spectrum is also typical of Gigahertz-peaked radio sources (GPS, e.g. O’Dea 1998), a class of very compact radio galaxies, thought to be caught in the very early phases of their growth. Whatever the case, this points towards an AGN classification. Assuming a conservative redshift of z ∼ 2 and a conservative radio spectral index of α ∼ 0.26 (the one measured between 1.4 and 8.5 GHz at arcsec scale, see Table 2), we derive a rest-frame frequency k-corrected luminosity of 3 × 1025 WHz−1. Even under such conservative assumptions, this turns out to be the highest radio luminosity source in the sample. This potentially very high redshift source is of particular interest and worth further investigation.
J123714+620823: the core was detected at 1.4 GHz by global VLBI observations (Chi et al. 2013), confirming the AGN classification by M05. The arcsec-scale radio spectrum is flat, indicating that the overall radio emission is dominated by the AGN core. This is consistent with our own detection of a bright compact core, with a flat radio spectrum (α ≃ 0.04 ± 0.09) between 1.4 and 5 GHz.
J123721+620708: this is one of the sources not previously imaged at 1.4 GHz by M05 and does not have a 1.4-8.5 spectral index determination. Our 5 GHz detection on sub-arcsec scale implies an inverted radio spectrum of α ∼ −0.5 between 1.4 and 5 GHz. This may be due to variability, supporting an AGN classification. However, the significance of the 5 GHz detection is low (3σ) and deeper observations are necessary to confirm the AGN nature of this source.
J123721+621129: the core was detected at 1.4 GHz by global VLBI observations (Chi et al. 2013), confirming the AGN classification by M05. The arcsec-scale radio spectrum is inverted, indicating that the overall radio emission is dominated by the AGN core. At 5 GHz, we also detect an inverted-spectrum (α ≃ −0.4 ± 0.2) unresolved core, that overlaps the peak emission at 1.4 GHz.
J123725+621128: this is a wide-angle-tailed radio galaxy. 1.4 GHz sub-arcsec scale imaging shows a relatively extended double source. At 5 GHz, we detected the eastern hotspot/jet component of this source. The derived spectral index between 1.4 and 5 GHz is steep with α ≃ 0.90 and even steeper between 1.4 and 8.5 GHz (α = 1.36). The latter, being derived with a much lower resolution, likely contains significant contribution from the diffuse tail emission.
SUMMARY AND FUTURE PERSPECTIVE
The e-MERLIN commissioning observations presented here represent the first high-resolution wide-field imaging of the GOODS-N field at 5 GHz which although limited to five antennas of the e-MERLIN array the observations yield a resolution of 0.2 arcsec and a depth of about 15 μJy rms noise at the phase centre. These observations were used in conjunction with archival data to determine classifications of 15 of 17 sources detected within the field.
We detected 12 out of the 92 sources belonging to the complete sample derived from deeper 1.4 GHz MERLIN+VLA observations by M05. Comparing our 5 GHz images with the MERLIN+VLA images at 1.4 GHz at the same resolution, we derived for the first time sub-arcsec scale radio spectral indices for 10 of the 12 sources detected. The remaining two sources have displaced peaks at the two frequencies and the 5 GHz detection needs confirmation. In addition, we detected five more sources located outside the imaged field in M05. For such sources our 5 GHz e-MERLIN observations provide unique information on the radio source morphology at sub-arcsec scales.
Due to the still limited sensitivity of the present observations and the lack of short baselines, our observations are sensitive to relatively bright compact radio emission, most likely of AGN origin, and indeed many of the detected sources have independent indicators of AGN activity. The analysis of 5 GHz morphologies, together with the derived spectral indices allowed us to confirm previous AGN classifications, when available, and propose a classification as AGN/AGN-candidate for six of the seven sources previously unclassified. Of eight radio sources previously classified as AGN, six have 1.4–5 GHz spectra flatter than 0.6.
The fact that most of the detected sources are associated with AGN/AGN-candidates confirms previous results showing that AGNs dominate at the brighter end of sub-mJy radio samples (e.g. Mignano et al. 2008). The relative fraction of detections (and AGN) decreases going to lower flux densities (AGN sources go from 56 per cent at S1.4 GHz > 300 μJy, to ≳ 16 per cent at 100 < S1.4 GHz < 300 μJy), where the component associated with steep-spectrum star-forming galaxies is expected to become more prominent.
The detected sources span a very wide redshift range (0.1 < z < 4.4). Three of the highest redshift sources in the detected sample have independent observational evidence (based on infrared/sub-mm data) that the AGN might be embedded in dusty star-forming galaxies: they are J123642+621331 at z = 4.424 (Waddington et al. 1999), J123649+620737 at z = 2.315 (Smail et al. 2004; Casey et al. 2009) and J123659+621832 at z > 2 (tentative photometric redshift estimate of z ∼ 4.4, Rovilos et al. 2010). The latter two are among the sources for which sub-arcsec radio imaging was not previously available. Interestingly, the radio spectral behaviour of source J123659+621832 seems to mimic that of GPS radio sources. This potentially very high redshift source is of particular interest and is worth further investigation. This pilot study provides an indication of what will be achieved in the near future now that e-MERLIN is fully operational. In the following months, the GOODS-N region will be targeted at full resolution (about 50 mas at 5 GHz) by deep (sub-μJy sensitivity) e-MERLIN 1.4 and 5 GHz observations in the framework of the eMERGE Survey Legacy project (Muxlow et al. 2008). The 5 GHz observations will provide the resolution to directly distinguish between jet-like or more compact morphologies, indicating AGN activity, and less compact radio emission associated with star-forming galaxies. This analysis will benefit from 1.4 GHz information, allowing derivation of the source radio spectral index on sub-arcsec scales. Moreover, ongoing complementary deep VLA observations will recover the extended emission unsampled by the e-MERLIN data on angular scales larger than 0.5 arcsec. The combination of deep, high-resolution 1.4 and 5 GHz VLA and e-MERLIN observations will provide the opportunity to both spectrally and morphologically identify embedded low-luminosity AGNs, whilst at the same time map the distribution of star formation activity on scales from 50–2000 mas in the high-redshift galaxy population (1 < z < 5). These angular scales correspond to spatial resolutions spanning sub-kpc (∼300 pc) to tens of kpc at z > 1. This strategy will enable us to obtain a bolometrically complete census of star formation, the growth of galaxies and their SMBHs, an essential step towards a full understanding of galaxy formation and evolution.
This work is supported by INAF under grants PRIN-INAF 2009. e-MERLIN is a UK National Facility operated by the University of Manchester at Jodrell Bank Observatory on behalf of PPARC. DG is grateful to the Jodrell Bank Centre for Astrophysics and to the Jodrell Bank Observatory for hospitality. IRS acknowledges support from the Leverhulme Trust and an ERC Advanced Grant Dusrty Gal 321334.
