


Abstract
We present Very Large Telescope optical spectra of the black hole candidate X-ray binary MAXI J1836−194 at the onset of its 2011 outburst. Although the spectrum was taken at the beginning of the outburst and contains a significant contribution from the optically thin synchrotron emission that originates in the radio jet, we find that the accretion disc was already large and bright. Single-peaked, narrow Hα and He ii λ4686 lines imply the most face-on accretion disc observed in a black hole low-mass X-ray binary to date, with an inclination angle between 4° and 15°, assuming a black hole mass of between 5 and 12 M⊙, for distances of between 4 and 10 kpc. We use New Technology Telescope observations of the system in quiescence to place strong upper limits on the mass and radius of the donor star and the orbital period. The donor is a main-sequence star with a mass <0.65 M⊙ and a radius <0.59 R⊙ with an orbital period of <4.9 h. From those values and Roche lobe geometry constraints we find that the compact object must be >1.9 M⊙ if the system is located 4 kpc away and >7.0 M⊙ at 10 kpc.
INTRODUCTION
Low-mass X-ray binaries (LMXBs) spend the majority of their lifetimes in a state of quiescence with faint or undetectable X-ray emission and an optical spectrum dominated by the companion star. Occasionally, they show dramatic X-ray brightening (outburst), the consequence of an increased accretion rate on to the central compact object; this may be due to thermal-viscous disc instabilities (Lasota 2001) or an increased mass transfer rate from the donor star. An X-ray binary may go through a number of X-ray spectral states during an outburst (Fender, Belloni & Gallo 2004; Remillard & McClintock 2006; Belloni 2010), before returning to quiescence after a few weeks or months. In the simplest classification, the two main outburst states are a hard (non-thermal) state, where most of the accretion power is liberated in a hot corona or a relativistic outflow, and a soft (thermal) state, when most of the accretion power is efficiently radiated by an accretion disc.
The main sources of energy in the disc are viscous heating and the interception and thermalization of X-ray photons from regions close to the compact object (van Paradijs & McClintock 1995). The latter generally dominates at large disc radii, where most of the optical/ultraviolet (UV) emission comes from. In the viscous-dominated part of the disc, the emitted spectrum is a multicolour blackbody with an effective temperature, Teff, scaling with radius, R, as, Teff(R) ∼ R−3/4 (Shakura & Sunyaev 1973), while in the irradiation-dominated outer disc, Teff(R) ∼ R−1/2 (Frank, King & Raine 2002). A typical signature of external X-ray irradiation in the outer disc is the formation of a temperature-inversion layer in the disc chromosphere; as a result, He ii λ4686 and Hα are detected in emission, and higher lines of the Balmer series generally have narrow emission cores superposed on broader absorption formed in deeper layers (van Paradijs & McClintock 1995).
In the soft state, the optical/near-infrared (NIR) continuum comes almost entirely from the accretion disc, which becomes much brighter than the donor star (van Paradijs & McClintock 1995). In the hard state there may also be a significant NIR/optical/UV contribution from the optically thin synchrotron emission of the jet (Jain et al. 2001; Corbel & Fender 2002; Russell et al. 2006) as well as the donor star. While X-ray studies of an X-ray binary probe the accretion processes in the region immediately surrounding the compact object, optical/UV studies provide important constraints on the size and orbital period of the binary system, and on the mass of the donor star (see van Paradijs & McClintock 1995; Charles & Coe 2006 for a full review of optical and UV emission from X-ray binaries).
In this paper we present the results of an optical spectroscopic study of the X-ray transient MAXI J1836−194. This LMXB was discovered in the early stages of its outburst on 2011 August 30 (Negoro et al. 2011) by Monitor of All-sky X-ray Image (MAXI)/Gas Slit Camera (GSC) on the International Space Station (Matsuoka et al. 2009). The system was classified as a rapidly spinning (a = 0.88 ± 0.03; Reis et al. 2012) black hole (BH) candidate by virtue of its radio/X-ray properties (Miller-Jones et al. 2011; Russell et al. 2011; Strohmayer & Smith 2011). MAXI J1836−194 underwent a state transition from the hard state to the hard-intermediate state (HIMS) on 2011 September 10 (inferred from INTEGRAL, Swift and RXTE X-ray spectral and timing properties; Ferrigno et al. 2012). Instead of softening further to a full soft state (as is usually the case for other BH LMXBs), the outburst ‘failed’ (Brocksopp, Bandyopadhyay & Fender 2004) and the source transitioned back to the hard state on 2011 September 28 and faded towards quiescence (Ferrigno et al. 2012) over several months while the jet remained active (Russell et al. 2013). A re-brightening of the source was detected with Swift/Burst Alert Telescope (BAT) in 2012 March which lasted for several months (Krimm et al. 2012; Yang, Wijnands & Kennea 2012a) before a final return to quiescence by 2012 July (Yang et al. 2012b). From the X-ray spectral state evolution and inner-disc temperature, we argue (in our companion paper Russell et al. 2014, hereafter TDR14) that the luminosity in the early outburst phase was maximally a few per cent of the Eddington luminosity (typical for a HIMS to hard state transition; Maccarone 2003; Dunn et al. 2010). This suggests a plausible range of distances between 4 and 10 kpc for this source. Here, we expand on the preliminary results presented by Pakull & Motch (2011), based on their Very Large Telescope (VLT) observations. We show that the optical/UV signatures of an accretion disc were already present in the first few days after the discovery of the outburst although the optical/NIR band contained a significant contribution from the jet (Russell et al. 2013). We use these signatures to infer the inclination of the accretion disc. Swift Ultraviolet/Optical Telescope (UVOT) and European Southern Observatory New Technology Telescope (NTT) measurements of the optical luminosity in quiescence also allow us to constrain the size of the donor star and hence the orbital period of the binary system, as well as place a lower limit on the BH mass.
OBSERVATIONS AND REDUCTIONS
VLT
We observed MAXI J1836−194 with the Focal Reducer and Low Dispersion Spectrograph 2 (FORS2) on the VLT as a target-of-opportunity during the implementation of Programme 087.D-0870 (PI: M. Pakull). The target was observed on 2011 August 31, between Modified Julian Date (MJD) 55804.99–55805.05, and 2011 September 01 (MJD 55805.99–55806.02). We used the 1200B grism, covering the wavelength range from 3729 to 5200 Å (‘blue spectra’), and the 1200R grism, from 5869 to 7308 Å (‘red spectra’). The first night consisted of four 900 s observations for the blue spectra and four 450 s observations for the red spectra, while the second night consisted of two 900 s observations and two 450 s observations for the blue and red spectra respectively.
Calibration data (bias, flat-field and wavelength calibrators) were acquired following the standard calibration plan, implemented at the beginning or the end of the observing nights. We used the same slit width (1.0 arcsec) for all observations, giving a spectral resolution of 2.3 Å for the red spectra and 1.9 Å for the blue spectra on the first night and on the second night 1.6 Å for both the red and the blue spectra. The orientation of the slit was at a parallactic angle of 112| $_{.}^{\circ}$|5 the first night, and 141| $_{.}^{\circ}$|3 the second night. We took B-band sky and through-slit acquisition images each night before starting our spectroscopic observations to confirm that the target was well centred in the slit. The average full width at half-maximum (FWHM) seeing, estimated at 5000 Å, was 1.18 arcsec for the blue spectra and 1.51 arcsec for the red spectra on the first night and 0.81 and 0.68 arcsec, respectively, on the second night.
The data were reduced with ESOREX version 3.9.6 and the FORS2 kit recipes version 4.8.7 (Appenzeller et al. 1998) was used to correct raw frames for bias, apply flat-fields and to apply wavelength calibration. Arc images of He, Hg and Cd as well as Hg, Cd, Ar and Ne lamps provided wavelength solutions for the 1200B and 1200R grisms, respectively, yielding a wavelength accuracy of ∼0.05 Å for both the blue and red spectra (taken from the scatter of the fit to all the arc lines). One-dimensional spectra were extracted from the wavelength calibrated image using a MIDAS (Banse et al. 1988) procedure optimized for providing the best signal-to-noise ratio. We then used the IRAF (Tody 1986) tasks rvcorrect and dopcorrect to correct the spectra for the relative radial velocity of the Earth, shifting the wavelength scale to the heliocentric system. We also used standard IRAF tasks to combine and/or compare the spectra from the two nights. We then normalized the spectrum to the continuum with an eighth-order cubic spline, where we masked the Balmer lines (including their broad absorption components), the interstellar lines, He ii λ4686 and the Bowen blend. We then measured the main properties of the lines [central position, FWHM, equivalent width (EW)] with the IRAF task splot, where the errors are taken as the statistical error in the Gaussian fit and verified the results with the fitting package QDP (Tennant 1991).
Optical / UV Swift
Swift monitored MAXI J1836−194 every few days during its 2011 outburst (Ferrigno et al. 2012) and 2012 re-flaring. Observations in six optical/UV filters were made with the UVOT (Roming et al. 2005), of which we use the three optical filters (u, b and v) that provide the strictest constraints on the luminosity of the low-mass donor star. UVOT data were pre-processed at the Swift Data Centre (Breeveld et al. 2010) and reduced using standard Swift pipelines. The FTOOLS1 (Blackburn 1995) task, uvotimsum, was used to combine all images from the same filter. We used uvotsource and a suitable background region to extract an aperture photometry magnitude from a source region of 2.5 arcsec radius, centred on the UVOT position. Magnitudes are based on the UVOT photometric system, which differs from the Bessell system by V − v < 0.04 mag (for all colours) and B − b < 0.04 mag (for colours b − v < 1.5 mag; Poole et al. 2008). The differences between the UVOT and Bessell photometric magnitudes are small compared to the uncertainty in our photometry (see Section 3.1) and we therefore treat the UVOT v and b magnitudes as standard V and B magnitudes.
NTT
We obtained optical images during quiescence using the ESO Faint Object Spectrograph and Camera (EFOSC2; Buzzoni et al. 1984) mounted on the NTT at La Silla Observatory, Chile. On 2013 June 11 three observations were acquired in the Gunn i band with an exposure time of 300 s and a FWHM seeing of 1.0–1.1 arcsec. On 2013 June 12 and 13 single exposures of 300 s were obtained in the Gunn g-, r- and i-band filters with a seeing in the i band of 1.1 and 0.7 arcsec, respectively. Sky conditions were not photometric on all three nights, so additional 10, 30 and 60 s exposures of the field were obtained on June 12 and 13 to enable absolute flux calibration of the frames relative to data from the AAVSO Photometric All-Sky Survey (APASS) Data Release 7 (Henden et al. 2009). We used 2 × 2 on-chip binning during the observations, providing a scale of approximately 0.24 arcsec pixel−1. Frames were bias subtracted and then flat-fielded using dome flat-field observations. Given the faintness of the optical sources under study (see Fig. 1, bottom panel), we excluded data with image quality worse than 1.0 arcsec FWHM seeing.
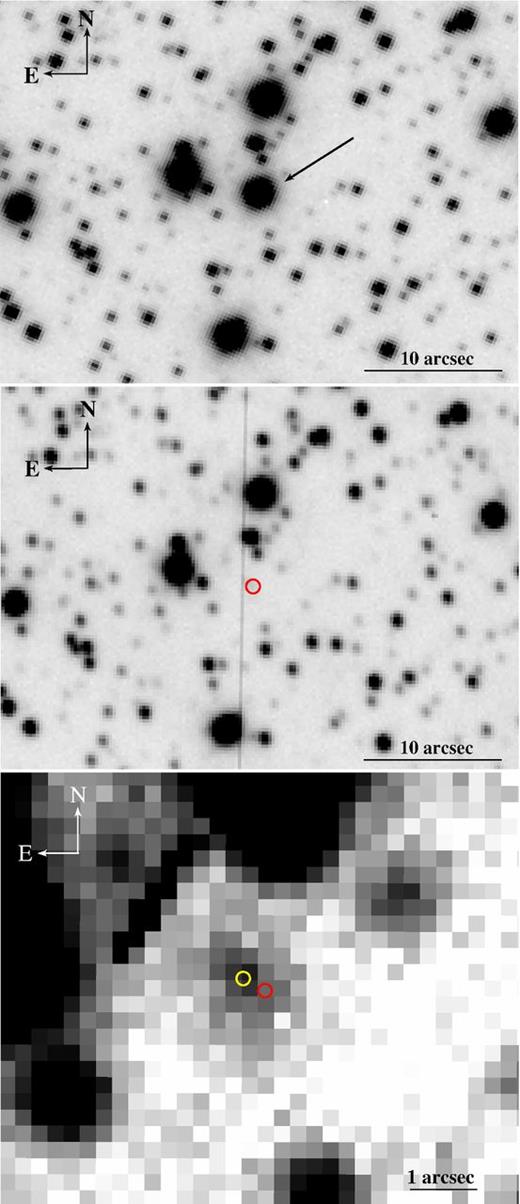
Top panel: B-band image of MAXIJ1836−194 (marked by an arrow) and surrounding field, taken with VLT/FORS2 on 2011 August 31 as an acquisition image before our spectral observations. Middle panel: i-band NTT image of the same field taken on 2013 June 13, after the system had returned to quiescence, where the red circle of radius 0.5 arcsec indicates the outburst position of the system. Bottom panel: another i-band NTT image of the field taken on 2013 June 11 of the system in quiescence. Here the yellow circle of radius 0.08 arcsec shows the unrelated field star at a J2000 position of RA = 18:35:43.474 and Dec. = −19:19:10.25, while the red circle of radius 0.08 arcsec shows the fitted location of the optical counterpart detected during outburst, at the J2000 position of RA = 18:35:43.451 and Dec. = −19:19:10.43. The optical counterpart of MAXI J1836−194 is no longer detected.
We applied point spread function (PSF) fitting on the images using daophot in IRAF to compute the instrumental magnitudes of the detected stars. Flux calibration of the field was performed using APASS objects in the MAXI J1836−194 field, achieving zero-point errors <0.1 mag. Differential photometry was performed to derive the fluxes of the sources of interest. The atmospheric calibration of the frames was defined by fitting for the reference point position, the scale and the position angle. As a first step, we obtained an astrometric solution on a 10 s i-band exposure. By comparing the positions of stars against entries from the fourth US Naval Observatory CCD Astrograph Catalogue (UCAC4; Zacharias et al. 2013), we found nine suitable UCAC4 sources well distributed on the image that were not saturated or blended and appear stellar. We obtained a solution with 0.0788 arcsec rms residuals. We then used the sources from this 10 s i-band image as secondary astrometric calibrators for our 300 s images. Taking into account uncertainties (including the systematic 0.05 arcsec uncertainty that is inherent to the UCAC4 catalogue) we estimated a positional accuracy of 0.13 arcsec. Additionally a publicly available 30 s i-band image of the field obtained during outburst with the Faulkes telescope on 2011 September 15 was calibrated using the same secondary reference tiers as for the 300 s NTT images. This frame was acquired with a 0.3 arcsec pixel−1 scale under a seeing of 1.2 arcsec FWHM and shows the optical counterpart at a J2000 position of RA = 18:35:43.451, Dec. = −19:19:10.43.
RESULTS
Optical photometry
During the two nights of VLT observations (2011 August 31, 2011 September 1), MAXI J1836−194 was detected as one of the brightest optical sources in the field (Fig. 1, top panel). Quasi-simultaneous Swift/UVOT observations on the same nights provide an accurate measurement of its optical/UV brightness and colours: we obtain u = 16.43 ± 0.08 mag, b = 17.12 ± 0.08 mag, v = 16.37 ± 0.08 mag on the first night, and u = 16.39 ± 0.07 mag, b = 16.97 ± 0.07 mag, v = 16.40 ± 0.07 mag on the second night (Fig. 2).
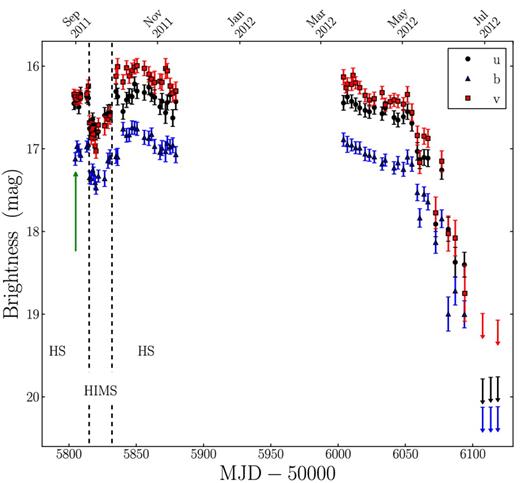
Swift/UVOT light curve, showing the 2011 outburst and decline towards quiescence. The date of the first VLT observation is marked by the green arrow. The state transitions are marked by the vertical dashed lines, HS denotes the hard state and HIMS is the hard-intermediate state (the states are defined by X-ray spectral and timing properties presented by Ferrigno et al. 2012).
Instead of brightening as the source moved into the HIMS, the optical/UV luminosity decreased; on 2011 September 17, we measured u = 16.79 ± 0.08 mag, b = 17.33 ± 0.07 mag, v = 17.18 ± 0.07 mag from Swift/UVOT (Fig. 2). The optical/UV dimming is discussed further in Section 4. We used the Swift/X-Ray Telescope (XRT) data where the soft disc-like component to the XRT spectra was largest (mid-September; TDR14) to infer the most important disc parameters; in particular, in the context of this work, the outer disc radius and X-ray reprocessing fraction.
MAXI J1836−194 underwent a re-brightening during 2012 March, followed by a decline to quiescence (Krimm et al.
2012; Yang et al. 2012a). In the last three Swift/UVOT observations of 2012 June 29, July 5 and July 10, the optical counterpart was not visible, nor was it found in the stacked image from the three data sets. We take the detection limit for that combined image as the best-available 3σ upper limit to the quiescent optical flux in the u, b and v bands: u > 20.5 mag, b > 20.8 mag, v > 19.5 mag (Table 1).
Upper limits on the magnitude and magnitude minus the distance modulus (dm) of MAXI J1836−194 during quiescence; u, b and v upper limits are determined from the summed Swift/UVOT images of 2012 June 29, July 05 and July 10, while the g, r and i upper limits are from the 2013 June 12 and 13 NTT images of the system in quiescence. The distance ranges presented cover the extent of plausible distances to the source (derived from the temperature and flux of the disc; TDR14) and magnitudes presented are not corrected for extinction.
| Filter | Magnitude | Mag − dm | |||
|---|---|---|---|---|---|
| 4 kpc | 6 kpc | 8 kpc | 10 kpc | ||
| u | >20.5 | >7.5 | >6.6 | >6.0 | >5.5 |
| b | >20.8 | >7.8 | >6.9 | >6.3 | >5.8 |
| v | >19.5 | >6.5 | >5.6 | >5.0 | >4.5 |
| g | >24.0 | >11.0 | >10.1 | >9.5 | >9.0 |
| r | >23.7 | >10.7 | >9.8 | >9.2 | >8.7 |
| i | >23.5 | >10.5 | >9.6 | >9.0 | >8.5 |
Our more recent NTT images of the system in quiescence (Fig. 1, bottom panel) show a number of blended sources near the location of MAXI J1836−194. The brightest of these sources is a point-like object at a J2000 position of RA = 18:35:43.474, Dec. = −19:19:10.25. PSF photometry yields i = 21.4 ± 0.1 mag (2013 June 11) and g = 23.7 ± 0.2 mag, r = 22.4 ± 0.1 mag and i = 21.6 ± 0.2 mag (2013 June 13). This source is 0.37 arcsec away (0.32 arcsec in RA and 0.18 arcsec in Dec.) from the position derived for the optical counterpart to MAXI J1836−194 during outburst (RA = 18:35:43.451 and Dec. = −19:19:10.43, J2000; Section 2.3). Given that the images were astrometrically calibrated using the same reference stars, the uncertainty in the separation between the two objects is dominated by the uncertainty in the determination of the target profile centre. Using different algorithms implemented in IRAF to calculate these positions (centroid, Gaussian and PSF fitting), we derive positional uncertainties of 0.06 and 0.08 arcsec in RA and Dec., respectively, for the source found in the NTT images. The positional uncertainties are negligible for the bright optical counterpart detected in outburst. Therefore, the separation between the two objects is significant (5σ in RA), showing that the object in the NTT images is a field star unrelated with the transient. South-west from this source there is evidence for unresolved emission overlapping the expected position for the transient. We derive 3σ upper limits of g > 24.0 mag, r > 23.7 mag and i > 23.5 mag at this position for the best quality images (Table 1).
Optical spectroscopy
Our early outburst VLT spectra (Fig. 3) show clear signs of an optically thick, X-ray irradiated accretion disc; rotationally broadened He ii λ4686, Hα, Hβ and Hγ emission in a broad absorption trough, the Bowen region at λ ∼ 4630–4640 Å, as well as other rotationally broadened H i absorption lines from the Balmer series (identifiable up to H10) and He i absorption lines, consistent with findings presented by Pakull & Motch (2011).
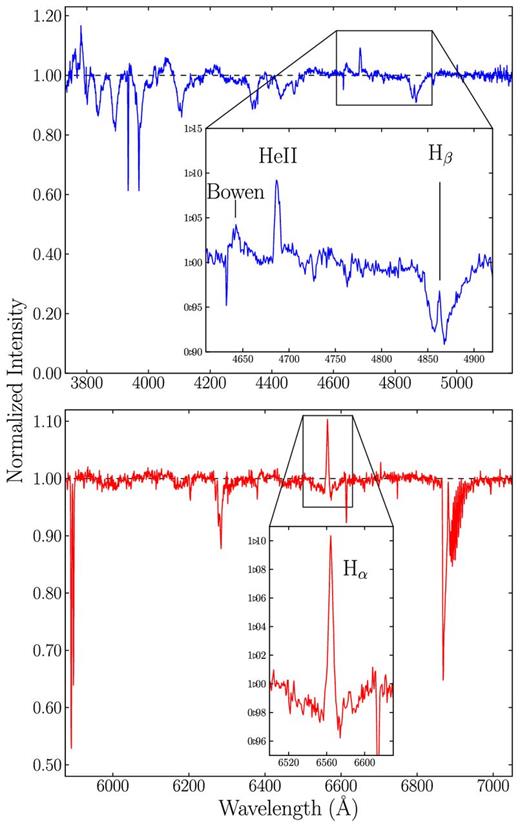
Top panel: averaged blue spectrum of MAXI J1836−194 obtained 2011 August 31 and 2011 September 01, with a zoomed portion showing the He ii λ4686, Hβ and Bowen region. Bottom panel: averaged red spectrum from August 31 and September 01, with a zoom of the Hα peak. Continuum intensities have been normalized at one.
We fitted Gaussian profiles to a selection of the de-blended Balmer emission and absorption components (Table 2). We found EWs of the emission components, measured from the two-night combined spectrum, to be Hα = −0.83 ± 0.02 Å, Hβ emission core = −0.25 ± 0.03 Å and Hγ emission core = −0.15 ± 0.03 Å (where negative EWs represent emission and positive EWs represent absorption). We find EWs for the Hβ and Hγ absorption components of 2.54 ± 0.07 and 2.5 ± 0.1 Å, respectively. For the broad and shallow Hα absorption trough, the FWHM is not well constrained due to the strong emission line, but we estimate the FWHM to be ≈50 Å and the full width at zero intensity (FWZI) to be ≈90 Å. The de-reddened fluxes of the Balmer series and He ii λ4686 line are presented in Table 2 and will be discussed further in Section 4. We determined the reddening, |$E(B-V) = 0.53^{+0.03}_{-0.02}$| mag, by fitting an irradiated disc model to the broad-band optical/UV/X-ray spectrum with XSPEC (TDR14). Diffuse interstellar bands provided an alternative estimate of the extinction. In particular, the λ4430 interstellar band is clearly visible with a central absorption of 6.5 per cent corresponding to E(B − V) = |$0.6^{+0.2}_{-0.1}$| mag (Krelowski et al. 1987). We also get similar results from the λ6284 interstellar band using the calibration from Jenniskens & Desert (1994). Results from Marshall et al. (2006) indicate that there is an absorption layer of E(B − V) ≈ 0.5 mag located within 2 kpc in the direction of the source, providing a lower limit to the distance to the source.
The intrinsic full width at half-maximum (FWHM), equivalent width (EW) and the de-reddened flux within the line for some notable lines at the onset of the 2011 outburst. Negative values represent emission and positive values represent absorption. Both the emission core and broad absorption of Hβ were recorded.
| Line | FWHM | EW | Emitted flux |
|---|---|---|---|
| ×10−15 | |||
| (Å) | (Å) | (erg s−1 cm−2) | |
| Hα (emis.) | 6.0 ± 0.2 | −0.83 ± 0.02 | 3.15 ± 0.09 |
| Hα (abs.) | ≈50 | 1.20 ± 0.05 | – |
| Hβ (emis.) | 4.0 ± 0.4 | −0.25 ± 0.03 | 1.5 ± 0.2 |
| Hβ (abs.) | 35.1 ± 0.9 | 2.54 ± 0.07 | – |
| Hγ (emis.) | 4.2 ± 0.7 | −0.15 ± 0.03 | 1.0 ± 0.2 |
| Hγ (abs.) | 23 ± 2 | 2.5 ± 0.1 | – |
| He II λ4686 | 5.5 ± 0.3 | −0.52 ± 0.03 | 3.2 ± 0.2 |
| Bowen blend | – | −0.58 ± 0.06 | 3.9 ± 0.4 |
We determine the heliocentric velocity of the disc on both nights by fitting Gaussian profiles to a selection of suitable emission and absorption lines (Table 3) and measuring their average velocity shifts. The average recessional velocity is 68 ± 20 km s−1 for the first night of VLT observations, 55 ± 17 km s−1 for the second night and 61 ± 15 km s−1 for the combined two-night spectrum. We also obtain consistent velocity shifts when we use only the sample of emission lines (59 ± 9 km s−1) or the sample of absorption lines (60 ± 16 km s−1); we thus conclude that both emission and absorption lines in Table 3 come from the disc surface. In principle the recessional velocity may be different on each night due to the orbital phase of the system because the disc follows the orbital motion of the BH. However, from the derived system parameters (presented in Section 4) we verify that the amplitude of the projected radial velocity of the BH around the centre of mass is ∼9 km s−1 for a 5 M⊙ BH and ∼5 km s−1 for a 12 M⊙ BH, so this effect is well within the uncertainties from our averaged velocities.
Line positions and calculated systemic velocity for each individual night and for the two-night combined spectrum. The 1σ uncertainties in the stronger lines (Hα, Hβ and He ii λ4686) are ±0.2 Å, and ±0.3 Å for all other lines.
| Line | Night 1 | Night 2 | Combined |
|---|---|---|---|
| (Å) | (Å) | (Å) | (Å) |
| Hα 6562.8 | 6564.1 | 6563.7 | 6563.8 |
| Hβ 4861.3 | 4862.4 | 4861.9 | 4862.3 |
| Hγ 4340.5 | 4341.2 | 4341.3 | 4341.3 |
| Hδ 4101.7 | 4102.0 | 4102.1 | 4102.1 |
| H8 3889.1 | 3890.3 | 3889.7 | 3889.7 |
| H9 3835.4 | 3836.4 | 3836.2 | 3836.3 |
| H10 3799 | 3800.1 | 3799.7 | 3800.0 |
| He i 4026.2 | 4027.0 | 4027.3 | 4027.0 |
| He i 4143.8 | 4145.2 | 4145.1 | 4145.0 |
| He i 4387.9 | 4389.0 | 4388.9 | 4389.0 |
| He i 4471.5 | 4472.5 | 4472.0 | 4472.5 |
| Mg ii 4481.3 | 4482.1 | 4482.2 | 4482.1 |
| He ii 4686 | 4686.9 | 4686.7 | 4686.8 |
| Velocity (km s−1) | 68 ± 20 | 55 ± 17 | 61 ± 15 |
The Hα and He ii λ4686 lines are single peaked and narrower than typically observed in Galactic LMXBs. Therefore, instead of using the peak-to-peak separation, we use their FWHM to provide an approximation of twice the projected Keplerian velocity of the disc annulus of the emitting region. For Hα we measure a Gaussian FWHM of 6.40 ± 0.20 Å for night 1 and 5.75 ± 0.20 Å for night 2. The He ii λ4686 line profile produces FWHM = 5.57 ± 0.30 Å on night 1 and FWHM = 5.43 ± 0.30 Å on night 2. We deconvolved the instrumental resolution for both the red and the blue spectra on the second night (seeing limited). Averaging the intrinsic FWHMs from both nights, we obtain a velocity of 260 ± 6 km s−1 for Hα and 333 ± 14 km s−1 for He ii λ4686. We assume that this corresponds to approximately twice the Keplerian velocity of the disc rings that give the highest contribution to those emission lines, and we use these results to determine the disc inclination (Section 4.2).
ANALYSIS AND DISCUSSION
During the first few days after the discovery of the outburst, MAXI J1836−194 was in the hard spectral state with a significant contribution to the optical/UV emission from the optically thin synchrotron emission from the radio jet (a spectral index of α = −0.6 ± 0.1, where flux Sν∝να; Russell et al. 2013). In addition to this power-law synchrotron component, the optical emission on 2011 August 31 (night 1) and September 01 (night 2) contained a multicolour thermal component from the irradiated accretion disc. From multiwavelength spectral fitting, we estimate that ≈55 per cent of the B-band flux, and ≈70 per cent of the V-band flux came from the synchrotron component on those dates (TDR14). Two weeks after the VLT observations, the disc became the dominant source of optical emission, not because of a dramatic increase in its flux, but because of the temporary disappearance of the synchrotron component due to jet quenching (Russell et al. 2013), resulting in a reduction in the total optical/UV emission (Fig. 2).
Emission lines
The emission lines or cores of the Balmer series are seen clearly at Hα, Hβ and Hγ, with Hβ and Hγ being dominated by pressure-broadened absorption troughs (Mayo, Wickramasinghe & Whelan 1980). In particular, the FWHM of the Hα and Hβ absorption troughs are ≈50 and ≈35 Å, respectively, while the FWZI of the Hα and Hβ absorption troughs are ≈90 and ≈75 Å, similar to other Galactic LMXBs (e.g. GRO 1655−40 and XTE J1118+480; Soria, Wu & Hunstead 2000; Torres et al. 2002).
While the spectra look remarkably similar, the EW of the Hα emission line (−0.83 ± 0.02 Å) is much smaller (in absolute value) than what is usually found in Galactic BH transients early in an outburst, when typical magnitudes of the EWs are ∼3–6 Å (Fender et al. 2009). The reason for this significantly lower EW is the optically thin synchrotron component from the jet dominating the red part of the optical spectrum, which we shall argue in Section 4.2 is due to beaming because of the face-on nature of the system. Accounting for the jet component (model presented in TDR14), we find that the EW of Hα with respect to the disc continuum alone is in fact −4.2 ± 0.1 Å, similar to other Galactic XRBs (Fender et al. 2009). Similarly, the EW of He ii λ4686 with respect to the total blue continuum is −0.52 ± 0.03 Å, but with respect to the disc continuum alone is −1.6 ± 0.1 Å. The comparable EWs with respect to the disc component imply that the conditions in the disc in terms of optical depth and irradiation are similar to other LMXBs in the early stages of outburst.
From the de-reddened fluxes we find a Balmer decrement of fHα/fHβ = 2.1 ± 0.3, lower than the canonical value of ≈2.87 valid for Case-B recombination of optically thin gas at T ≈ 104 K (Osterbrock & Ferland 2006); also, the ratio of fHγ/fHβ = 0.71 ± 0.2 is slightly higher than the expected Case-B recombination value of ≈0.466 (Osterbrock & Ferland 2006). The most likely explanation of such a discrepancy is that the lines are emitted in a layer with high electron density and optical depth, τHα > 1, where the collisional excitation and de-excitation become dominant and case-B recombination is no longer valid. From Drake & Ulrich (1980), the measured Balmer ratios from our spectra suggest an electron density of ∼1012–1014 cm−3, consistent with their expectations for the upper layers of an optically thick accretion disc.
For He ii λ4686 we assume instead that collisional processes are not significant, at least in the outer disc. In this case the de-reddened flux of this line, |$f_{\rm {He\,{\scriptscriptstyle {II}}}} = (3.2\pm 0.2) \times 10^{-15}$| erg cm−2 s−1 =(7.5 ± 0.4) × 10−4 λ4686 photons cm−2 s−1 can be used to estimate the fraction of X-ray luminosity intercepted by the disc. Following Pakull & Angebault (1986), for X-ray photoionized gas, the He ii λ4686 photon flux is proportional to the illuminating flux of ionizing photons above 54 eV; for an optically thick region, the scaling factor is simply the ratio between the He+ recombination coefficient (summed over all levels above the ground state) and the effective recombination coefficient for the n = 4 → 3 transition. This ratio varies between ≈4.2 and ≈6.3 for temperatures T ≈ 10 000–40 000 K (Osterbrock & Ferland 2006), and implies that approximately one He ii λ4686 photon is emitted for every ∼4–6 UV/X-ray photons that are intercepted by the disc. The unabsorbed, isotropic photon flux above 54 eV measured from Swift XRT data taken on August 31 is ≈3.9 photons cm−2 s−1 (TDR14), meaning that we should observe approximately (0.65–0.98) fout λ4686 photons cm−2 s−1, where fout is the disc interception and reprocessing fraction. As ≈7.5 × 10⁻⁴ λ4686 photons cm−2 s−1 are observed this means that the outer accretion disc must be intercepting ∼10−3 of the UV/X-ray photons that are emitted from closer to the BH; this reprocessing fraction is in good agreement with theoretical models (Vrtilek et al. 1990; de Jong, van Paradijs & Augusteijn 1996; Hynes et al. 2002; Gierliński, Done & Page 2009), demonstrating that, even at this early stage of the outburst, the accretion disc is already relatively large, bright and optically thick.
Inclination angle of the disc
The profiles and widths of the Hα and He ii λ4686 emission lines are good indicators of the Keplerian rotational velocity of the disc annuli responsible for their emission. Instead of the usual flat-topped or double-peaked profile (Paczyński 1977; Smak 1981), we observe single-peaked and relatively narrow Hα and He ii λ4686 profiles (Fig. 3), which are indicative of a face-on accretion disc (Smak 1981). Using the FWHM provides a good approximation of twice the Keplerian velocity of the disc annulus that contributes most to the line emission.2
First, we determined whether the peak of the Hα emission originates in the outermost disc annulus, that is, whether RHα ≈ Rout. To determine Rout, we modelled the broad-band optical/UV/X-ray spectrum (TDR14) with the irradiated disc model diskir (Gierliński, Done & Page 2008) within XSPEC (Arnaud 1996); the main free parameters of this model are the colour temperature of the inner disc Tin, the disc blackbody normalization constant K, the fraction of X-ray flux intercepted and reprocessed in the outer disc fout and Rout expressed as a function of the inner disc (fitting) radius rin. The X-ray data provide strong constraints on Tin and K (and therefore also rin; Soria 2007), while the optical/UV data constrain Rout/rin and the irradiation fraction. In particular, we find typical irradiation fractions f ≈ 10−3 (in agreement with what we estimated from the X-ray/λ4686 flux ratio, Section 4.1), and typical values of y ≡ log (Rout/rin) ≈ 4.1 (TDR14). Since rin ≈ D10 kpc [K/cos (i)]1/2, we obtain Rout = 10yrin ≈ 1.4 × 10¹¹cos (i)−1/2D10 kpc cm. The Rayleigh–Jeans tail of the irradiated outer disc spectrum suggests that T(Rout) ≈ 15 000 K. This characteristic temperature confirms that the outermost disc annulus must be a strong Balmer emitter (Osterbrock & Ferland 2006). Therefore, we are justified in assuming that the projected rotational velocity of the outer disc |$v_{R_{\rm out}} \approx v_{\rm H\alpha } \approx 130 \pm 4$| km s−1.
Outer disc radii and inclination angles for a range of plausible BH masses (Kreidberg et al. 2012) and source distances.
| BH mass | Distance to source | Rout | Inclination angle |
|---|---|---|---|
| (kpc) | (×1010) cm | (i°) | |
| 4 | |$5.3^{+1.3}_{-1.6}$| | |$7.0^{+2.2}_{-1.0}$| | |
| 6 | |$7.9^{+2.0}_{-2.3}$| | |$8.5^{+2.7}_{-1.2}$| | |
| 5 M⊙ | |||
| 8 | |$10.6^{+2.6}_{-3.1}$| | |$9.8^{+3.1}_{-1.4}$| | |
| 10 | |$13.2^{+3.3}_{-3.9}$| | |$11.0^{+3.5}_{-1.5}$| | |
| 4 | |$5.3^{+1.3}_{-1.6}$| | |$5.5^{+1.8}_{-0.8}$| | |
| 6 | |$7.9^{+2.0}_{-2.3}$| | |$6.7^{+2.1}_{-1.0}$| | |
| 8 M⊙ | |||
| 8 | |$10.5^{+2.6}_{-3.1}$| | |$7.8^{+2.5}_{-1.1}$| | |
| 10 | |$13.2^{+3.3}_{-3.9}$| | |$8.7^{+2.8}_{-1.2}$| | |
| 4 | |$5.3^{+1.3}_{-1.6}$| | |$4.5^{+1.4}_{-0.6}$| | |
| 6 | |$7.9^{+2.0}_{-2.3}$| | |$5.5^{+1.7}_{-0.8}$| | |
| 12 M⊙ | |||
| 8 | |$10.5^{+2.6}_{-3.1}$| | |$6.3^{+2.0}_{-0.9}$| | |
| 10 | |$13.2^{+3.3}_{-3.9}$| | |$7.1^{+2.3}_{-1.0}$| |
The inclination angle we determined is much lower than the ∼20°–∼80° range seen in other LMXBs (Narayan & McClintock 2005; Muñoz-Darias et al. 2013) and could be the reason why this system is so suitable for jet and jet break studies (Russell et al. 2013), as Doppler boosting would make the jet appear much brighter and may shift the jet break to higher frequencies than in similar systems with a less favourable orientation. The lack of phase-dependent modulation in the Swift/UVOT light curve (Fig. 2) supports our conclusion of a face-on accretion disc and the flat-topped shape of the hardness–intensity diagram (Ferrigno et al. 2012, fig. 5) is also consistent with other relatively low-inclination LMXBs (Muñoz-Darias et al. 2013), even though the system never settled into a full soft state. We also note that the widths of the Balmer absorption troughs are similar between this face-on system and other higher inclination systems suggesting that the broadening is mostly due to pressure effects, rather than Keplerian rotation.
Donor star size and orbital period
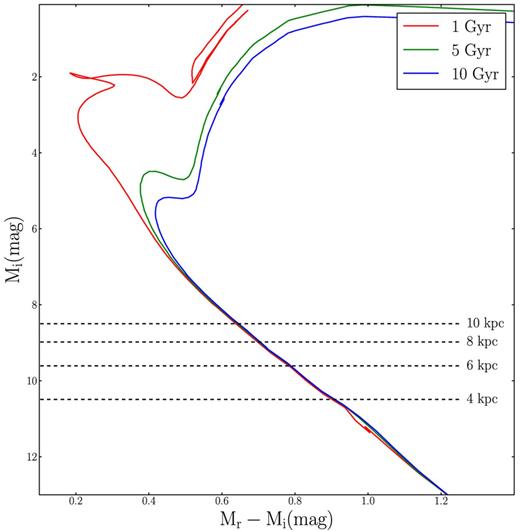
Padova stellar evolutionary models for stellar populations of age 1, 5 and 10 Gyr (Bressan et al. 2012), corrected for reddening (E(B − V) = 0.53 mag) to compare with the magnitudes presented in Table 1. Coloured lines represent the stellar population of given ages and black dashed lines are the upper limits on the magnitude from quiescent photometric observations.
Largest possible mass, size and period estimates derived from quiescent Swift/UVOT and NTT observations and Padova stellar evolutionary models of different population ages. Presented are the maximum limits for all population ages.
| Distance | 4 kpc | 6 kpc | 8 kpc | 10 kpc |
|---|---|---|---|---|
| M2 (M⊙) | <0.33 | <0.45 | <0.55 | <0.65 |
| R2 (R⊙) | <0.31 | <0.41 | <0.50 | <0.59 |
| Period (h) | <2.7 | <3.4 | <4.1 | <4.9 |
| Distance | 4 kpc | 6 kpc | 8 kpc | 10 kpc |
|---|---|---|---|---|
| M2 (M⊙) | <0.33 | <0.45 | <0.55 | <0.65 |
| R2 (R⊙) | <0.31 | <0.41 | <0.50 | <0.59 |
| Period (h) | <2.7 | <3.4 | <4.1 | <4.9 |
Black hole mass
CONCLUSIONS
We have used optical spectroscopic and photometric observations to determine or constrain the binary system parameters of MAXI J1836−194. From the optical luminosity of the irradiated disc, combined with the relative narrowness of the disc emission-line profiles, we estimate that the inclination angle of the disc is between ≈4° and ≈15° for a range of distances suggested by the X-ray luminosity. This is the lowest inclination angle found in any transient BH LMXB, and is likely to produce noticeable beaming effects in our measurements of the jet emission properties, making this system ideal for studies of the spectral break evolution during outburst (Russell et al. 2013; TDR14).
The donor star was not detected in our observations of the source after its return to quiescence; however, we can still place strong upper limits on its luminosity and determine that it must be a main sequence K or M star. For such stars, an upper limit to the luminosity also gives upper limits to the mass and radius (M2 < 0.65 M⊙ and R2 < 0.59 R⊙), and the binary period (P < 4.7 h), because the star must fill its Roche lobe for mass transfer to occur. Combining our photometric constraints of donor star mass and radius with the outer radius of the accretion disc in outburst from X-ray analysis (Rout ≈ 1 × 1011 cm at 8 kpc), and therefore also the average radius of the BH Roche lobe, we obtain lower limits to the primary mass. This confirms that, except possibly at the lowest distance range, the primary is a typical stellar mass BH with similar mass to other Galactic LMXB transients.
We would like to thank the anonymous referee for comments that have improved this paper. We also thank Gary Da Costa and Daniel Bayliss for their contribution and help with optical monitoring. This research was supported under the Australian Research Council's Discovery Projects funding scheme (project number DP 120102393). This research has made use of the APASS data base, located at the AAVSO web site. Funding for APASS has been provided by the Robert Martin Ayers Sciences Fund.
Based on observations collected at the European Southern Observatory, Chile, under ESO Programme IDs 087.D-0914 and 089.D-0970.
In fact, the FWHM is a slight overestimate of the projected rotational velocity (Smak 1981), but the difference is ≲ 10 per cent for the moderately flat radial temperature profile expected in the outer region of an irradiated disc. In the absence of more direct measurements, the FWHM of the disc lines is a robust and conservative approximation to the projected rotational velocity of the emitting gas; if anything, the true projected rotational velocity may be slightly lower, which would further reduce the inclination angle estimated here.
