


Abstract
The supernovae (SNe) of Type Ibc are rare and the detailed characteristics of these explosions have been studied only for a few events. Unlike Type II SNe, the progenitors of Type Ibc have never been detected in pre-explosion images. So, to understand the nature of their progenitors and the characteristics of the explosions, investigation of proximate events is necessary. Here we present the results of multiwavelength observations of Type Ib SN 2007uy in the nearby (∼29.5 Mpc) galaxy NGC 2770. Analysis of the photometric observations revealed this explosion as an energetic event with peak absolute R-band magnitude −18.5 ± 0.16, which is about 1 mag brighter than the mean value (−17.6 ± 0.6) derived for well observed Type Ibc events. The SN is highly extinguished, E(B − V) = 0.63 ± 0.15 mag, mainly due to foreground material present in the host galaxy. From optical light curve modelling we determine that about 0.3 M⊙ radioactive 56Ni is produced and roughly 4.4 M⊙ material is ejected during this explosion with liberated energy ∼15 × 1051 erg, indicating the event to be an energetic one. Through optical spectroscopy, we have noticed a clear aspheric evolution of several line-forming regions, but no dependency of asymmetry is seen on the distribution of 56Ni inside the ejecta. The SN shock interaction with the circumstellar material is clearly noticeable in radio follow-up, presenting a synchrotron self-absorption dominated light curve with a contribution of free–free absorption during the early phases. Assuming a Wolf–Rayet (WR) star, with wind velocity ≳ 103 km s− 1, as a progenitor, we derive a lower limit to the mass-loss rate inferred from the radio data as Ṁ ≳ 2.4 × 10⁻⁵ M⊙ yr−1, which is consistent with the results obtained for other Type Ibc SNe bright at radio frequencies.
INTRODUCTION
Core-collapse supernovae (CCSNe) mark the end stage of the evolution of massive stars having initial masses greater than 8 M⊙ (Heger et al. 2003; Burrows 2013). Stars, more massive than 10 M⊙ produce a Fe-core, and then expel their outer layers in a catastrophic explosion (e.g. Pumo et al. 2009). Type Ib supernovae (SNe) are a class of CCSNe which are spectroscopically defined by the absence of hydrogen (H) and presence of helium (He) in their early phase optical spectra. It is generally accepted that Type Ib SNe along with Type Ic (absence of H and He) are formed from evolved high-mass progenitors like Wolf–Rayet (WR) stars which have liberated their outer shells through pre-SN winds. The outer shells of H and He may also be stripped through mass transfer due to Roche lobe overflow in a binary system. Type Ibc SNe are commonly referred to as ‘stripped-envelope supernovae’ (Clocchiatti & Wheeler 1997). The progenitors of Type Ibc SNe have not been observed directly in pre-explosion high-resolution images. There are only a few cases, like SNe 2000ds, 2000ew, 2001B and 2004gt where upper limits on the flux of the Type Ibc progenitors have been reported (Maund & Smartt 2005; Maund, Smartt & Schweizer 2005; Eldridge et al. 2013). After analysing the evolutionary models of massive He stars and comparing the results with Galactic WR stars, it has been found that during pre-SN stage, progenitors of Type Ibc SNe have surface properties that resemble those of hot Galactic WR stars of WO subtype, which are visually faint, MV ≈ −1.5 to − 2.5 mag, despite of a high bolometric luminosity, L/L⊙ = 5.6–5.7 (Yoon et al. 2012). Detection of Type Ic progenitors is even more challenging than that of Type Ib. Monitoring of this class of SNe is crucial, not only to investigate the post-explosion phenomenon but also to understand the pre-explosion properties of the progenitors.
With a volumetric sample of nearby CCSNe discovered by the Lick Observatory Supernova Search (LOSS) programme, Smith et al. (2011) found that only about 7 per cent of total nearby CCSNe are of Type Ib. Furthermore they argued that most of the Type Ib are formed through mass transfer in a binary system rather than through the progenitor's wind and that the true progenitors of SNe Ib must extend to a much lower range of initial masses than classical WR stars.
Apart from the issues related to progenitors and the pre-explosion properties, there are many unresolved issues concerning the post-explosion properties. One of them is the explosion geometry. Spectropolarimetry has revealed CCSNe to be more aspheric in their inner layers with a preferred direction of explosion in comparison with thermonuclear events, which instead show asphericity in their outer shells (Wang & Wheeler 2008). Among CCSNe, Type IIP events show a moderate non-zero polarization in the plateau phase, whereas Type Ibc SNe are aspheric explosions with substantially higher intrinsic polarization from the beginning (Wang et al. 2001; Maund et al. 2007). The asphericity is explained as being due to clumpy structure or jet-like propagation of the ionizing radioactive Ni and Co source, concentrated at the inner portion of the spherically symmetric ejecta (Chugai 1992; Höflich, Khokhlov & Wang 2001; Maund et al. 2007). In the light of mounting evidence of the asphericity of Type Ibc events, the double horned nature of the [O i] λλ6300, 6364 profile was explained as a jet/torus-like structure (Mazzali et al. 2005; Maeda et al. 2008; Modjaz et al. 2008). Though, alternatively, it can be explained as a combined effect of two [O i] distributions – (i) a central, symmetric distribution of [O i] -rich ejecta, (ii) a clumpy or shell of [O i] -rich material travelling in the front facing hemisphere (although this model also has some drawbacks; see Taubenberger et al. 2009; Milisavljevic et al. 2010). Clearly, individual case studies are important to understand the preferred mechanism behind the ambiguous behaviour of [O i] lines.
SN 2007uy, a Type Ib event, was first discovered by Yoji Hirose on 2007 December 31.7 ut at an unfiltered magnitude 17.2 (Nakano et al. 2008) in the nearby galaxy NGC 2770 (z ∼ 0.007, distance ∼29.5 Mpc). There are numerous intervening host galaxy H ii regions along the direction of the SN (Gorosabel et al. 2011) and no object was found at the transient location in the red band Digital Sky Survey (DSS) image observed between 1998 and 2000. Blondin & Calkins (2008) reported the first optical spectroscopic observation of this event taken on 2008 January 3.40 ut, classifying this transient as a Type Ib event similar to SN 2004gq. The discovery date corresponds to JD = 245 4466.17. According to initial spectroscopy (Blondin & Calkins 2008) the explosion happened within 7 d prior to its discovery. Modelling of radio data (Section 7) also indicates that the event was discovered within 4 d of the explosion. Here we adopt a conservative value of the explosion epoch to be 4 d prior the detection, i.e. JD = 245 4462.17. In rest of the work, if not mentioned, all the phases will be quoted with respect to this epoch. The field of SN 2007uy is presented in Fig. 1 and the properties of the host galaxy and the SN are provided in Table 1. A detailed description of the host can be found elsewhere (Thöne et al. 2009). SN 2007uy was also detected in radio bands at +10 d (Soderberg 2008) with an X-band (8.46 GHz) flux density of 0.29 ± 0.03 mJy. The SN was also detected at X-ray wavelengths (Pooley & Soderberg 2008).
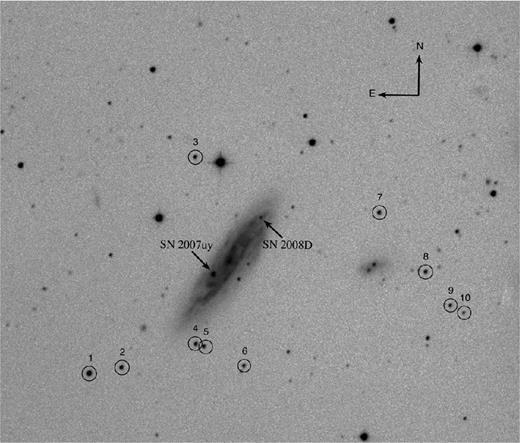
Identification chart of SN 2007uy. The image is about 10 arcmin on a side taken in V band with the 104-cm Sampurnanand telescope at ARIES, Nainital. The local secondary stars are numbered. North is up and east is to the left.
Properties of the host galaxy NGC 2770 and SN 2007uy.
| Parameters | Value | Ref.a |
|---|---|---|
| NGC 2770 | ||
| Type | SABc | 1 |
| Position | |$\alpha _{{\rm J2000}} = 09^{\rm h} 09^{\rm m} 33{^{\mathrm{s}}_{.}}68$| | 1 |
| δJ2000 = +33°07′24|${^{\prime\prime}_{.}}$|7 | ||
| Abs. magnitude | MB = −20.78 mag | 1 |
| Distance | D = 29.5 ± 1.8 Mpc | Section 4 |
| Scale | 1 arcsec ∼ 136 pc, 1 arcmin ∼ 8.2 kpc | |
| Distance modulus | μ ∼ 32.4 mag | |
| Apparent radius | r25 = 1.73 arcmin ( ∼ 15.09 kpc) | 1 |
| Inclination angle | Θinc = 82| $_{.}^{\circ}$|3 | 1 |
| Position angle | Θmaj = 146| $_{.}^{\circ}$|1 | 1 |
| Heliocentric velocity | czhelio = 1947 ± 2 km s−1 | 1 |
| SN 2007uy | ||
| Position | |$\alpha _{{\rm J2000}} = 09^{\rm h} 09^{\rm m} 35{^{\mathrm{s}}_{.}}40$| | 2 |
| δJ2000 = +33°07′09|${^{\prime\prime}_{.}}$|9 | ||
| Location | 20|${^{\prime\prime}_{.}}$|6 E, 15|${^{\prime\prime}_{.}}$|5 S | 2 |
| Deprojected radius | rSN = 42.44 arcsec (∼5.3 kpc) | Section 4 |
| Discovery date (ut) | 2007 December 31.7 | 2 |
| (JD 245 4466.17) | ||
| Explosion epoch | ∼4 d prior to discovery | Section 1 |
| (JD 245 4462.17) | ||
| Total reddening | E(B − V) = 0.63 ± 0.15 mag | Section 4 |
a1 – HyperLEDA – http://leda.univ-lyon1.fr; 2 – Nakano et al. (2008).
Swift/UVOT photometry of SN 2007uy.
| ut date | JD | Phasea | uvw2 | uvw2 | uvw1 | u | b | v |
|---|---|---|---|---|---|---|---|---|
| (yyyy/mm/dd) | 245 4000+ | (d) | (mag) | (mag) | (mag) | (mag) | (mag) | (mag) |
| 2008/01/06.15 | 471.65 | +9 | 21.45 | 24.33 | 18.61 ± 0.18 | 16.89 ± 0.06 | 17.28 ± 0.06 | 16.62 ± 0.08 |
| 2008/01/06.49 | 471.99 | +10 | 20.29 ± 0.39 | 21.31 ± 4.25 | 18.45 ± 0.10 | 16.93 ± 0.04 | 17.02 ± 0.03 | 16.47 ± 0.04 |
| 2008/01/09.71 | 475.21 | +13 | 20.05 ± 0.35 | 20.15 ± 0.58 | 18.23 ± 0.10 | 16.78 ± 0.04 | 16.81 ± 0.03 | 16.09 ± 0.04 |
| 2008/01/11.38 | 476.88 | +14 | 20.33 ± 0.27 | 20.69 ± 0.65 | 18.37 ± 0.06 | 16.69 ± 0.02 | 16.79 ± 0.02 | 15.96 ± 0.02 |
| 2008/01/11.99 | 477.49 | +15 | 21.28 ± 0.82 | >20.57 | 18.51 ± 0.07 | 16.72 ± 0.02 | 16.81 ± 0.02 | 15.93 ± 0.02 |
| 2008/01/12.57 | 478.07 | +15 | 20.48 ± 0.40 | 21.40 ± 3.72 | 18.45 ± 0.09 | 16.76 ± 0.03 | 16.77 ± 0.02 | 15.85 ± 0.03 |
| 2008/01/13.21 | 478.71 | +16 | 20.59 ± 0.47 | 22.63 | 18.50 ± 0.09 | 16.76 ± 0.03 | 16.80 ± 0.03 | 15.93 ± 0.03 |
| 2008/01/13.89 | 479.39 | +17 | 20.34 ± 0.29 | 20.81 ± 0.68 | 18.41 ± 0.07 | 16.78 ± 0.03 | 16.81 ± 0.02 | 15.81 ± 0.02 |
| 2008/01/14.73 | 480.23 | +18 | 21.41 ± 0.87 | >20.59 | 18.61 ± 0.08 | 16.88 ± 0.03 | 16.77 ± 0.02 | 15.80 ± 0.02 |
| 2008/01/15.49 | 480.99 | +18 | 21.32 ± 1.00 | >20.36 | 18.95 ± 0.12 | 17.03 ± 0.04 | 16.81 ± 0.02 | 15.79 ± 0.02 |
| 2008/01/16.29 | 481.79 | +19 | 20.77 ± 0.47 | >20.36 | 18.85 ± 0.11 | 17.04 ± 0.04 | 16.81 ± 0.02 | 15.78 ± 0.02 |
| 2008/01/17.14 | 482.64 | +20 | 21.43 | >19.88 | 18.93 ± 0.09 | 17.15 ± 0.03 | 16.90 ± 0.03 | 15.77 ± 0.02 |
| 2008/01/17.81 | 483.31 | +21 | 21.53 ± 0.96 | 22.97 | 18.94 ± 0.08 | 17.27 ± 0.03 | 16.89 ± 0.02 | 15.73 ± 0.02 |
| 2008/01/18.85 | 484.35 | +22 | >20.87 | 22.19 | – | – | – | – |
| 2008/01/21.12 | 486.62 | +23 | 22.92 | 24.98 | 19.62 ± 0.11 | 18.07 ± 0.05 | 17.26 ± 0.03 | 15.89 ± 0.02 |
| 2008/01/21.76 | 487.26 | +25 | – | – | 19.71 ± 0.40 | 18.30 ± 0.17 | 17.25 ± 0.07 | 15.94 ± 0.07 |
| 2008/01/25.17 | 490.67 | +28 | – | – | >20.64 | – | – | – |
| 2008/01/26.41 | 491.91 | +29 | – | – | 20.84 ± 0.29 | 19.33 ± 0.10 | 17.88 ± 0.03 | 16.28 ± 0.02 |
| 2008/01/27.98 | 493.48 | +31 | – | – | >20.91 | – | – | – |
| 2008/01/29.35 | 494.85 | +32 | – | – | >20.78 | – | – | – |
| 2008/01/30.81 | 496.31 | +35 | – | – | 22.04 ± 0.50 | 20.78 ± 0.58 | 18.51 ± 0.06 | 16.66 ± 0.03 |
| 2008/02/01.93 | 498.43 | +37 | – | – | >20.87 | 21.59 ± 1.57 | 18.53 ± 0.06 | 16.86 ± 0.03 |
| 2008/02/03.93 | 500.43 | +39 | – | – | 19.90 ± 1.25 | – | – | – |
| 2008/02/08.95 | 505.45 | +43 | – | – | 22.39 ± 0.50 | – | – | – |
| 2008/02/10.89 | 507.39 | +45 | – | – | – | – | 19.05 ± 0.10 | – |
| 2008/02/13.03 | 509.53 | +47 | – | – | – | – | 18.95 ± 0.09 | 17.27 ± 0.05 |
| 2008/02/16.11 | 512.61 | +50 | – | – | – | – | – | – |
| 2008/02/22.30 | 518.80 | +57 | – | – | – | – | – | – |
| 2008/02/25.79 | 522.29 | +60 | – | – | – | – | 18.96 ± 1.04 | 17.72 ± 0.09 |
| 2008/03/12.60 | 538.10 | +75 | – | – | – | – | – | 17.84 ± 0.12 |
aWith reference to the epoch of explosion JD 245 4462.17.
In this paper, we present photometric follow-up of SN 2007uy in near-ultraviolet (NUV), optical and near-infrared (NIR) bands and low-resolution spectroscopic follow-up observations in optical. We summarize the observations and data reduction procedure in Section 2. We study the spectroscopic evolution in Section 3. The distance and reddening have been estimated in Section 4. In Section 5 photometric evolution is investigated, while Section 6 presents the evolution of colour and bolometric light. The main physical parameters of the explosion and the characteristics of the progenitor are derived and discussed in Sections 7 and 8.
OBSERVATIONS AND DATA REDUCTION
Near-ultraviolet, optical and near-infrared multiband photometry
The Ultraviolet Optical Telescope (UVOT) monitored the SN at 30 phases between +9 and +75 d. The observations were carried out in |$uvw2\ (\lambda _{\rm c}=2030\,\mathrm{{A\!\!\!\!\!^{^\circ}}}),\ uvm2\ (\lambda _{\rm c}=2231\,\mathrm{{A\!\!\!\!\!^{^\circ}}}),\ uvw1\ (\lambda _{\rm c}=2634\,\mathrm{{A\!\!\!\!\!^{^\circ}}}),\ u\ (\lambda _{\rm c}=3501\,\mathrm{{A\!\!\!\!\!^{^\circ}}}),\ b\ (\lambda _{\rm c}=4329\,\mathrm{{A\!\!\!\!\!^{^\circ}}}) {\rm \ and}\ v \ (\lambda _{\rm c}=5402\,\mathrm{{A\!\!\!\!\!^{^\circ}}})$| bands (see Table 2 for details). We obtained the UVOT data from the Swift Data Archive. The photometry was done using standard procedures using heasoft routines1 and it was calibrated to the UVOT photometric system following the procedure described in Poole et al. (2008). To remove the contribution of the underlying host galaxy, we measured the host galaxy flux at the position of the SN from late time UVOT observations, with no contribution from the SN. This additional flux was then subtracted from SN photometric measurements. For all observations the source was close to the centre of the field-of-view, and differences in the point spread function (PSF) between observations were, therefore, negligible.
The optical broad-band Johnson UBV and Cousins RI follow-up observations were performed at 27 phases between ∼+16 to +130 d using the 104-cm Sampurnanand Telescope (ST) + imaging camera2 at Nainital, India, and the 2.56-m Nordic Optical Telescope (NOT) + Andalucia Faint Object Spectrograph and Camera (ALFOSC) at La Palma, Spain. Several exposures, in the range 100–300 s, were taken and in order to increase the signal-to-noise ratio (SNR), photometry was performed on the co-added frames. The pre-processing of raw data were performed through standard data reduction software iraf3 and photometry was performed using the stand-alone version of daophot4 (Stetson 1987).
The SN was surrounded by a star-forming knot and the host galaxy is highly inclined (∼82| $_{.}^{\circ}$|3) with respect to the line of sight. The SN flux was therefore highly contaminated by the background. In order to account for this, late time (∼36 months) high SNR images of the host galaxy in UBVRI bands, obtained from the NOT under good photometric conditions, were used to map the galaxy flux, and a template subtraction technique (Roy et al. 2011a,b) was adopted to remove the galaxy contributions. Before flux subtraction, both NOT and ST images were brought to a common ‘plate-scale’ using the ‘magnify’ task provided in the iraf package. The instrumental magnitudes of the SN were derived from the template subtracted SN frames using the PSF fitting method.
The field of SN 2007uy was calibrated from ST in the BVRI bands using Landolt (1992) standard stars of the fields of PG 1633+009 and PG 1047+003 observed on the night of 2008 March 2 under moderate seeing [full width at half-maximum (FWHM) ∼ 2 arcsec in R band] and transparent sky conditions. We used mean values of the atmospheric extinction coefficients of the site (namely 0.28, 0.17, 0.11 and 0.07 mag per unit airmass for the B, V, R and I bands, from Kumar et al. 2000) with typical standard deviations between the transformed and the standard magnitudes of Landolt stars of 0.04 in B, 0.02 in V and R and 0.01 in I band. A sample of 10 bright and isolated non-variable stars in the field of SN 2007uy was used as local standards to derive the zero-points for the SN at each epoch.
The location and magnitudes of these local standards are listed in Table 3. These secondary standards are marked in Fig. 1. For U band, the calibration of Malesani et al. (2009) is used. Table 4 lists the final photometry of SN 2007uy in the UBVRI bands at 37 phases between +16 and +129 d.
Photometry of local standard stars in the field of SN 2007uya.
| Star | α2000 | δ2000 | B | V | R | I |
|---|---|---|---|---|---|---|
| ID | (h m s) | (° ′ ′′) | (mag) | (mag) | (mag) | (mag) |
| 1 | 09:09:42.48 | 33:05:07.1 | 16.37 ± 0.04 | 15.56 ± 0.02 | 15.06 ± 0.02 | 14.64 ± 0.01 |
| 2 | 09:09:44.25 | 33:05:11.8 | 17.64 ± 0.04 | 16.98 ± 0.02 | 16.62 ± 0.03 | 16.27 ± 0.01 |
| 3 | 09:09:37.26 | 33:09:34.9 | 17.85 ± 0.04 | 17.34 ± 0.03 | 17.01 ± 0.03 | 16.69 ± 0.02 |
| 4 | 09:09:36.84 | 33:05:46.0 | 18.00 ± 0.05 | 17.26 ± 0.02 | 16.84 ± 0.03 | 16.43 ± 0.01 |
| 5 | 09:09:36.12 | 33:05:42.9 | 18.11 ± 0.05 | 17.48 ± 0.03 | 17.13 ± 0.03 | 16.81 ± 0.02 |
| 6 | 09:09:31.93 | 33:05:19.5 | 19.01 ± 0.05 | 17.93 ± 0.04 | 17.26 ± 0.04 | 16.74 ± 0.01 |
| 7 | 09:09:18.95 | 33:08:33.4 | 17.54 ± 0.04 | 17.15 ± 0.02 | 16.87 ± 0.03 | 16.57 ± 0.01 |
| 8 | 09:09:14.29 | 33:07:16.0 | 18.85 ± 0.05 | 17.49 ± 0.03 | 16.63 ± 0.03 | 15.92 ± 0.01 |
| 9 | 09:09:11.82 | 33:06:34.6 | 19.09 ± 0.05 | 18.02 ± 0.04 | 17.36 ± 0.04 | 16.86 ± 0.01 |
| 10 | 09:09:10.49 | 33:06:25.6 | 19.83 ± 0.05 | 18.72 ± 0.04 | 17.97 ± 0.04 | 17.37 ± 0.02 |
aThe U-band data are standardized with respect to the field standards mentioned in Malesani et al. (2009). Errors are 1σ uncertainties and it include both photometric as well as calibration errors.
UBVRI photometry of SN 2007uy.
| ut date | JD | Phasea | U | B | V | R | I | Telescopeb |
|---|---|---|---|---|---|---|---|---|
| (yyyy/mm/dd) | 245 4000+ | (d) | (mag) | (mag) | (mag) | (mag) | (mag) | |
| 2008/01/12.94 | 478.44 | +16 | 16.64 ± 0.01 | 16.78 ± 0.01 | 15.79 ± 0.01 | 15.54 ± 0.01 | – | NOT |
| 2008/01/13.99 | 479.71 | +17 | – | 16.77 ± 0.02 | 15.81 ± 0.03 | 15.51 ± 0.03 | 15.53 ± 0.03 | ST |
| 2008/01/14.85 | 480.58 | +18 | – | 16.74 ± 0.03 | 15.78 ± 0.03 | 15.46 ± 0.02 | 15.43 ± 0.04 | ST |
| 2008/01/15.19 | 480.69 | +18 | 16.69 ± 0.03 | 16.71 ± 0.02 | 15.76 ± 0.01 | 15.38 ± 0.02 | 15.31 ± 0.01 | NOT |
| 2008/01/15.99 | 481.72 | +19 | – | 16.78 ± 0.02 | 15.74 ± 0.02 | 15.44 ± 0.01 | 15.36 ± 0.03 | ST |
| 2008/01/17.19 | 482.69 | +20 | 16.95 ± 0.01 | 16.80 ± 0.01 | 15.81 ± 0.01 | 15.40 ± 0.01 | 15.21 ± 0.01 | NOT |
| 2008/01/28.94 | 494.44 | +32 | – | 17.98 ± 0.01 | 16.45 ± 0.01 | 15.72 ± 0.01 | 15.50 ± 0.01 | NOT |
| 2008/01/29.84 | 495.57 | +33 | – | 18.19 ± 0.02 | 16.44 ± 0.02 | 15.81 ± 0.02 | 15.59 ± 0.02 | ST |
| 2008/01/30.19 | 495.69 | +33 | – | – | 16.53 ± 0.02 | 15.79 ± 0.01 | 15.58 ± 0.01 | NOT |
| 2008/01/31.94 | 497.44 | +35 | 19.08 ± 0.02 | 18.22 ± 0.01 | 16.60 ± 0.01 | 15.89 ± 0.01 | 15.62 ± 0.02 | NOT |
| 2008/01/31.87 | 497.60 | +35 | – | 18.28 ± 0.03 | 16.54 ± 0.03 | 15.91 ± 0.03 | 15.62 ± 0.04 | ST |
| 2008/02/01.94 | 498.44 | +36 | 19.20 ± 0.03 | 18.29 ± 0.02 | 16.66 ± 0.02 | 15.96 ± 0.02 | 15.66 ± 0.02 | NOT |
| 2008/02/03.94 | 500.44 | +38 | 19.32 ± 0.03 | 18.41 ± 0.03 | 16.86 ± 0.02 | 16.08 ± 0.02 | 15.77 ± 0.02 | NOT |
| 2008/02/04.88 | 501.61 | +39 | – | 18.50 ± 0.06 | 16.82 ± 0.02 | 16.11 ± 0.02 | 15.83 ± 0.03 | ST |
| 2008/02/09.75 | 506.48 | +44 | – | 18.70 ± 0.03 | 17.07 ± 0.03 | 16.40 ± 0.03 | 15.97 ± 0.04 | ST |
| 2008/02/05.86 | 512.59 | +50 | – | 18.84 ± 0.03 | 17.33 ± 0.01 | – | 16.18 ± 0.03 | ST |
| 2008/02/18.94 | 515.44 | +53 | 19.75 ± 0.04 | 19.01 ± 0.03 | 17.33 ± 0.03 | 16.66 ± 0.03 | 16.26 ± 0.03 | NOT |
| 2008/02/23.65 | 520.37 | +57 | – | 19.27 ± 0.05 | 17.64 ± 0.04 | 16.84 ± 0.03 | 16.53 ± 0.07 | ST |
| 2008/02/24.62 | 521.35 | +58 | – | – | 17.52 ± 0.02 | 16.88 ± 0.02 | 16.44 ± 0.03 | ST |
| 2008/02/29.94 | 526.44 | +64 | – | – | 17.58 ± 0.03 | – | 16.48 ± 0.03 | NOT |
| 2008/03/02.75 | 529.45 | +66 | – | 19.22 ± 0.07 | – | – | – | ST |
| 2008/03/03.72 | 531.53 | +67 | – | 19.28 ± 0.06 | 17.66 ± 0.04 | 17.05 ± 0.03 | 16.54 ± 0.05 | ST |
| 2008/03/05.80 | 533.61 | +69 | – | 19.29 ± 0.03 | – | 17.05 ± 0.04 | 16.53 ± 0.06 | ST |
| 2008/03/17.69 | 543.19 | +81 | – | 19.31 ± 0.04 | 17.81 ± 0.03 | 17.29 ± 0.03 | 16.76 ± 0.03 | NOT |
| 2008/03/05.80 | 587.36 | +124 | – | – | 18.67 ± 0.02 | 18.32 ± 0.03 | 18.02 ± 0.06 | ST |
| 2008/05/02.61 | 589.34 | +126 | – | – | – | 18.51 ± 0.05 | – | ST |
| 2008/05/05.62 | 592.35 | +129 | – | – | 18.84 ± 0.03 | – | – | ST |
aWith reference to the epoch of explosion JD 245 4462.17.
bThe photometric observations are taken with the 1-m ST, ARIES, Nainital, and 2.6-m NOT with ALFOSC detector. Errors in magnitude denote 1σ uncertainty.
The field was also monitored in JHK NIR bands at eight phases between +16 and +87 d using United Kingdom Infrared Telescope (UKIRT) with Wide-Field Camera (WFCAM) as a backend detector (Hirst et al. 2006). The dithered images were processed with standard tasks in iraf and photometry was performed with daophot routines. The field was calibrated with respect to nearby Two Micron All-Sky Survey (2MASS) stars, and the calibrated JHK magnitudes of SN 2007uy are given in Table 5.
Near-infrared JHK photometry of SN 2007uy.
| ut date | JD | Phasea | J | H | K |
|---|---|---|---|---|---|
| (yyyy/mm/dd) | 245 4000+ | (d) | (mag) | (mag) | (mag) |
| 2008/01/12.67 | 478.17 | +16 | 14.48 ± 0.25 | 14.98 ± 0.25 | 14.98 ± 0.17 |
| 2008/01/14.68 | 480.18 | +18 | 14.32 ± 0.19 | 14.80 ± 0.24 | 14.71 ± 0.14 |
| 2008/01/15.66 | 481.16 | +19 | 14.26 ± 0.19 | 14.73 ± 0.24 | 14.67 ± 0.15 |
| 2008/01/17.69 | 483.19 | +21 | 14.12 ± 0.32 | 14.64 ± 0.28 | 14.51 ± 0.22 |
| 2008/01/23.67 | 489.17 | +27 | 14.13 ± 0.25 | 14.60 ± 0.25 | 14.51 ± 0.25 |
| 2008/02/15.92 | 512.42 | +50 | 15.76 ± 0.07 | 15.38 ± 0.02 | 15.06 ± 0.18 |
| 2008/02/24.92 | 521.42 | +59 | 16.07 ± 0.06 | 15.58 ± 0.03 | 15.32 ± 0.19 |
| 2008/03/23.92 | 549.42 | +87 | 17.03 ± 0.07 | 16.36 ± 0.03 | 16.21 ± 0.19 |
aWith reference to the epoch of explosion JD 245 4462.17.
Radio data
The transient was first detected in radio on 2008 January 6.18 ut, using the Very Large Array (VLA) at 8.46 GHz, with a flux density of 290 ± 30 μJy (Soderberg 2008). Although the VLA observations originally targeted SN 2007uy, after January 10.2 ut the field of observation was centred on another bright transient, SN 2008D, discovered in the same galaxy. Because of larger primary beam size of VLA in L (30 arcmin), C (9 arcmin) and X (5.4 arcmin) bands, the locations of both transients were within VLA field of view. Here, L band corresponds to 1.34–1.73 GHz, C band corresponds to 4.5–5.0 GHz and X band corresponds to 8.0–8.8 GHz radiation. We used the National Radio Astronomy Observatory (NRAO) archival facility to fetch these data sets and reduced the data using standard routines of Astronomical Image Processing System (aips).5 The transient was not detected in the radio U (14.4–15.4 GHz) band, but was prominent in the C and X band images. The new VLA data set is presented in Table 6. For further analysis we have used the literature data (van der Horst et al. 2011) along with the VLA archival data.
Log of radio observation of SN 2007uy from VLA in 4.8 and 8.4 GHz.
| ut date | JD | Phasea | Frequency | Flux | Flux errorb |
|---|---|---|---|---|---|
| (yyyy/mm/dd) | 245 4000+ | (d) | (GHz) | (mJy) | (mJy) |
| 2008/01/06 | 471.76 | +09 | 8.4 | 0.362 | 0.044 |
| 2008/01/07 | 473.11 | +10 | 8.4 | 0.306 | 0.070 |
| 2008/01/11 | 476.82 | +14 | 8.4 | 0.459 | 0.469 |
| 2008/01/14 | 479.76 | +17 | 8.4 | 0.513 | 0.040 |
| 2008/01/16 | 481.80 | +19 | 4.8 | 0.515 | 0.050 |
| 2008/01/16 | 481.83 | +19 | 8.4 | 0.688 | 0.057 |
| 2008/01/17 | 482.90 | +20 | 4.8 | 0.403 | 0.037 |
| 2008/01/17 | 482.92 | +20 | 8.4 | 0.566 | 0.053 |
| 2008/01/20 | 485.66 | +23 | 4.8 | 0.562 | 0.044 |
| 2008/01/21 | 486.66 | +24 | 8.4 | 0.724 | 0.060 |
| 2008/01/21 | 486.67 | +24 | 4.8 | 0.799 | 0.055 |
| 2008/01/23 | 488.66 | +26 | 4.8 | 0.770 | 0.060 |
| 2008/01/23 | 488.67 | +26 | 8.4 | 0.721 | 0.076 |
| 2008/01/25 | 490.67 | +28 | 8.4 | 0.797 | 0.056 |
| 2008/01/25 | 490.68 | +28 | 4.8 | 0.875 | 0.068 |
| 2008/01/27 | 492.92 | +30 | 8.4 | 0.965 | 0.081 |
| 2008/01/27 | 492.93 | +30 | 4.8 | 0.821 | 0.050 |
| 2008/01/30 | 495.82 | +33 | 8.4 | 0.953 | 0.070 |
| 2008/02/01 | 497.73 | +35 | 4.8 | 1.216 | 0.085 |
| 2008/02/01 | 497.74 | +35 | 8.4 | 0.968 | 0.068 |
| 2008/02/03 | 499.70 | +37 | 8.4 | 1.044 | 0.075 |
| 2008/02/03 | 499.71 | +37 | 4.8 | 1.072 | 0.065 |
| 2008/02/08 | 504.72 | +42 | 4.8 | 1.263 | 0.078 |
| 2008/02/08 | 504.73 | +42 | 8.4 | 1.011 | 0.075 |
| 2008/02/14 | 510.79 | +48 | 8.4 | 0.872 | 0.063 |
| 2008/02/14 | 510.80 | +48 | 4.8 | 1.249 | 0.085 |
| 2008/02/21 | 517.92 | +55 | 4.8 | 1.276 | 0.102 |
| 2008/02/21 | 517.93 | +55 | 8.4 | 0.522 | 0.048 |
| 2008/02/24 | 520.65 | +58 | 4.8 | 1.432 | 0.082 |
| 2008/02/24 | 520.66 | +58 | 8.4 | 0.677 | 0.046 |
| 2008/03/07 | 532.60 | +70 | 4.8 | 1.339 | 0.106 |
| 2008/03/07 | 532.62 | +70 | 8.4 | 0.596 | 0.062 |
| 2008/03/21 | 546.58 | +84 | 4.8 | 1.103 | 0.089 |
| 2008/03/22 | 547.65 | +85 | 8.4 | 0.351 | 0.049 |
| 2008/04/14 | 570.53 | +108 | 4.8 | 0.814 | 0.120 |
| 2008/05/04 | 591.36 | +129 | 4.8 | 0.457 | 0.107 |
aWith reference to the explosion epoch JD 245 4466.17.
bThe flux errors are measured using the expression |${\sigma }_f^2 = {(\epsilon S_0)}^2 + {\sigma }_0^2 + {\sigma }_{S_0}^2$|. Here S0 is the observed flux density, σ0 is the rms noise of the radio sky, |${\sigma }_{S_0}$| is the error associated with σ0 and ϵ is the fraction that accounts the error in VLA flux calibration. For 4.8 and 8.4 GHz observations value of ϵ is 0.05. For the epochs where measured flux density is less than three times of the corresponding value of σf, we have considered the flux density as the upper limit for our measurement.
Low-resolution optical spectroscopy
The spectroscopic observations of SN 2007uy were carried out at seven epochs between +17 and +392 d. The spectral data for +17 d were acquired with NOT/ALFOSC on 2008 January 13. The spectra for the epochs +32, +58, +122 and +392 d are based on the archival data obtained through ‘ESO Science Archive Portal’ which were acquired using 8-m Very Large Telescope (VLT) and 3.6-m New Technology Telescope (NTT). The spectral data for +96 and +162 d were taken from Milisavljevic et al. (2010). These were primarily acquired on 2008 April 1 and 2008 June 6 using the ‘MMTBLUECHANNEL’ detector at Multiple Mirror Telescope (MMT). A journal of spectroscopic observations is presented in Table 7.
Journal of spectroscopic observations of SN 2007uy a.
| ut date | Phaseb | Range | Telescopec | Grating | Slit width | Dispersion | Exposure | SNRd |
|---|---|---|---|---|---|---|---|---|
| (yyyy/mm/dd) | (d) | (μm) | (gr mm−1) | (arcsec) | (Å pixel−1) | (s) | (pixel−1) | |
| 2008/01/13 | +17 | 0.32–0.91 | NOT | 300 | 1.3 | 3.0 | 1200 | 135 |
| 2008/01/28 | +32 | 0.38–0.92 | NTT | 300 | 1.0 | 1.7 | 1200 | 170 |
| 2008/02/22 | +58 | 0.45–0.87 | VLT | 300 | 1.3 | 1.7 | 900 | 225 |
| 2008/04/01 | +96 | 0.32–0.80 | MMT | 300 | 1.0 | 2.0 | 600 × 4 | 110 |
| 2008/04/26 | +122 | 0.35–0.87 | VLT | 300 | 1.3 | 1.7 | 2940 | 250 |
| 2008/06/06 | +162 | 0.38–0.68 | MMT | 300 | 1.0 | 2.0 | 900 | 80 |
| 2009/01/20 | +392 | 0.33–0.87 | VLT | 300 | 1.3 | 1.7 | 3600 | 50 |
aThe spectra for +32, +58, +122 and +392 d are based on data obtained from the ESO Science Archive Facility. The spectra for +96 and +162 d are taken from Milisavljevic et al. (2010).
bWith reference to the epoch of explosion JD 245 4462.17.
cNOT: ALFOSC on 2.6-m Nordic Optical Telescope (NOT), la Palma; NTT: EMMI on 3.6-m New Technology Telescope, la Silla; VLT: FORS2 on 8.2-m ESO-VLT-UT1 telescope, Paranal Observatory; MMT: Blue Channel spectrograph on 6.5-m MMT at Mt. Hopkins.
dSignal-to-noise ratio at 0.6 μm.
All the raw optical data were processed using the standard tasks in iraf. Bias and flat-fielding were performed on each frame. Cosmic ray rejection on each frame was done by using Laplacian kernel detection routine lacosmic (van Dokkum 2001).6 Images were co-added to improve the signal-to-noise ratio and one-dimensional spectra were extracted from co-added frames using the apall task in iraf (Horne 1986). Wavelength calibration was performed using the identify task and the fifth-order fits were used to achieve a typical rms scatter of 0.1 Å (i.e. 60 km s−1 at 5000 Å). The position of the O i emission skyline at 5577 Å was used to check the wavelength calibration and deviations were found to lie between 0.5 and 1 Å and this was corrected by applying a linear shift in wavelength.
SPECTROSCOPIC EVOLUTION
In order to proceed further with the spectral analysis, the wavelength calibrated spectra were corrected for the recession velocity of the host galaxy using the prominent Balmer emission lines arising from the underlying H ii regions. In this way both the redshifts due to recession and rotation of the galaxy have been accounted for. All the spectra were normalized with respect to the peak flux of the underlying Hα feature and a constant offset was applied to present them clearly. In Fig. 2, the spectra of SN 2007uy are presented at seven epochs spanning between +17 and +392 d. The +17 d spectrum was taken near maximum light, while +162 and +392 d are late nebular phase spectra. The latter are enlarged by a factor of 2 for clarity. Spectral features are mainly identified as per previously published line identification lists for Type Ibc SNe (Cox 2000 and references therein), though high degree of line-blending and line-blanketing limit the detections. The dotted vertical line represents the position of Hα. We have marked few nebular lines like Hα, [O ii] λ3727, which belong to the associated star-forming region and is appeared starting from the early spectrum. The absence of Silicon (Si) feature at 6315 Å as well as the absence of H lines indicates that the spectra of SN 2007uy resemble those of stripped-envelope SNe. The lines are highly blended with each other and for most of the lines, the P-Cygni profiles are affected by ‘line-blanketing’. The metallic lines like Fe ii λ4401, Mg ii λ4481 as well as [Fe ii] λ5536, Na i D λλ5890, 5896 and Ca ii λλ8496, 8542 are prominent from the early epochs. In the +17 d spectrum, the features between 4700 and 5000 Å are plausibly attributed by the blend of He i λ4731 along with Fe ii multiplates. The lines of O, Mg and Ca start to appear nearly ∼30 d after the explosion. The spectra evolved faster than other Type Ibc SNe and except [O i] λλ6300, 6364; [Ca ii] and [O ii], all other features almost faded out by +162 d. This is in contrast with normal Type Ibc SNe, where emission line profiles remain prominent even beyond +250 d (see e.g. Cox 2000; Modjaz et al. 2008; Milisavljevic et al. 2010; Valenti et al. 2011).
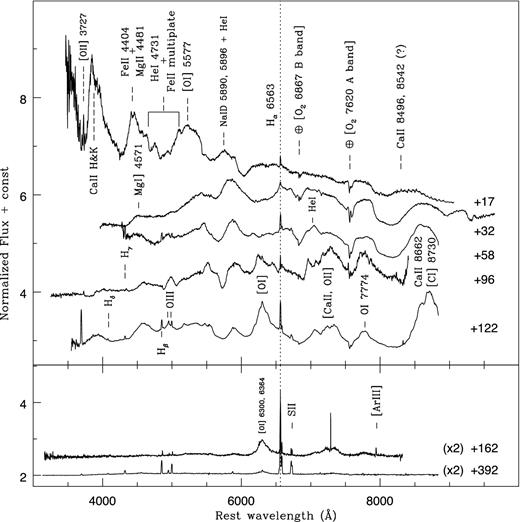
Spectroscopic evolution of SN 2007uy. All the spectra have been normalized with respect to the peak flux of the underling Hα feature and a constant offset has been applied to present them clearly. The +162 and +392 d spectra have been multiplied by a factor of 2 to enlarge several tiny features. The dotted vertical line represents the position of Hα and confirms the wavelength calibration within the limits of the spectral resolution.
The spectral lines [O i] λ5577 and [O i] λλ6300, 6364 show highly blueshifted emission profiles in the early phase spectra, before eventually moving to their respective rest wavelengths at the +92 d phase and onwards. The high blueshift of the spectral features is a signature of aspheric explosion. The blueshift of the spectral lines at early epochs was also observed in other Type I events, especially in the case of Type Ia events (Maeda et al. 2010a,b, 2011).
In Fig. 3 we compare the +17 d spectrum of SN 2007uy with the spectra of Type Ia, Ia-pec, Ibc and Ic events, taken at similar phases. The blueshift in the bluer part of the spectrum is clearly visible; and, the spectrum of SN 2007uy is highly similar to that of Type Ia and Ia-pec events (Maeda et al. 2010a, b; 2011). The characteristics that discriminate SN 2007uy from Type Ia events are the presence of He i lines as well as strong Hα which indicates that the progenitor is associated with a star-forming region, a common site for Type Ibc events. Moreover SN 2007uy is radio luminous (Section 2.2), which is the result of interaction of the SN shock with the circumburst medium. Type Ia SNe progenitors are not surrounded by a dense circumstellar medium (CSM) and hence are very rarely observable in the radio in the early epochs (Weiler et al. 2002; Chomiuk et al. 2012).
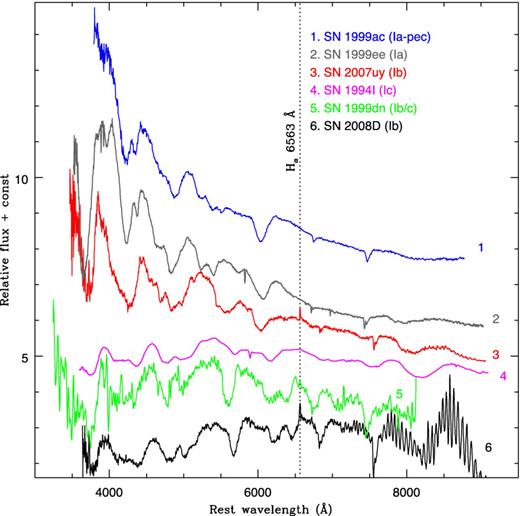
Spectroscopic comparison of SN 2007uy with other Type I events near maxima. The colour version of the figure is available in the online journal.
Evolution of some spectral lines: a message regarding the aspheric explosion
Fig. 4 presents the spectral evolution of Mg i], λ4571, [Fe ii] λ5536, Na i D λλ5890, 5896, [O i] λλ6300, 6364 and O i λ7774, which are commonly found in Type Ibc events and in Type IIP SNe. During the early epochs most of the features are highly blueshifted with respect to their rest wavelengths/velocities.
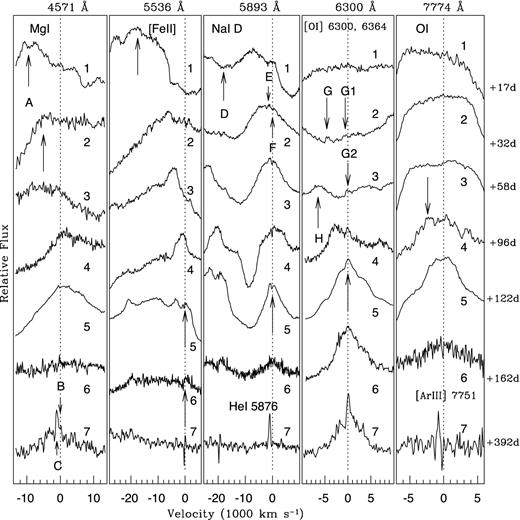
Temporal evolution of some spectral lines of SN 2007uy. The zero velocity shown with dotted line in each panel refers the rest wavelength of corresponding elements as mentioned at the top of the panels. The flux scale is relative. To make the features prominent, the intensity of each feature has been normalized by the flux of the zeroth velocity of the corresponding feature, though all the flux related measurements have been done using the normalized spectra shown in Fig. 2.
The early- and late-phase blueshifting of the spectral lines can arise for different reasons e.g. (i) contamination due to other emission lines (Elmhamdi et al. 2003), (ii) a torus or elongated ejecta with a sufficiently opaque inner portion (Chugai 1992; Wang & Hu 1994) or (iii) due to dust formation (Danziger et al. 1989; Lucy et al. 1989; Elmhamdi et al. 2003). For the formation of dust which can block the red wings of the spectral lines, the presence of a cold SN shell is required, whereas newly formed dust grains can only increase the continuum part (as discussed in Section 5.2). With a Monte Carlo simulation Taubenberger et al. (2009) showed that, due to the residual opacity of the core ejecta, the emission lines can be blueshifted only about by 30–40 Å, which is much less than the blueshifts (∼70–100 Å) observed for SN 2007uy. Thus, the third possibility can be ruled out for young ( ≲ 100 d) hot SN ejecta.
Asphericity in the SN explosion, with a torus or disc-like distribution of different elements perpendicular to a semibipolar jet, could also be an explanation for the aspheric signature of the lines viz, double-horn emission profile of [O i] λλ6300, 6364 (Maeda et al. 2008; Modjaz et al. 2008 and references therein). The residual opacity in the core of elongated ejecta may also be responsible for the observed blueshift. Optically thick inner ejecta could obstruct the light from the rear side of the SN, creating a flux deficit in the redshifted part of the emission lines (Chugai 1992; Wang & Hu 1994). It is worth mentioning that symmetric double-peaked profiles can also be explained by the doublet nature of [O i] λλ6300, 6364 seen under optically thick conditions leading to an intensity ratio close to one (Milisavljevic et al. 2010). Here we discuss the spectral evolution of each feature.
The Mg i] λ4571 (the first panel from the left of Fig. 4) is seen clearly in +35 d spectrum as a broad (FWHM ∼ 185 Å), highly blueshifted (∼71 Å) emission peak that corresponds to ∼4660 km s−1 blueshifted velocity of the emitting region projected on to the line of sight. The ‘double-horn’ feature marked with A at the extreme blue end, is also seen in +17 d spectrum. The Mg i] feature starts to move towards its rest wavelength after its first appearance at +32 d and remains as a broad emission peak (FWHM ∼ 205 Å) until +122 d with the emission peak at zero velocity. This broad feature almost disappears in the +162 d spectrum and remains as a weak feature marked as B in the deep nebular spectrum obtained at +392 d. The feature B is actually blended with a relatively blueshifted broad emission feature C. After deblending these two features, we marked the feature C as Ba ii λ4554 (Cox 2000).
The appearance of the extremely blueshifted (velocity ∼− 17 500 km s−1) emission peak of the blended lines of [O i] λ5577, [Fe ii] λ5536 and [Co ii] λ5526 at +17 d can be seen clearly (the second panel from the left of Fig. 4). A similar blueshifted emission was initially identified as [O i] λ5577 for SN 1993J (Filippenko, Matheson & Barth 1994; Spyromilio 1994; Wang & Hu 1994) and for SN 2007uy (Milisavljevic et al. 2010), although the study of Houck & Fransson (1996) showed that this emission is a blend of [O i], [Fe ii] and [Co ii]. Over time this feature developed and started to shift towards its rest wavelength from +122 d onwards. This confirms the prediction of Houck & Fransson (1996) and establishes this emission line as a blend. Similar to Mg i], [Fe ii] λ5536 also showed a symmetric emission profile at around zero velocity in late epoch ( ≳ 122 d) spectra. Interestingly from +122 d (labelled 5 in the second panel, from left, in Fig. 4) the intensity of this blended line dropped drastically. The blueshifted emission peak of [O i] λ5577 in the late-time evolution of the SN ejecta is commonly observed in Type Ibc SNe, e.g. 2004ao, 2006T, 2008D and 2008bo (Milisavljevic et al. 2010), but in none of the cases was a corresponding redshifted component was found.
The Na i D feature (the third panel from the left of Fig. 4) is more or less a perfect P-Cygni profile, nonetheless it also shows a highly blueshifted (velocity ∼7700 km s−1) emission peak, possibly blended with the He i λ5876 emission feature. The corresponding He i absorption dip is marked as D at +17 d. The velocity drops down to about 1933 km s−1 at +32 d and the feature becomes almost like a P-Cygni profile from +58 d. The Na i D feature is absent in +392 d spectrum and the He i λ5876 emission feature of the underlying star-forming region is clearly visible at its rest wavelength. A careful inspection shows the existence of a tiny emission peak E and an absorption dip F at ‘zero velocity’, starting from the initial epoch (+32 d). We speculate that E arises from of He i, while F is a footprint of intervening Na i D absorption due to the host galaxy. There are two tiny absorption features around E − one is at the right F and other at the left, about 2000 km s−1 blueshifted with respect to F that is equal to the redshift of the host. Hence the possibility of Na i D impressions due to host (feature F) and Milky Way (blueshifted feature) cannot be ruled out.
The [O i] λλ6300, 6364 is a frequently studied emission line in the context of the asymmetric nature of Type Ibc explosions. Different geometries of oxygen ejecta have been proposed as the origin of the observed line profiles of this doublet. A flat-topped profile is produced by a radially expanding spherical shell of oxygen gas; a parabolic profile is produced by a filled uniform sphere; and the double horned profile is due to the presence of a cylindrical-ring- or torus-like structure, that expands in the equatorial plane along the line of sight, where the bulk of the emitting gas is located at the projected expansion velocity (±v) of the torus and a jet-like ejection of matter is along the direction perpendicular to the line of sight. The ‘±’ sign represents the red and blueshifted projected velocity of the torus, respectively (Maeda et al. 2008; Modjaz et al. 2008 and references therein). Alternatively it can be interpreted as the doublet nature of [O i] λλ6300, 6364, seen in an optically thick environment (Milisavljevic et al. 2010). In the fourth panel of Fig. 4 we have shown its evolution. In +32 d spectrum a tiny emission feature G is appeared at a blueshifted velocity ∼5839 km s−1. Apparently it seems that by +58 d, this feature moves to a new position G2 along with the appearance of a second peak H at the bluer end. However, due to lack of spectrum between +32 and +58 d, this dynamics cannot be supported strongly. The velocity of H with respect to rest position of [O i] λ6300 is ∼7732 km s−1. This corresponds to a wavelength separation of about 163 Å. Undoubtedly G2 represents the rest wavelength of [O i] λ6300 and it has been found to be preserved during follow-up observations. G2 may also be an evolved stage of G1, a very tiny feature just above the noise level in +32 d spectrum. The feature G at 6205 Å may be due to a blend of Fe ii and Ca ii multiplates along with N ii and Ti ii, whereas since G1 starts to appear from early epochs, it is possibly due to a shallow spherical distribution of [O i] at the outer ejecta. At +96 d the separation between H and G1 is reduced to about 64 Å, but in the +122, +162 and +392 d spectra the emission peak profile became almost symmetrical around ‘zero velocity’. This indicates a uniform spherical distribution of [O i] λλ6300, 6364 from +122 d onward. Since G1 and H do not appear simultaneously, their internal separation is varying with time and the intensity ratio between the blue and red wings of the double horn feature does not tend towards 3:1 with time; we rule out the possibility of appearance of the doublet nature of [O i] λλ6300, 6364 in the form of a double horn profile, at least for this particular case. Since these features start to appear from a very early phase, the jet and disc/torus-like scenario, which is invoked to explain late-time ( ≳ 200 d) [O i] features, may not be applicable to explain this particular spectral evolution. Similarly the ‘flat-top’ scenario is also not applicable.
Unlike blended [O i] λ5577 and [O i] λλ6300, 6364, the O i λ7774 feature, shown in the rightmost panel of Fig. 4, developed as a symmetrical flat-topped peak, centred around ‘zero velocity’. Although the present spectra do not cover the emergence and development of the O i λ7774 line explicitly, they give a clear indication regarding the development of this particular line at around +96 d from a completely featureless part of the spectrum. At +122 d it becomes prominent, though it disappears at +162 d. The flat-topped peak is a clear indication of a shell-like structure of the line emitting region and a rapid dilution of the line emitting region is possibly responsible for the sudden decrease of line intensity. At +392 d, O i λ7774 disappears completely, rather we notice the impression of [Ar iii] λ7751 at its rest wavelength, about 1000 km s−1 blueshifted with respect to O i λ7774 in velocity domain.
From the above discussion it seems that the velocity profiles of different line-forming regions are not identical for SN 2007uy and hence probably the distribution of 56Ni does not influence the distribution of different material inside the ejecta of SN 2007uy, otherwise the evolution of all material would be of similar. The progenitors of Type Ib SNe have mainly He- and O-rich shells (Shigeyama et al. 1990). From the geometry of line profiles (Modjaz et al. 2008), we propose that O i λ7774 line-forming region was distributed inside the ejecta in the form of a shell whereas Na i D and Mg ions were concentrated towards the inner portion of the ejecta with a roughly spherical distribution. Evolution of the blended [O ii] λ5577 and [O ii] λ6300 lines are especially interesting. The projected velocity of H shows a power-law profile with temporal decay index −1.6 where the decay indices of Mg i], Na i D and [O ii] λ5577 blend (rest wavelength ∼5540 Å) are, respectively, −1.5, −1.6 and −1.3. This confirms that the regions which are forming the lines [O ii] λ5577 blend, feature H, Mg i] and Na i D are ‘attached’ with each other. Interestingly, the [O ii] λ5577 blend shows as a very tiny feature (FWHM ∼41 Å) at +32 d, before the emergence of feature H and became prominent (FWHM ∼63–68 Å) in the +58 and +96 d spectra during the appearance of feature H, before again shrinking to a tiny feature with FWHM ∼34 Å at +122 d when G2 and H merged together.
By +122 d H meets G2 (or both settle down to a constant velocity) and starts to move in a spherically symmetric manner and the ejecta becomes sufficiently cool. Our photometric calculation shows that temperature of these ejecta should asymptotically reach below 5000 K (see Section 5.2). In a simulation on forbidden lines in astrophysical jets Hartigan, Edwards & Pierson (2004) showed that below 5000 K the strength of [O i] λ5577 lessens in comparison to that of [O i] λ6300 ( ≲ 0.1), even with a moderate electron number density (see fig. 9 of Hartigan et al. 2004). Here we speculate that this could be the reason for the disappearance of [O i] λ5577 line in between +96 and +122 d.
The spectral evolution at the locations of the most prominent He i lines is displayed in Fig. 5. He i λλ6678, 7065 and 7281 are the strongest and, at the same time, most isolated He lines in the optical spectrum of a SN and are thus often used to distinguish between a SN Ib and Ic. In contrast, He i λ 5876 is often blended with Na i D (Fig. 4), a line that also appears in SNe Ic, and He i λ 4471 is in a region of the spectrum with other overlapping transitions, including Fe lines. Our spectrum at maximum light (+17 d) does not show any trace of He in any reasonable velocities. He i λ 7065 appears 15 d later at a velocity of ∼12 000 km s−1 (although the line is blended with the telluric B band). In the same spectrum we do not see any other credible He feature. The same holds for the spectrum at +58 d, where He i λ 7065 has decelerated to 10 000 km s−1. He i λλ6678, 7281 finally appear in the +96 d spectrum in a consistent velocity with He i λ7065 (∼7000 km s−1). Fig. 5 also shows the region around 6000 Å. This region is dominated by an absorption feature that is usually attributed to Si ii λ6355 in most Type I SNe. Adopting this identification, this line decelerates from ∼15 000 km s−1 at +17 d to ∼10 000 km s−1 at +96 d. What is striking, however, is the appearance of this feature in our second spectrum (+32 d) where it has become very strong and broad. It is obvious that this absorption cannot be caused by Si only (it extends to negative velocities) but it must be a blend with more features. Attributing this to He i λ6678 is of course a possibility. However, this line would have to appear at very high velocities in order to appear blended with the Si line (in most SNe Ib, these two features are clearly distinguishable). In addition, the line would have to be very strong and that appears to be in conflict both with the velocity and strength of the only other He i line detected in this spectrum (He i λ 7065) and with the sudden disappearance of this feature in the next spectrum. If we attribute the (now weak) feature on the right of Si ii λ6355 to He i λ6678 in the +58 d spectrum, this would have to be at ∼5000 km s−1, i.e. a velocity inconsistent with the one inferred by He i λ7065 at the same epoch. In general, we note that the appearance and disappearance of this deep trough at 6000 Å is rather unusual in comparison to normal Type Ib events.
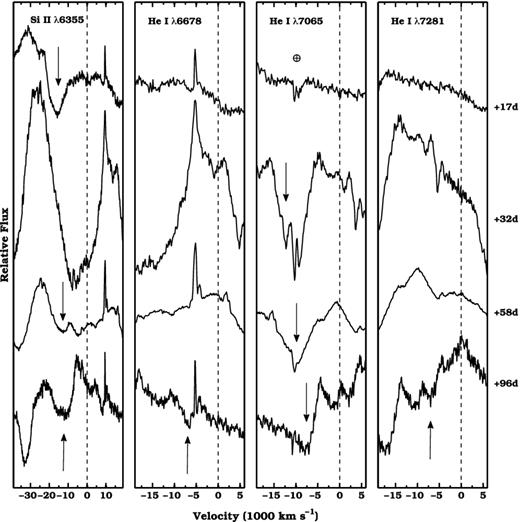
Temporal evolution of velocities of Si ii and He i spectral features in SN 2007uy.
DISTANCE AND EXTINCTION TOWARDS SN 2007uy
To determine the bolometric light curve and physical properties of the transient, a correct estimation of the distance and extinction is essential.
The host NGC 2770 is a well studied star-forming galaxy with nine redshift independent distance estimations.7 Out of them, eight measurements used the ‘Tully–Fisher’ technique and for one IRAS photometry was used. The measured values have a range between 26.1 and 36.0 Mpc, that corresponds to a weighted mean of 29.97 ± 3.48 Mpc. The Hubble flow distance of the host,8 after correction for Virgo infall, is estimated as 29.3 ± 2.1 Mpc. Combining the above measurements, we adopt the weighted mean distance of 29.5 ± 1.8 Mpc, which corresponds to a distance modulus of ∼32.4 mag.
The Galactic reddening along the line of sight of SN 2007uy as derived from the 100 μm all sky dust extinction map (Schlegel, Finkbeiner & Davis 1998) is E(B − V) = 0.022 ± 0.0004 mag. However, measuring the total line-of-sight extinction towards SN 2007uy is non-trivial. SN 2007uy is associated with a large number (about 150) of Hα emitters (Gorosabel et al. 2011) which are expected to be star-forming H ii regions and presumably few of them can make the transient highly extinguished. The host is also a highly inclined spiral galaxy (see Table 1), where the dusts are normally distributed along the edges of the young and old stellar discs (Popescu et al. 2011 and references therein) and hence expected to produce a large extinction towards the SN due to the foreground material. In fact, it has already been pointed out by Drout et al. (2011), with sufficient number of Type Ib events, that by and large the more extincted SNe reside in more inclined host galaxies. For e.g. SN 2007D is the most extinguished object which is hosted by a highly inclined (∼70°) galaxy; however, there are exceptions like SN 2004ge.
NGC 2770 hosted three SNe 1999eh, 2007uy and 2008D. The isophotal diameter of NGC 2770 is d25 = 3.567 arcmin. This corresponds to an apparent radius r25 = 1.734 arcmin of the host. On the other hand since NGC 2770 is a spiral galaxy, assuming the star-forming regions and SNe sites are distributed on the plane of the disc, the measured values of the deprojected distances of SNe 2007uy, 2008D and 1999eh from the centre of the host are roughly 0.707 arcmin (≡5.3 kpc), 1.210 arcmin (≡9.1 kpc) and 1.262 arcmin (≡9.5 kpc), respectively. This implies r2007uy ∼ 0.408r25, r2008D ∼ 0.698r25 and r1999eh ∼ 0.728r25. Thus all the SNe happened within half-light radius of the host. Moreover according to Thöne et al. (2009) the metallicities of these SNe sites are also comparable with each other (8.36 ± 0.1, 8.53 and 8.37 dex, respectively, for SN 2008D, SN 2007uy, SN 1999eh). So we can expect that the environments are similar and the host extinctions should have nearly equal values.
From the extinction values of the well studied nearby Type Ibc events, Drout et al. (2011) proposed an empirical relation to calculate the host reddening for Type Ibc events using the values of observed V − R colour of the transient at +10 d after V- and R-band maxima. According to this formalism, the magnitudes of the host reddening, E(B − V) for SN 2007uy measured with respect to the V- and R-band maxima are, respectively, 0.79 ± 0.18 and 0.82 ± 0.21 mag.
The colour excess of the host can be measured by means of Balmer decrement, usually from Hα /Hβ ratio (Osterbrock 1989) or from the equivalent width of the non-contaminated and non-saturated Na i D absorption feature (Barbon et al. 1990; Richmond et al. 1994; Elias-Rosa et al. 2007; Poznanski, Prochaska & Bloom 2012).
On the other hand, for SN 2007uy we found a prominent impression, F, of the host Na i D, though the two components are not resolved in the moderate resolution spectra. Using our four high S/N spectra (+32, +58, +96 and +122 d) where the unresolved Na i D feature was prominent, we calculate its mean equivalent width (EW) of 0.66 ± 0.04 Å. By using the expression of Poznanski et al. (2012) for the unresolved Na i D feature we derive the value of reddening to be E(B − V) |$={0.08}^{+0.03}_{-0.02}$| mag. We note that this value is similar to the line of sight reddening towards the face-on or less inclined galaxies (Sahu et al. 2009; Stritzinger et al. 2009; Roy et al. 2011a) and too low for a transient hosted by a highly inclined galaxy having a substantial foreground intervening medium. This value is comparable to the lower limit of reddening (0.063) that can be inferred from Na i D absorption feature in low-resolution spectra (Elias-Rosa et al. 2007). However, in the same contribution it was also pointed out that there is no clear empirical relation between E(B − V) and EW, at least in the regime of low-resolution spectroscopy. We also notice a prominent impression E of He i λ5876 in the spectra of SN 2007uy, that is due to associated star-forming region. This may be a prime source of contamination for the Na i D.
To avoid these problems, we measure the line ratio between N ii λ6583 and Hα and adopt an indirect method to measure the E(B − V) towards SN 2007uy. N ii λ6583/Hα ratio is actually a good estimator for oxygen abundance in extragalactic H ii regions (Pettini & Pagel 2004). After noticing a strong anticorrelation between N ii λ6583/Hα ratio and Hα equivalent width, whereas strong correlations among [O ii], Hα, Hβ and Hγ fluxes in a sample of about 74 star-forming blue galaxies, Kong et al. (2002) proposed an empirical relation between E(B − V) and N ii λ6583/Hα. They found that since N ii λ6583 and Hα are two nearby lines, the strength ratio will be less affected due to Galactic extinction while providing an approximate tracer of E(B − V) for highly reddened (E(B − V) ≳ 0.1 mag) extragalactic objects. Note, though, this is inefficient for low reddened objects. The +392 d spectrum, which has the least SN contribution and mostly contains the emission lines due to Hα knots, has been used to calculate E(B − V). The measured value of E(B − V) by this relation is |${0.52}^{+0.20}_{-0.14}$| mag. This is similar to the reddening along highly reddened SNe 2004ge and 2007D and also close to the mean reddening (E(B − V) ∼ 0.65 mag) along SN 2008D (Maund et al. 2009).
For this work, we adopt the weighted average of four measurements, obtained from the empirical relations proposed by Kong et al. (2002) and Drout et al. (2011) and ratio of Balmer decrement. This implies that the host reddening towards SN 2007uy is 0.63 ± 0.15 mag. Since this is an order of magnitude higher than the Galactic extinction, we anticipate that this is the total reddening along the line of sight of SN 2007uy. This corresponds to a total visual extinction (AV) of 1.9 ± 0.5 mag.
LIGHT-CURVE EVOLUTION: NUV, OPTICAL AND NIR
The calibrated light curves of SN 2007uy are presented in Fig. 6. The data cadences of ground-based optical and NIR observations are N(U, B, V, R, I, J, H, K) = (7, 19, 23, 20, 22, 8, 8, 8), while that for spaced-based NUV and optical observations are N(uvw2, uvm2, uvw1, u, b, v) = (14, 8, 18, 19, 28, 30), respectively. Since the host redshift is small, no ‘K-correction’ is applied. From the peak, the SN light is mainly powered by the radioactive decay of 56Ni and 56Co. The energy of γ-rays and positrons emitted by radioactive decay processes is fully absorbed by the SN ejecta and re-emitted as blackbody radiation. Hence in early phases Type I events can be approximated as ‘blackbody supernova’ (Arnett 1982). The emergence of a young Type I SN with its blackbody nature is clearly noticeable in all bands. At a few phases, the SN was not detected in some of the Swift/UVOT bands for which the corresponding upper limits are mentioned. In the ground-based observations, the maximum sampling of SN light was done in the V passband. Similarly, for the space-based Swift/UVOT observations the maximum sampling was done in v passband. Since the central wavelength and bandwidth of the V passband (5448 and 840 Å, respectively) is fairly similar to that of the v passband (5468 and 769 Å, respectively), we have treated the combined data of the V and v bands as a single visual data set for further analysis of photometric data and likewise the B- and b-band data sets have been combined as a single blue-band data set. In contrast, a significant deviation between the U and u passband light curves, starting from early epochs ( ≳ 20 d), is probably due to a considerable difference between their responses (for the U band: central wavelength 3663 Å bandwidth 650 Å for the u band: central wavelength 3465 Å bandwidth 785 Å, respectively).
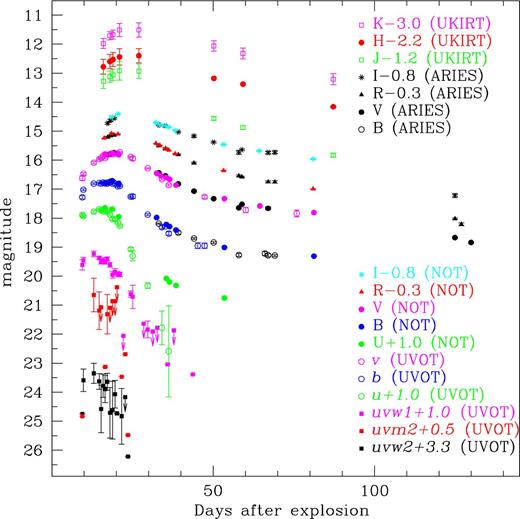
The light curves of SN 2007uy in NIR JHK, optical UBVRI and uvw2, uvm2, uvw1 and u, b, v NUV–optical UVOT bands. The colour version of the figure is available in the online journal.
The evolution of the SN light curve is composed of three distinct phases: (i) shock breakout phase (initial few days); (ii) photospheric phase (within first 40−50 d) and (iii) nebular phase (beyond 50 d after explosion). For this particular event we will discuss the evolution of photospheric and nebular phase light curves.
Evolution during photospheric phase
The temporal variation of the visual light roughly resembles the temporal variation of the total UVOIR (NUV+optical+NIR) light of the SN. The maxima of visual light also roughly correspond to the epoch of maximum of the UVOIR bolometric light of the transient. The rise time of SN 2007uy in the visual band is 19.4 d which is determined after estimating the maximum through third-order polynomial fitting on the early part ( ≲ 40 d) of the visual light curve. This is comparable with the rise time derived for engine-driven energetic, Type Ic SN 1998bw (16.14 ± 0.08 d) and optically- normal Type Ib SN 2008D (18.82 ± 0.24 d), whereas, it is longer than that of Type Ic SN 2002ap (10.12 ± 0.20 d) and engine-driven energetic SN 2006aj (10.37 ± 0.14 d). The measured rise time of SN 2007uy in U band is 15.13 ± 0.4 d, whereas in I band it is 23.09 ± 1.44 d. This shows that, similar to other Ibc events, SN 2007uy also evolved faster and peaked first at lower wavelengths and then at higher wavelengths.
The peak width (Δd0.25), defined as the width of the light curve, when the SN has faded by 0.25 mag from its maximum brightness, is also calculated for SN 2007uy. For the visual band it is roughly 11 d. This is comparable to the V-band peak width of SN 2006aj (Δd0.25 ∼ 11.1 d) and SN 2002ap (Δd0.25 ∼ 10.6 d), but less than engine-driven SN 1998bw (Δd0.25 ∼ 13.3 d) and normal Type Ib event SN 2008D (Δd0.25 ∼ 18.04 d).
The post maxima decay rates of SN 2007uy in the V and R bands are, respectively, 0.058 ± 0.002 and 0.042 ± 0.002 mag d−1, which corresponds to post-maxima decay parameters of (Δm15) of 0.87 ± 0.003 and 0.63 ± 0.03 mag respectively. Here Δm15 quantifies the decay in magnitude in 15 d after maxima. For the B and U bands, the value of Δm15 are even higher, around 1.2 and 2.1 mag, respectively. This is in agreement with the prediction of models on SN evolution (Woosley, MacFadyen & Heger 1999b). The V- and R-band decay rates are comparable with the decay rates of Type Ibc events studied by Drout et al. (2011). On the other hand, the spectroscopic study (see Section 3) showed convincingly that the event neither belongs to the Type Ic nor to the class Ic-BL.
Adopting the distance modulus of SN 2007uy ∼32.4 mag and total reddening along the line of sight E(B − V) ∼ 0.63 mag (see Section 4), we have computed absolute magnitudes in the BVRI passbands to compare it with other Type Ibc events (Fig. 7). For relatively redshifted objects, like SN 2006aj, the cosmological time dilation factor has been taken care into account to correct the corresponding time-scale. In all bands SN 2007uy was intrinsically brighter than the normal Type Ib event SN 2008D and Type Ic event SN 2002ap. Though in the R and I passbands it was a little dimmer than the GRB/XRF associated events SNe 2006aj and 1998bw, but its peak absolute R-band magnitude −18.5 ± 0.16 is about 1 mag brighter than the mean value (−17.6 ± 0.6) derived for well observed Type Ibc events (Drout et al. 2011). In the visual and blue bands its peak magnitude is comparable with energetic events associated with GRB/XRFs. Hence, SN 2007uy is optically more luminous than normal Type Ib events and comparable to the engine-driven energetic SNe.
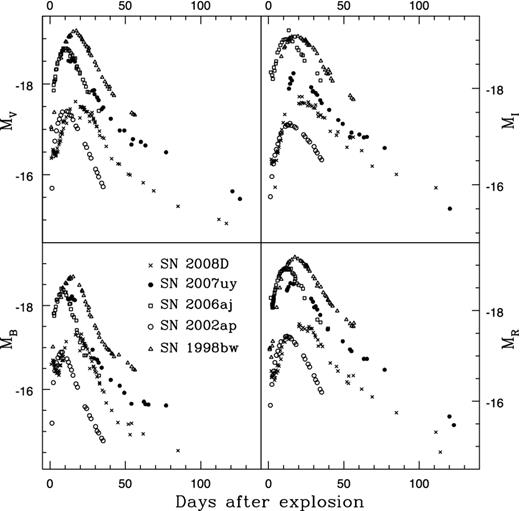
Absolute light curves of SN 2007uy. Comparison with other Type Ib and Ic events.
SN 2007uy was luminous in the NUV. It was detectable in the Swift/uvw2 and uvm2 images until +24 d, while in the uvw1 and u filter systems it was detected until +44 d. In contrast, SN 2008D which was more luminous in the X-ray and radio and happened in the same galaxy with almost similar environment (Thöne et al. 2009), was seldom detected in the Swift NUV bands. As we have noticed that SN 2007uy is luminous in higher optical frequencies and it is comparable to engine-driven energetic explosion like SN 2006aj, it is worth to compare the NUV flux of this event with that of engine-driven SNe. Fortunately, Swift has a good coverage of XRF 060218/SN 2006aj in all NUV bands during the phases comparable to that of SN 2007uy. Fig. 8 shows a comparison between the NUV and u absolute magnitudes of SN 2007uy with that of SN 2006aj. The UVOT data for SN 2006aj have been taken from Šimon et al. (2010). SN 2006aj seems to be dimmer than SN 2007uy. The nature of the evolving supernova is clearly visible in all absolute light curves of SN 2007uy. In the case of SN 2006aj, the nature of an evolving blackbody supernova is reflected in the u and marginally in the uvw1 light curves, whereas photometry of uvm2 and uvw2 images shows a very shallow linear decay of SN light in the NUV range. The post-maxima decay rates in these two bands, determined through a linear fit to these data sets, are, respectively, 0.06 and 0.04 mag d−1. If all optical photons are generated through blackbody radiation under similar conditions of the ejecta, then post-maxima decay rates in these two bands should be much higher than these values (assuming the SN will be optically thick during first 20 d); it was also predicted by Woosley, Eastman & Schmidt (1999a) through modelling of SN 1998bw spectra in the spectral range between the U and I passbands. For SN 2006aj, the measured post-maxima decay rate in the I band is ∼0.05 mag d−1 while in the B and uvw1 bands these are as high as ∼0.10 and 0.12 mag d−1, respectively. Hence the decay rate in NUV bands should be higher. This discrepancy was also noted by Šimon et al. (2010) and was explained as an effect of blackbody radiation emission (Panagia 2003) while the UV emitting area shrinks with time during the evolution of the transient.
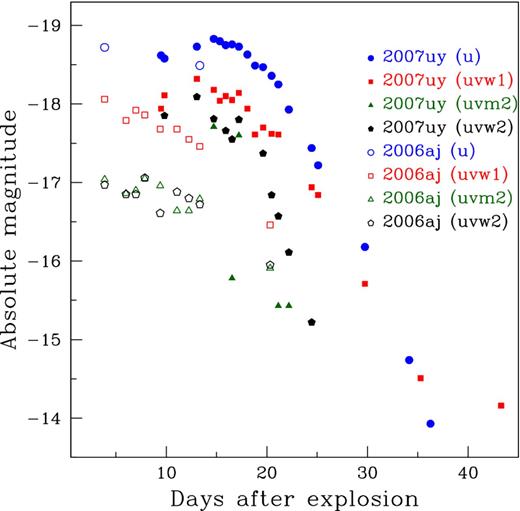
NUV and u band absolute light curves of SN 2007uy. Comparison with Type Ic event SN 2006aj. Data for SN 2006aj were presented by Šimon, Pizzichini & Hudec (2010). The colour version of the figure is available in the online journal.
In contrast, blackbody fitting to the early SN 2007uy data (Fig. 9) shows that envelope of this SN evolved more or less like a blackbody. Here we have plotted the flux, normalized with respect to the V-band flux, to nullify the effect due to time evolution of the angular diameter of the transient. The effect due to dilution of SN envelope is also neglected as a first approximation.10 The temperature of each blackbody is mentioned inside the parenthesis, with a temperature-scale 1000 K. The 1σ uncertainties are measured by applying the ‘Monte Carlo’ method. The initial temperature of the photosphere is ∼8000 K. During the next 6 d the temperature slightly increased to ∼8100 K and then started to decrease with time through a power law with temporal decay index ∼− 0.51, which is comparable with the theoretical prediction (−0.5) for a ‘blackbody supernova’ by Arnett (1982). The initial increment in temperature, followed by a power-law decay with time (decay index ∼− 0.12) was also observed in the Type Ic SN 2002ap (Vinkó et al. 2004). Thus we speculate that unlike XRF 060218/SN 2006aj, SN 2007uy evolved roughly as a ‘blackbody supernova’ from the very initial epoch.
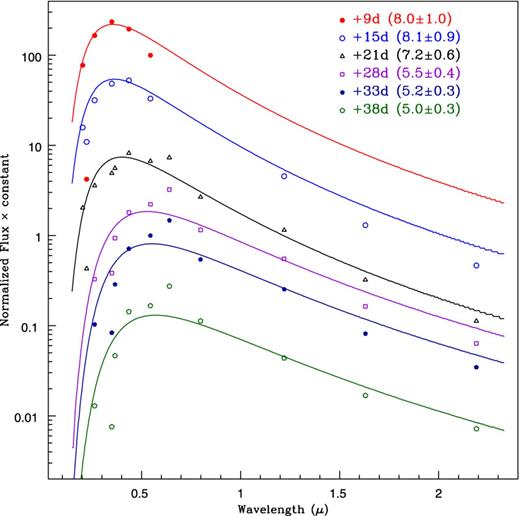
Temporal evolution of observed SED of SN 2007uy. The temperature of each blackbody is mentioned inside the parenthesis, with a temperature-scale 1000 K. The 1σ uncertainties are measured by applying the ‘Monte Carlo’ method. The colour version of the figure is available in the online journal.
Evolution during nebular phase
Normally after +50 to +60 d, the envelopes of most Type I events start to become optically thin, and hence the light curves start to flatten. In the B, V, R and I bands the decay rate of SN 2007uy is roughly 0.017–0.018 mag d−1, whereas in U band it is ∼0.03 mag d−1. This decay rate is similar to the nebular decay rates of other Type Ibc events and slightly higher than the decay rate of the 56Co → 56Fe nuclear transition, which is typically 0.0098 mag d−1. It is worth mentioning that in Type II SNe, mainly in normal Type IIP events, having a huge H shell in the outer surface, the nebular decay rates are comparable with that of 56Co (Roy et al. 2011a,b and references therein). On the other hand, for low-luminosity Type IIP events like SN 2005cs, the decay rate during nebular phase (∼0.0046 mag d−1 in V band during the period 140–320 d) is significantly lower than that of 56Co (Pastorello et al. 2009). This was also observed by Elmhamdi et al. (2003) in the normal Type IIP event SN 1999em during its initial (∼1 month) nebular phase. Utrobin (2007) explained this as an effect due to radiation generated inside the inner warmed ejecta, that propagates through the cool, optically thin outer region and makes the nebular light relatively stable. The relatively high decay in very late epoch (t >300 d) during the evolution of SN 2005cs was explained as resulting either due to (i) dust formation in the SN ejecta, (ii) a lower efficiency of γ-ray trapping due to the decreased density of the ejecta or due to (iii) cooling of inner ejecta (Pastorello et al. 2009).
The optical and NIR nebular light curves of SN 2007uy show sharper decay (∼0.02–0.03 mag d−1) than the canonical decay of radioactive 56Co. A similar decay rate was also noticed for SN 2002ap (Pandey et al. 2003; Vinkó et al. 2004), which was explained as a leakage of γ-photons from the transparent and less massive SN atmosphere. Dust formation may also be another cause. With increasing time, the newly formed small dust grains in the ejecta can progressively reduce the fluxes of SN in all bands. Though there is a possibility for the creation of dust grains of size ≲ 0.01 μm within the first 100–300 d in Type I SNe (Smith, Foley & Filippenko 2008; Nozawa et al. 2011), these hot grains (T ∼ 1600 K) would cause an IR excess in the SN continuum spectra. Moreover, dust formation should manifest itself by creating a blueshift in the line, increasing with time. Neither excess in the continuum, nor the temporal increment in the blueshifts of the spectral lines were observed for SN 2007uy (rather it decreases with time; see Section 3). In fact beyond +50 d SN 2007uy started to become bluer (see Section 6), which does not support dust formation during the period of observation. Thus the possibility of dust formation at the outer shell of the ejecta in early epoch is also unable to explain this deviation.
Here we propose that leakage of γ-photons is the principal cause for rapid decay in light curve of SN 2007uy, like other stripped-envelope supernovae. We also admit that this simultaneously depends on the amount of ejected mass (Mej) and how fast it becomes diluted (optically thin). If Ek is the kinetic energy of the explosion then the decay rate of the nebular phase is roughly proportional to |$M_{{\rm ej}}/E_{\rm k}^{1/2}$| (Valenti et al. 2008). So, explosions with higher ejecta mass and kinetic energy or lower mass with low kinetic energy should show a similar trend in nebular decay. For e.g. the very late time (>150 d after explosion) evolution of SNe 1998bw and 2006aj also show an almost identical decay rate in the V, R, I bands of ∼0.02 mag d−1 and higher than the decay rate of 56Co (Patat et al. 2001; Misra, Fruchter & Nugent 2011). The first one is an explosion with higher mass of ejecta and kinetic energy, while the second shows a lower ejecta mass with smaller amount of kinetic energy.
EVOLUTION OF COLOUR AND BOLOMETRIC LIGHT
The reddening-corrected colour evolution of SN 2007uy is presented in Fig. 10. For comparison, the colour curves of the well-studied SNe 1998bw (Galama et al. 1998), 2002ap (Foley et al. 2003), 2006aj (Ferrero et al. 2006) and 2008D (Soderberg et al. 2008; Roy 2013) have been plotted. The evolution of intrinsic colour of SN 2007uy is similar to that of other events, however, during early phases ( ≲ +35 d) the SN seems to be bluer than the other SNe, especially in (V − I)0 colour. This is a manifestation of enhanced line emission due to He i λ5876 and [O i] λ5577 in comparison to the higher wavelength part of the spectrum, which is also confirmed from +17 d spectrum. Like other events, SN 2007uy also shows a transition from blue to red during its initial evolution ( ≲ +40 d) and turned bluish during its nebular evolution ( ≳ +50 d). This is probably due to transition of ejecta from optically thick to optically thin state, which in turn initiates the escape of high-energy optical photons in a large amount from the SN ejecta.
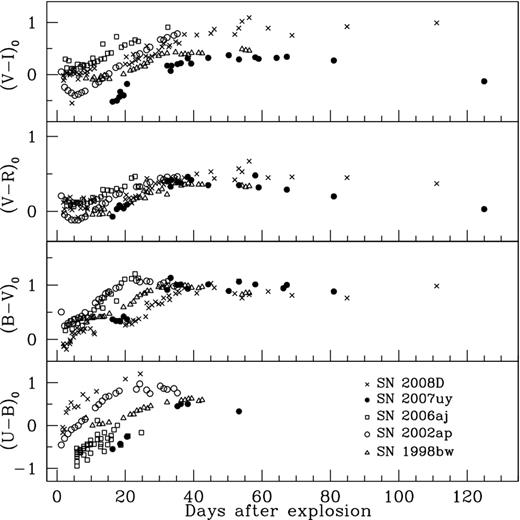
Colour evolution of SN 2007uy. Comparison with other Type Ibc events.
The bolometric light curve is crucial for the calculation of the synthesized radioactive 56Ni, the kinetic energy of the explosion, the amount of mass that was expelled during the explosion and hence to understand the nature of the progenitor. The quasi-bolometric UVOIR light curve has been computed from UV, optical and NIR data for the event that is presented in Fig. 11. Bolometric fluxes have been computed in those epochs for which visual magnitudes are available. The extinction-corrected magnitudes are first converted into fluxes using zero-points given by Bessell, Castelli & Plez (1998) and then the total flux in the UVOIR bands is obtained after a linear interpolation and integration between 0.203 and 2.19 μm. The JHK contribution during the photospheric phase is calculated from our data, whereas beyond +80 d, in the nebular phase, due to lack of UV and NIR data, we are not able to make any direct measurement. For many Type Ia supernovae it has been observed that the NUV and NIR contribution at the nebular phase is roughly 20 per cent (Contardo, Leibundgut & Vacca 2000; Leloudas et al. 2009). However, for Type Ic SN 2002ap, Tomita et al. (2006) found a relatively higher contribution (∼25–30 per cent) from NIR light during comparable epochs. So, for present analysis, beyond +80 d, we increase the bolometric flux by 35 per cent to estimate the maximum possible contribution from NUV and NIR light and construct the UVOIR quasi-bolometric light curve. Similarly, before the peak, there are few epochs for which we do not have any RI and JHK data. To calculate the magnitudes at those epochs, a blackbody spectrum has been fitted to construct the SED for each day (see Fig. 9) and synthetic magnitudes have been calculated from the SED.
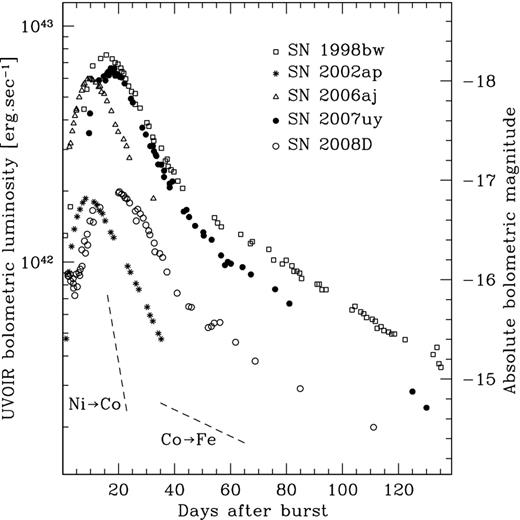
The UVOIR bolometric light curve of SN 2007uy. Comparison with other Type Ibc events. The colour version of the figure is available in the online journal.
The peak UVOIR bolometric luminosity of SN 2007uy is about 6.4× 1042 erg s−1 which is comparable to that of the engine-driven energetic SN 1998bw (∼7.5 × 1042 erg s−1) and SN 2006aj (∼5.9 × 1042 erg s−1), and much higher than the broad-lined Type Ic event SN 2002ap (∼2.1 × 1042 erg s−1) and the optically normal Type Ib event SN 2008D (∼2.0 × 1042 erg s−1). The peak luminosity of Type I SNe is roughly proportional to the ejected amount of 56Ni because the contributions from shock heating and CSM interaction are small. Since the maximum light of SN 2007uy is almost similar to that of SNe 2006aj and 1998bw, hence the amount of synthesized radioactive 56Ni nuclei should be comparable with these engine-driven events. On the other hand, the decay rate in nebular phase is comparable with decay of 56Co to 56Fe, though there is a slight deviation as mentioned in Section 5.2.
The bolometric light of a CCSN can comprise light from different components, such as the explosion of a single massive progenitor, the emergence of a magnetar, the interaction of ejecta with the CSM, or possibly due to a combination of these. The signature of SN shock interaction with its CSM can be seen through radio observations (see Section 7).
PHYSICAL PARAMETERS OF THE EXPLOSION
To determine the physical parameters of the exploding star, modelling of the UVOIR bolometric light is essential. In addition to that, to quantify the interaction with CSM, modelling of the radio data is also required.
Modelling of optical light curve
To derive the physical parameters, we have followed the methodology of Valenti et al. (2008), i.e. the early and nebular phase have been modelled separately.
For t ≲ 30 d past-explosion, the ejecta is presumed to be optically thick, having a spherically symmetric, homologous expansion and all the radioactive 56Ni is located in the centre. The model also assumes that the radius of the expanding shell is much higher than the radius of the progenitor, the optical opacity κopt ∼ 0.06 cm2 g−1 remains constant throughout its evolution (Maeda et al. 2003), and the total radioactive energy of 56Ni → 56Co → 56Fe is responsible for the heating of the ejecta and the diffusion approximation is valid for the photons (Arnett 1982; Valenti et al. 2008; Benetti et al. 2011; Pignata et al. 2011; Olivares et al. 2012). In the nebular phase (beyond ≳ 60 d), the ejecta become optically thin and the emitted luminosity is powered by three sources: instantaneous energy of the γ-rays generated during the 56Co decay; energy of the γ-rays coming from electron–positron annihilation and due to the kinetic energy of the positrons (Sutherland & Wheeler 1984; Cappellaro et al. 1997). The low and high γ-ray trapping, respectively at early and late phases, have been invoked by dividing the ejecta into two components – a high-density inner region and a low-density outer region (Maeda et al. 2003). The outer region dominates the total emission mechanism at early epochs, i.e. in the optically thick regime, and emission from the inner region, with higher γ-ray opacity, dominates the nebular phase.
Optical modelling, as mentioned above, returns the values of four free parameters used to fit the bolometric light curve of SN 2007uy. These are the total mass of the ejected material (Mej), the total mass of 56Ni produced in the envelope (MNi), the mass fraction of the inner ejecta component (fM) and the fraction of kinetic energy contributed by the inner component (fE). To break the degeneracy between kinetic energy and ejected mass, the expression for velocity at peak luminosity has been used (Arnett 1982; also see the equation 2 of Valenti et al. 2008 and equation 3 of Olivares et al. 2012).
Velocities of the ejecta are measured from the blueshifts of the absorption dips of the P-Cygni profiles, but due to the heavy line blanketing identification of photospheric lines is not trivial and also the possibility to get the undisturbed lines is much less. Our first spectrum, taken near maximum, contains the He i λ5876 line, with a considerable blueshifted absorption dip. The measured velocity corresponding to this blue shift is roughly 15 200 km s−1. Assuming the He shells to be marginally detached from the photosphere, we can constrain the upper limit of the photospheric velocity (vph) within the above value.
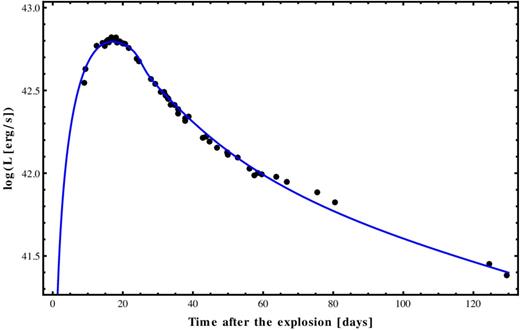
The modelled UVOIR bolometric light curve of SN 2007uy. The black dots are the observed data points. The blue solid line represents the model. The colour version is available in online journal.
Modelling of radio data
The radio light curve can be explained in terms of the evolution of the ejecta, which further determines the shape of the spectrum and evolution of its peak with time (Sari, Piran & Narayan 1998; Wijers & Galama 1999). It can also be explained by synchrotron self-absorption (SSA) with high brightness temperature and/or by a free–free absorption (FFA) from the ambient medium, which produces an exponential cut-off below the peak. A decrease in absorption with time, resulting a smooth, rapid turn-on, first at higher frequencies and later at lower frequencies. For each frequency, the peak flux corresponds to optical depth ∼1 and a power-law decline in the light curve can be seen. Finally, the spectral index approaches a constant negative value, which corresponds to non-thermal radiation in an optically thin medium (Weiler et al. 1986; Weiler, Panagia & Sramek 1990; Chevalier 1998) and Weiler et al. (1986) proposed a methodology for parametrization of SN radio light curve.
For the present work, we have parametrized the radio light curves of SN 2007uy to calculate the mass-loss rate. The upper panel of Fig. 13 presents the results of radio observations in six different frequencies. The early time data are too sparse to determine the spectral index (α) for the early part of the light curve, during the optically thick regime. Radio follow-up of this event has already been reported by van der Horst et al. (2011). To model the light curves we have also included the literature data along with this new data set. The modelled parameters are reported in Table 8. The notation used for the parameters is as defined by Weiler et al. (2011). The details for the modelling can be found in Weiler et al. (1986, 1990, 2011).
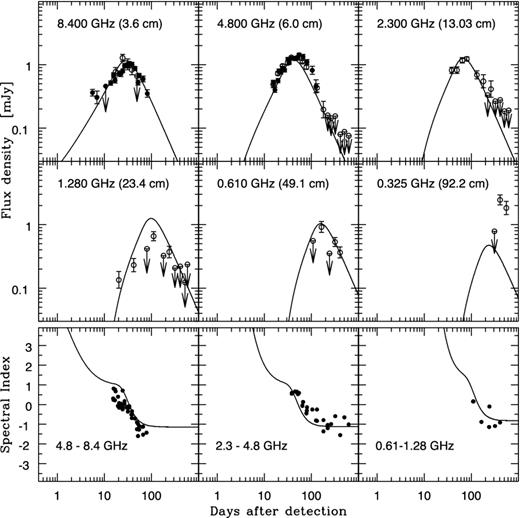
The modelled radio light curve of SN 2007uy. The upper panel shows the variation of radio signal with time. Open circles are the data obtained from van der Horst et al. (2011), whereas the filled circles are VLA data acquired for the present work. The solid curves represent the best-fitting model. The lower panel shows the variation of spectral index with time.
The parameters derived from the fitting of radio data.
| Parameters | Value |
|---|---|
| K1 | 1500.75 |
| α | −1.1435 |
| β | −1.734 |
| K2 | 91.38 |
| t0 | −3.59 d |
| δ | 2.41 |
| K3 | 5.408 × 10⁵ |
| K4 | 0.0036 |
| δ′ | −3.43 |
| K5 | 1630.03 |
| δ′′ | −4.60 |
| K6 | ∼1.0008 |
| δ′′′ | −4.20 |
| Parameters | Value |
|---|---|
| K1 | 1500.75 |
| α | −1.1435 |
| β | −1.734 |
| K2 | 91.38 |
| t0 | −3.59 d |
| δ | 2.41 |
| K3 | 5.408 × 10⁵ |
| K4 | 0.0036 |
| δ′ | −3.43 |
| K5 | 1630.03 |
| δ′′ | −4.60 |
| K6 | ∼1.0008 |
| δ′′′ | −4.20 |
Out of the six frequencies of the data set, only three (8.4, 4.8 and 2.3 GHz) have been used to model the radio data through simultaneous fitting, while for other frequencies (1.28, 0.610 and 0.325 GHz) the expected theoretical light curves have been plotted along with observational data. Our best-fitting model gives the value of overall reduced χ2 = 7.14. This is relatively higher than the value (4.42) mentioned by Weiler et al. (2011) for the well-studied Type Ibc radio SN 1994I. This higher value is presumably a reflection of a lack of data due to less coverage of SN 2007uy in radio band. The lower panel of Fig. 13 presents the temporal evolution of α. The epochs for which we have an observation in a given frequency, the probable flux for other frequencies was determined by interpolation through polynomial fitting of the observed light curve. The thick curve shows that initially the source was extremely optically thick with high positive value of spectral index which turned to a constant negative value ∼−1 asymptotically, that clearly marks the transition from an optically thick to thin state. A lower value (∼2.0) of α than 2.5 in the optically thick regime shows FFA is also responsible for the initial radio flux along with the SSA. Although, the coefficient K6 = 1.00085, which is associated with FFA is also sufficiently less than the coefficient K5 = 1630.031 responsible for SSA, the temporal evolution of both processes are almost similar (δ′′ = −4.602 and δ′′′ = −4.206, respectively). Thus the initial emission is mostly due to SSA in optically thick ejecta, though a mild contribution due to FFA cannot be ruled out. This result is consistent with the conclusion drawn by van der Horst et al. (2011).
The modelling of the three frequencies shows that the radio flux of the source is moderate (K1 = 1500.75) with a temporal decay index (β) roughly = −1.73 while the overall spectral index (α) is ∼− 1.14, comparable with the optically thin condition. It predicts that the object was discovered about (t0) =−3.6 d after the explosion, which is consistent with the optical follow-ups. Following Chevalier (1982a,b), we assume that the temporal decrement (δ) of the opacity of a uniform CSM is roughly dependent on α and β by the relation δ = α − β − 3. A sufficiently lower value of K2 (= 91.38) than K3 (= 5.408 × 10⁵) implies that the absorption processes in CSM are mainly due to its clumpy/structured form than its uniformity. On the other hand a relatively higher value of δ′ (=−3.43) than δ (=−2.41) implies that the effect of clumpiness will not sustain for a longer time in comparison to the absorption due to uniform CSM. So, eventually the CSM starts to behave like a circumburst medium having a statistically small number of clumps. The lower value of the term K4 (=3.6 × 10⁻³) demands that the radio absorption due to FFA in distant H ii regions, which are in between the SN and us is quite low. In fact this is one order less than other events likes SNe 1978K, 1994I and 1998bw, but higher than SN 1993J (Weiler et al. 2002, 2011). This is in contrast with the large extinction towards SN 2007uy, derived from optical data (Section 4).
Since the photospheric velocity and temperature, measured from spectroscopy and photometry at around optical peak are roughly 15 200 km s−1 and 8000 K,11 respectively, then the mass-loss rate should be |$\dot{M} \gtrsim 2.41\times 10^{-7}\ (w_{\rm wind}/10\,{\rm km\,s}^{-1})$| M⊙ yr−1. This value is comparable with the pre-SN mass-loss rate for other Type Ibc events derived from radio data (Weiler et al. 2011). Observations and theoretical studies predict that the progenitors of Type Ibc are WR stars, having extremely high wind velocity ≳ 103 km s−1 (Willis 1996; Yoon et al. 2012). Then the mass-loss rate of the progenitor of SN 2007uy during its WR phase was roughly ≳ 2.41 × 10− 5 M⊙ yr−1. Certainly this result is consistent with other Type Ibc events (Weiler et al. 2011).
CONCLUSIONS
Since the detection of the progenitors of Type Ibc events in pre-SN images is a technically challenging task, rigorous observational follow-up along with theoretical interpretation is necessary to understand these catastrophic explosions in a better way.
In this paper, we have presented an extensive follow-up campaign of a normal Type Ib event SN 2007uy, using the data acquired in a wide range of wavelength – from NUV to radio bands along with optical spectroscopy. The radio modelling predicts that the event was discovered within 4 d after the explosion, while the early spectral features constrain the time difference between explosion and detection within 7 d. We have adopted the former value and assumed that the SN was discovered within 4 d after the explosion. The main results are summarized below.
The extinction (AV = 1.9 ± 0.5 mag) along the line of sight of SN 2007uy is mainly dominated by the host galaxy. The highly inclined host and the presence of numerous Hα emitters along the line of sight make the transient highly extincted.
The evolution of SN 2007uy was like a canonical ‘blackbody supernova’. The UV component is probably not due to shock breakout, rather it is a manifestation of radioactively heated, relatively less massive ejecta. As the ejecta become progressively optically thin, the optical photons start to escape rapidly, causing a steepening in the late time optical light curve.
The spectral evolution of SN 2007uy is faster than other Type Ibc events. Most of the lines get diluted quickly in comparison to other archetypal events. Early evolution of most of the lines is highly aspheric, though their natures are different from each other. This demonstrates that there is no dependency of asphericity on the distribution of radioactive 56Ni inside the ejecta, at least for this particular case. We propose that SN 2007uy is an aspheric explosion, which in due course of time attained a large-scale spherical symmetry.
The nature of colour evolution of SN 2007uy is similar to other stripped-envelope SNe though this transient is intrinsically more bluish than other Type Ibc events. SN 2007uy is one of the luminous Type Ib events in respect to its UVOIR bolometric flux. The peak flux is comparable with the engine-driven SNe 1998bw and 2006aj.
The basic parameters of the explosion have been derived from the optical and radio data modelling. The UVOIR optical data have been modelled assuming the event as a ‘point explosion’ after adopting the formalism of Arnett (1982), along with the modifications introduced by Valenti et al. (2008). Optical modelling predicts that about 4.4 M⊙ was ejected with an explosion energy ∼15 × 1051 erg and roughly 0.3 M⊙ was produced during this explosion. The radio data show an SSA-dominated light-curve evolution of SN 2007uy, though the contribution of FFA during the early phase cannot be ruled out. The line of sight is probably dominated by relatively cool gas and dust making the optical extinction high, but due to lack of free-electron content, absorption of radio waves through FFA is less. It is one order less than that for other radio SNe. The pre-SN mass-loss rate obtained from the radio data is |$\dot{M} \gtrsim 2.03\times 10^{-7}\ (w_{\rm wind}/10\,{\rm km\ s}^{-1})$| M⊙ yr−1. This value is consistent with the results obtained for other Type Ibc radio SNe, though an order of magnitude lower than typical value of mass-loss rate derived from X-ray. Assuming a WR star as a progenitor with wind velocity ≳ 103 km s− 1, we can constrain the lower limit of pre-SN mass-loss rate at |$\dot{M} \gtrsim 2.03\times 10^{-5}$| M⊙ yr−1.
We thank all the observers at ARIES who provided their valuable time and support for the observations of this event. The work is based on observations made with the Nordic Optical Telescope, operated by the Nordic Optical Telescope Scientific Association at the Observatorio del Roque de los Muchachos, La Palma, Spain, of the Instituto de Astrofisica de Canarias. This work is partly based on the data obtained from the ESO Science Archive Facility, and data were collected under ESO programs 080.C-0833 (PI Elias-Rosa), 080.D-0229 (PI Della Valle), 081.D-0173 (PI Mazzali) and 082.D-0292 (PI Mazzali). We are thankful to the observing staffs of NOT, UKIRT, NTT, MMT and VLT for their kind cooperation in observation of SN 2007uy. This work is based on the data obtained from the ESO Science Archive Facility. For this research work the VLA radio data have been used. The VLA is operated by the National Radio Astronomy Observatory, a facility of the National Science Foundation operated under cooperative agreement by Associated Universities, Inc. DARK is funded by the DNRF. GL is supported by the Swedish Research Council through grant No. 623-2011-7117. RR is thankful to the COSPAR fellowship program under which, he got the opportunity to visit DARK and initiated the entire project. SBP and RR acknowledge DST-RFBR grants INT/RFBR/P-25 (2008-2010) and INT/RFBR/P-100 (2011-2013) for the present work. This research has made use of Swift/UVOT data obtained through the High Energy Astrophysics Science Archive Research Center (HEASARC) Online Service, provided by the NASA/Goddard Space Flight Center. The authors would also like to thank the anonymous referee for the comments and suggestions which helped in improvement of the paper.
Royal Society Research Fellow.
The Swift data have had bad pixels identified, mod-8 noise corrected, and have been transformed into FK5 coordinates. We used the standard UVOT data analysis software distributed with heasoft 6.10 along with the standard calibration data. As long as the source had a count rate greater than 0.5 counts s−1, photometry was done using ‘uvotsource’ with a standard circular aperture of radius 5 arcsec and a circular background region with a radius of 15 arcsec. Below this threshold, a 3.5-arcsec radius was used and an aperture correction was applied. The background region was selected to have similar background properties to those at the location of the SN, and to be free of contaminating sources.
A 2048 × 2048 CCD camera having 24 × 24 μm chip size and with a plate scale 0.38 arcsec pixel−1, mounted at the f/13 Cassegrain focus of the telescope was used for observation. The gain and readout noise of the CCD camera are 10 electrons per analog-to-digital unit and 5.3 electrons, respectively. To improve the signal-to-noise ratio, we performed the observations in a binned mode of 2 × 2 pixel.
iraf stands for Image Reduction and Analysis Facility distributed by the National Optical Astronomy Observatories which is operated by the Association of Universities for research in Astronomy, Inc., under cooperative agreement with the National Science Foundation.
daophot stands for Dominion Astrophysical Observatory Photometry.
Astronomical Image Processing System (AIPS) has been developed by the National Radio Astronomical Observatories (NRAO), USA
The cosmological model with H0 = 70 km s−1 Mpc−1, Ωm = 0.3 and ΩΛ = 0.7 is assumed throughout the paper and the uncertainty corresponds to a local cosmic thermal velocity of 208 km s−1 (Terry, Paturel & Ekholm 2002).
This is important to mention that Thöne et al. (2009) did not calculate the E(B − V) exactly at SN position, rather at the locations which are roughly ±2.5 arcsec separations from SN position. This corresponds to more than 350pc in physical size.
It is worth noting that the measurement of the true temperature of the SN envelope along with the measurement of its distance require a proper estimation of dilution factor through hydrodynamical modelling (Kirshner & Kwan 1974; Eastman, Schmidt & Kirshner 1996). This can only provide a colour temperature for the system along with a true estimation of distance independent of cosmology. The technique was properly applied by Hamuy et al. (2001) and Leonard et al. (2002) and others for Type IIP events. In the present work we provide a rough estimate of the overall temperature of the SN photosphere and adopted the value of distance obtained above (Section 4).
This is important to mention that this is the colour temperature of the photosphere and hence does not correspond to the electron temperature of the source but provides an approximate estimation of the source temperature.
