


Abstract
To determine whether the location of aortic valve calcium (AVC) influences the location of paravalvular regurgitation (PR). PR is an adverse effect of transcatheter aortic valve implantation (TAVI) with a negative effect on long-term patient survival. The relationship between AVC and the occurrence of PR has been documented. However, the relationship between the distribution of AVC and the location of PR is still sparsely studied. The purpose of this study was to correlate severity and location of AVC with PR in patients treated with TAVI.
Fifty-six consecutive patients who underwent transaortic or transapical TAVI and had preoperative computed tomography scans were included in this retrospective study. The volume, mass and location of AVC was determined and compared between patients with and without PR using a non-parametric t-test. Postoperative echocardiography was performed to determine the presence and location of PR, which was associated with the cusp with highest AVC using a χ2 test.
Valve deployment was successful in all 56 patients. PR was present in 38 patients (68%) after TAVI. There was a non-significantly higher volume of AVC in the PR group [214 (70–418) vs 371 (254–606) cm3, P = 0.15]. AVC mass was significantly higher in patients with PR than in patients without PR [282 (188–421) vs 142 (48–259) mg, respectively, P = 0.043]. The location of PR was determined in 36 of these patients. Of these 36 patients, PR occurred at the cusp with the highest AVC in 20 patients (56%, χ2P = 0.030).
In our population, PR was associated with greater AVC mass. Moreover, the location of PR was associated with the cusp with the highest amount of AVC.
INTRODUCTION
Transcatheter aortic valve implantation (TAVI) is a new standard of care for patients who suffer from symptomatic aortic disease with a high perioperative mortality risk or those with contraindications for conventional surgery [1–3]. Treatment of aortic stenosis (AS) with TAVI improves patients' clinical outcome and has a beneficial effect on their quality of life [4, 5]. Although TAVI is becoming an increasingly appealing option for this selected patient group (especially in countries with ageing populations), concerns remain with respect to vascular injury, stroke, valve durability and paravalvular regurgitation (PR).
The sutureless nature of this procedure causes the native aortic valve to be pressed against the aortic wall and can therefore result in PR [6]. Residual moderate-to-severe PR has a negative effect on long-term patient survival with increasing evidence that the severity of PR is associated with increased mortality and morbidity [2]. Large amounts of aortic valve calcium (AVC) are known to contribute to an increased incidence and severity of PR [7–10]. However, the direct spatial relation of the location of AVC with the location of PR remains inadequately characterized. Such knowledge could be useful in predicting postoperative haemodynamic and clinical outcomes for patients undergoing TAVI.
This study aimed to investigate whether PR is more common at specific sites in the aortic valve where high amounts of AVC are found. Furthermore, we hypothesize that an association exists between the amount of calcium and degree of regurgitation in a population treated with transaortic (TAo-AVI) and transapical aortic valve implantation (TA-AVI).
METHODS
Patient selection
Retrospectively, the first 56 consecutive patients who underwent TAo-AVI (n = 15) or TA-AVI (n = 41) at our institution and had preoperative computed tomography angiographic (CTA) scans were included. A multidisciplinary heart team, comprising cardiac surgeons and cardiologists, determined whether patients with severe AS were eligible for surgery or TAVI. Multimodality imaging consisting of CTA imaging and angiography was performed to assess anatomical suitability for TAVI and to determine the access strategy. Preoperative work-up was done according to the institutional protocol and consisted of clinical and laboratory examination, electrocardiogram, spirometry, echocardiography, coronary angiography and a CTA scan.
Echocardiography
Transthoracic echocardiography was performed on all patients preoperatively to examine the severity of AS, valve morphology and left ventricular (LV) function. Preoperative echocardiography was performed using a commercially available ultrasound system (Vivid 7, GE Healthcare, Cleveland, OH, USA). The assessment consisted of a complete two-dimensional, colour, pulsed- and continuous-wave Doppler echocardiographic examination. The LV end-diastolic volume and end-systolic volume were both measured and indexed to the patients' body surface area. The LV ejection fraction was derived using the biplane Simpson method. Ventricular function was categorized according to these values: an ejection fraction higher than 50% was categorized as ‘good’, values between 30 and 50% were ‘moderate’ and all values below 30% were ‘poor’. The parasternal short-axis view was used to evaluate valve morphology and to calculate the aortic valve area (using the continuity equation). Next, the maximum and mean aortic valve pressure gradients were calculated. Colour Doppler was used to determine the presence and severity of aortic regurgitation (AR). All parameters were classified according to the European Society of Cardiology (ESC)/European Association for Cardio-Thoracic Surgery (EACTS) guidelines from 2012 [11].
Computed tomography angiography
Preoperative CTA imaging was performed using a 64-slice scanner (Brilliance 64, Philips Healthcare, Best, Netherlands). CTA scans were made using a Philips Brilliance 64-slice CTA scanner; retrospective gating was applied and the scan parameters were: 120 kV, matrix 512, convolution kernel B. A first-pass arterial CTA scan of the chest, abdomen and pelvis was acquired after intravenous injection of 120 ml of contrast bolus (Iomeron 400) at an injection rate of 5 ml/s.
Surgical procedure
A team of cardiothoracic surgeons, interventional cardiologists and anaesthesiologists performed the procedures. Patients were placed under general anaesthesia and intubated. Cardiac function was monitored during the procedure using electrocardiography and transoesophageal echocardiography (TOE). TEE was also used to determine the correct valve prosthesis size, position and function of the bioprosthesis
For the TA-AVI, valve implantation was performed through the apex. The TAo-AVI was performed in a retrograde fashion through the ascending aorta. All patients received an Edwards SAPIEN prosthetic valve (Edwards Lifesciences, Inc., Irvine, CA, USA), which was available in three sizes: 23, 26 and 29 mm. After successful deployment, the prosthetic valve position and function were confirmed using fluoroscopy and TOE. Redilatation was performed in case the prosthesis was underdeployed or when moderate or severe PR was present. If correct valve deployment was determined, the aorta or apex and chest wall were securely closed.
Aortic valve calcium scoring
Diastolic CTA images at 75% of the heart cycle were used to assess AVC. AVC was quantified based on the approach of Agatston et al. [12]. Additionally, we quantified the AVC mass in milligrams (mg) and volume in cubic millimetres (cm3) using 3mensio Valves (3mensio Medical Imaging BV, Bilthoven, Netherlands). The area of interest consisted of the LV outflow tract (LVOT), aortic annulus, valvular cusps and the adjacent aortic walls up to the ostia of the coronary arteries (Fig. 1). First, a three-dimensional reconstruction of the aortic valve was created along with three multiplanar reformation planes. Using these images, a centre line was placed across the valve (in the frontal plane) from the LVOT into the ascending aorta. Two perpendicular lines, one in the frontal plane and another in the sagittal plane, were placed across the aortic cusp. If needed, these lines were manually corrected to improve accuracy. The software subsequently created an image of the aortic valve in the transverse short-axis view, enabling the user to adjust the area being measured (Fig. 2). Once this area was selected, the user selected the desired area in the frontal plane, which ranged from the LVOT to the level below the coronary ostia. Once the desired area was determined, the software quantified the amount of calcium in mm3 and mg. The software also provided visualization of the distribution of AVC (Fig. 3). A table was created listing the amount of AVC in the entire valve as well as according to each cusp, allowing the identification of the cusp with the largest amount of calcification.
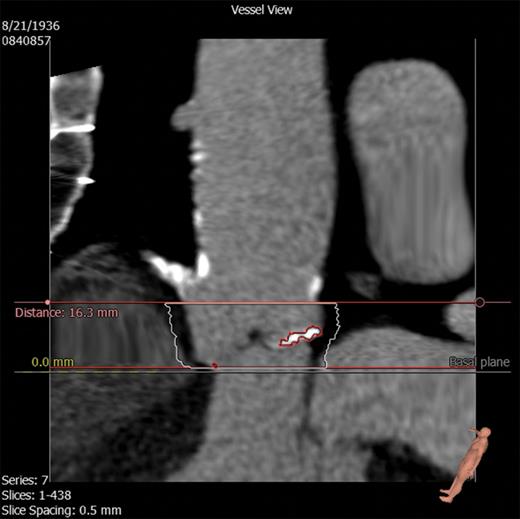
Stretched vessel view on the 3mensio Valves software showing the LV outflow tract, aortic valve, coronary arteries and ascending aorta. Superior and inferior borders of calcium measurement have been selected. Calcification is seen as highlighted.
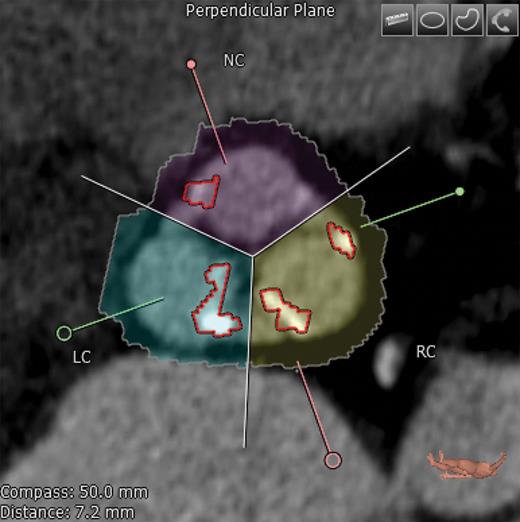
Transverse axis view showing the native aortic valve and cusps. Correct commissure locations have been determined and calcium deposition is shown highlighted here. NC: non-coronary; RC: right coronary; LC: left coronary.
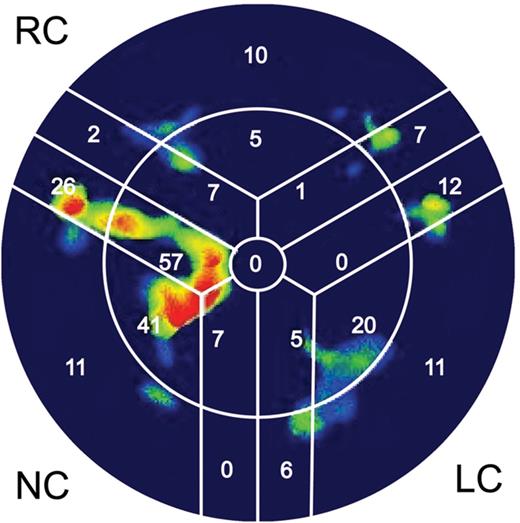
The ‘bull's eye’ representation, which schematically summarizes the amount of calcium deposition in corresponding cusps. Red and yellow colours represent large amounts of calcium. In dark areas, no calcium was detected. NC: non-coronary; RC: right coronary; LC: left coronary.
Analysis of paravalvular regurgitation
In all patients, an echocardiographic examination was performed 3–5 days after TAVI to evaluate prosthesis function. The same examination was performed as before TAVI, again using the ESC guidelines. The short axis was used to determine the presence and severity of PR. The location of PR was classified according to the cusp along which it was present. PR severity was determined using the jet area–LVOT area ratio. Severity was classified using the same method as Perry et al. [13] A jet area–LVOT area ratio under 24% was considered mild regurgitation, 24–59% was considered moderate and an area of >60% was indicative of severe regurgitation. The postoperative echocardiographic examination and the calcium scoring analysis were blindly performed by two separate investigators.
Statistical analysis
Continuous variables are listed as median (and interquartiles). Patients were dichotomized into groups according to the presence or absence of PR and also according to the procedure type. Variables were compared between these groups using the non-parametric t-test for continuous data and the χ2 test for categorical data. Using cross-tabulation, we recorded how often each individual cusp was the most calcified and compared this with the occurrence of PR along each individual cusp. A χ2 test was performed to calculate whether there was a statistically significant difference. Variables with P-values of <0.05 were considered statistically significant. All analyses were performed using IBM SPSS Statistical Software Package, version 20 (IBM, Chicago, IL, USA)
RESULTS
Table 1 summarizes the baseline characteristics of all patients. Valve deployment was successful in all 56 patients. TA-AVI was performed in 41 patients and TAo-AVI was performed in the remaining 15 patients. A 23-mm valve was implanted in 18 (32%) patients, 34 (61%) received a 26-mm valve and 4 (7%) received a 29-mm valve.
Baseline characteristics
| Variable | All (n = 56) | No paravalvular regurgitation (n = 18) | Paravalvular regurgitation (n = 38) | P-value |
|---|---|---|---|---|
| Male | 23 (41%) | 4 (22%) | 19 (50%) | 0.039 |
| Age, years | 79 (76–84) | 77 (73–80) | 81 (77–84) | 0.043 |
| EuroSCORE | 5.48 (3.34–8.45) | 7.70 (3.08–12.10) | 5.22 (3.41–7.91) | 0.39 |
| NYHA | ||||
| I | 3 (6%) | 1 (6%) | 2 (6%) | 0.98 |
| II | 19 (35%) | 7 (39%) | 12 (33%) | |
| III | 26 (48%) | 8 (44%) | 18 (50%) | |
| IV | 6 (11%) | 2 (11%) | 4 (11%) | |
| Hypertension | 47 (84%) | 17 (94%) | 30 (79%) | 0.081 |
| Hypercholesterolaemia | 32 (57%) | 12 (67%) | 20 (53%) | 0.33 |
| Diabetes mellitus | 18 (32%) | 6 (33%) | 12 (32%) | 0.90 |
| Chronic obstructive pulmonary disease | 27 (48%) | 8 (44%) | 19 (50%) | 0.71 |
| Peripheral vascular disease | 31 (55%) | 12 (67%) | 19 (50%) | 0.25 |
| Previous myocardial infarction | 11 (20%) | 7 (39%) | 4 (11%) | 0.037 |
| Previous cardiac surgery | 14 (25%) | 4 (22%) | 10 (26%) | 0.74 |
| Creatinine, µmol/l | 83 (65–109) | 77 (65–130) | 86 (65–107) | 0.77 |
| Aortic regurgitation | 47 (84%) | 15 (83%) | 32 (84%) | 0.93 |
| Aortic valve area, cm2 | 0.78 (0.65–0.92) | 0.79 (0.64–0.95) | 0.74 (0.65–0.90) | 0.85 |
| Maximum transaortic gradient, mmHg | 65 (52–79) | 62 (49–78) | 68 (55–85) | 0.92 |
| Mean transaortic gradient, mmHg | 43 (32–51) | 42 (30–52) | 43 (34–52) | 0.77 |
| Moderate or poor left ventricular function | 17 (30%) | 6 (33%) | 11 (29%) | 0.74 |
| Moderate or poor right ventricular function | 9 (16%) | 2 (11%) | 7 (18%) | 0.49 |
| Pulmonary hypertension | 3 (5%) | 1 (6%) | 1 (6%) | 0.96 |
| Mitral regurgitation | 0.22 | |||
| None | 6 (11%) | 3 (17%) | 3 (8%) | |
| Mild | 25 (36%) | 10 (56%) | 15 (42%) | |
| Moderate | 19 (35%) | 3 (17%) | 16 (44%) | |
| Severe | 4 (7%) | 2 (11%) | 2 (6%) | |
| Tricuspid regurgitation | 0.37 | |||
| None | 6 (11%) | 2 (11%) | 4 (11%) | |
| Mild | 30 (56%) | 12 (67%) | 18 (50%) | |
| Moderate | 13 (24%) | 4 (22%) | 9 (24%) | |
| Severe | 5 (9%) | 0 (0%) | 5 (15%) | |
The incidence of PR was significantly higher in males. The median age in the PR group was significantly higher. Patients with a history of myocardial infarction and hypertension were more common in the group without PR. The incidence of PR was significantly higher in the group of patients who underwent TA-AVI versus TAo-AVI (76 and 47%, respectively, P = 0.04).
A total of 38 patients (68%) showed PR after TAVI. Mild PR was observed in 29 (52%) patients and moderate PR was seen in the remaining 9 (16%) patients. Patients with PR had a significantly greater AVC mass [282 (188–421) vs 142 (48–259) mg, P = 0.043, Table 2] and non-significantly greater AVC volume [214 (70–418) vs 371 (254–606) cm3, P = 0.15, Table 2]. Patients with moderate PR did not have higher levels of AVC than those with mild PR (Table 3).
AVC measurements
| Variable | All (n = 56) | No paravalvular regurgitation (n = 18) | Paravalvular regurgitation (n = 38) | P-value |
|---|---|---|---|---|
| Total calcium volume, mm3 | 309 (208–545) | 214 (70–418) | 371 (254–606) | 0.15 |
| LCC calcium volume, mm3 | 110 (44–160) | 98 (14–152) | 122 (61–186) | 0.77 |
| RCC calcium volume, mm3 | 70 (31–158) | 46 (7–91) | 86 (33–199) | 0.39 |
| NCC calcium volume, mm3 | 129 (46–220) | 51 (14–153) | 163 (99–220) | 0.043 |
| Total mass, mg | 281.57 (139–400) | 142 (48–259) | 282 (188–421) | 0.043 |
| LCC mass, mg | 81.91 (31–117) | 67 (10–105) | 76 (46–143) | 0.77 |
| RCC mass, mg | 74.02 (21–98) | 33 (4–62) | 61 (25–142) | 0.39 |
| NCC mass, mg | 112.05 (33–159) | 42 (10–102) | 113 (71–169) | 0.009 |
AVC: aortic valve calcium; LCC: left coronary cusp; RCC: right coronary cusp; NCC: non-coronary cusp.
Severity of PR and AVC levels
| PR | None | Mild | Moderate |
|---|---|---|---|
| Average calcium volume, mm3 (interquartiles) | 214 (70–418) | 375 (260–614) | 350 (249–602) |
| PR | None | Mild | Moderate |
|---|---|---|---|
| Average calcium volume, mm3 (interquartiles) | 214 (70–418) | 375 (260–614) | 350 (249–602) |
PR: paravalvular regurgitation; AVC: aortic valve calcium.
In 2 patients, PR location could not be determined because there were no useful short-axis images available; they were therefore excluded from further analysis (n = 36). PR was seen along the left coronary cusp (LCC) in 13 cases, the right coronary cusp (RCC) in 12 cases and the non-coronary cusp (NCC) in 11 cases. In our population, the NCC had the highest level of AVC in 17 patients, followed by the LCC (11 patients) and the RCC (8 patients). In 20 of 36 patients (56%), the location of PR corresponded with the most calcified cusp (Table 4, χ2P = 0.030).
Location of PR versus AVC distribution
| Cusp with highest AVC | Location of paravalvular regurgitation | |||
|---|---|---|---|---|
| Non-coronary cusp | Left coronary cusp | Right coronary cusp | Total | |
| Non-coronary cusp | 8 | 6 | 3 | 17 |
| Left coronary cusp | 2 | 6 | 3 | 11 |
| Right coronary cusp | 1 | 1 | 6 | 8 |
| Total | 11 | 13 | 12 | 36 |
DISCUSSION
We studied the association of AVC on the location and severity of PR after TAVI. Our results showed that patients with PR had a higher mass of AVC than those without PR. However, moderate PR was not associated with more AVC than mild PR. In the majority of patients with PR, the location corresponded with the cusp with the largest amount of AVC.
The incidence of PR in our study was comparable to rates seen in several other studies involving different approaches [2, 6, 8, 14]. Moreover, the distribution of PR severity in this study was also comparable to other studies [6, 8, 14]. Controversially, recent large-scale studies by Staubach et al. [15] and Abdel-Wahab et al. [16] showed no evidence of a relationship between calcium volume and PR. A possible reason for this disparity between the results in these studies and our own could be that, in both studies, the degree of AVC was visually estimated; neither study performed quantitative AVC measurement. This may have resulted in underestimation of AVC in certain patients, which could have influenced their results.
Transfemoral access is commonly the preferred access for patients eligible for TAVI. The percentage of patients being treated in our series only represent those treated by a surgical department, and therefore differ from a general TAVI population in which the majority of patients are treated by interventional cardiologists using the transfemoral approach. TAo-AVI or TA-AVI is usually seen as the alternative if the femoral arteries are affected by severe atherosclerosis. Given the advanced arteriosclerosis in this population, a higher incidence of PR than in patients treated with TF-AVI would have been likely. However, the severity of these patients' peripheral arterial disease was apparently not indicative of the severity of their aortic valve disease.
In our population, AVC levels were higher in patients with PR, which was in accordance with previous studies [7, 17]. However, contrary to the current literature, we found no relationship between the level of AVC and PR severity. Haensig et al. [8] reported significantly higher levels in patients with moderate versus mild PR. Several other studies have also correlated AVC with PR severity [7, 9, 10, 14].
In our study, TA-AVI was associated with a higher incidence of PR than TAo-AVI, a finding that has not yet been reported elsewhere. This could possibly be a result of TAo-AVI itself. A different explanation could be that surgeons at the academic medical centre (AMC) were more experienced with transcatheter valve replacements when the TAo-AVI was introduced. TA-AVI was introduced at the AMC a few years before TAo-AVI. This difference in experience may have contributed to better valve placement among the TAo-AVI patients, resulting in less PR.
Patients with a history of myocardial infarction had an inverse relationship with the incidence of PR. Until now, this finding has not been reported elsewhere. We checked whether this could be caused by a difference in AVC levels between patients with and without a history of myocardial infarction. However, we found no significant difference between these two groups (non-parametric t-test, P = 1.00). This difference could be explained by a lower pressure gradient due to decreased myocardial function (caused by coronary artery disease), which in turn could facilitate PR as the pressure in the LV would be decreased. However, the validation of this speculation was beyond the scope of this study.
Male sex was also identified as a risk factor for PR, which was also reported by Unbehaun et al. [18] Gender is known to influence pathophysiology of several cardiovascular diseases [19–22]. It has been reported that women are more symptomatic than males at lower AVC levels [23]. However, in our population, there was no significant difference between AVC according to gender (non-parametric t-test, P = 0.26). Another possible explanation may be prosthesis ‘undersizing’, which is more common in tall males, since the 29-mm valve is the largest available size [18]. All 4 patients who received the 29-mm valve in our population did, in fact, develop PR after surgery. Recently, a 31-mm valve has been introduced to address this problem [24].
Our findings suggest that AVC not only influences the occurrence of PR, but also determines its location. In similar studies, Wendt et al. [25] and Ewe et al. [7] also found a significant relationship between AVC and PR location. We therefore believe that the location of AVC does indeed determine the location of PR.
This study has a number of limitations. First, the population is rather small. Nevertheless, some statistically significant findings were observed in this population. Secondly, it is difficult to compare the lack of a reference standard for calcium measurement with other studies. However, the 3mensio software allows a quantification of calcium volume and mass including a sub-classification per cusp, and we believe that such measurement has an added value. Thirdly, this study did not consider annular or subvalvular calcification, which may play a role in the positioning of the prosthesis. We could not address the accuracy of the calcium quantification because of the lack of a reference standard. Histological examination was not possible since the native valves were in place. Nowadays, CT-based calcium quantification is generally accepted and the influence of interpretation of the software was reduced as much as possible by double inspection by two observers. Fourthly, despite recent improvements in both the hardware and software, echocardiographic measurement of AR largely remains qualitative in nature and therefore PR assessed as mild could be underestimated compared with quantitative cardiovascular magnetic resonance or angiography.
Since PR has shown to have a significant impact on patient outcome, we believe it is essential that physicians understand the pathophysiology of this finding. The relationship between AVC and PR plays an important role in this process. Knowing which patients have an increased risk of developing PR can help us adapt our treatment to minimize this risk and improve patient outcome. This is especially important as more patients may be eligible for TAVI in the future. Increasing knowledge and experience with this procedure could lead to this change. Furthermore, improvements to transcatheter valves may improve outcomes (such as the SAPIEN 3 which is specifically designed to reduce PR). Although TAVI indications are likely to grow in the future, it is critical to have a multidisciplinary approach to patients with symptomatic aortic valve disease to select the best available option for each individual patient.
CONCLUSION
According to our results, AVC influences the occurrence and the location of PR after TAVI. AVC levels can be considered before TAVI to assess the risk of postoperative PR. This knowledge can help choose the best implantation method or prosthesis type to minimize the risk of PR.
Funding
This work was supported by the Academic Medical Centre. Part of this research was funded by STW under Project 60032.
Conflict of interest: Riccardo Cocchieri and Jan Baan have done consulting for Edwards Lifesciences.
ACKNOWLEDGEMENTS
We thank 3mensio for freely providing the software for research purposes.
