


Abstract
Chromosome 5q22–33 is a region where studies have repeatedly found evidence for linkage to schizophrenia. In this report, we took a stepwise approach to systematically map this region in the Irish Study of High Density Schizophrenia Families (ISHDSF, 267 families, 1337 subjects) sample. We typed 289 SNPs in the critical interval of 8 million basepairs and found a 758 kb interval coding for the SPEC2/PDZ-GEF2/ACSL6 genes to be associated with the disease. Using sex and genotype-conditioned transmission disequilibrium test analyses, we found that 19 of the 24 typed markers were associated with the disease and the associations were sex-specific. We replicated these findings with an Irish case–control sample (657 cases and 414 controls), an Irish parent–proband trio sample (187 families, 564 subjects), a German nuclear family sample (211 families, 751 subjects) and a Pittsburgh nuclear family sample (247 families, 729 subjects). In all four samples, we replicated the sex-specific associations at the levels of both individual markers and haplotypes using sex- and genotype-conditioned analyses. Three risk haplotypes were identified in the five samples, and each haplotype was found in at least two samples. Consistent with the discovery of multiple estrogen-response elements in this region, our data showed that the impact of these haplotypes on risk for schizophrenia differed in males and females. From these data, we concluded that haplotypes underlying the SPEC2/PDZ-GEF2/ACSL6 region are associated with schizophrenia. However, due to the extended high LD in this region, we were unable to distinguish whether the association signals came from one or more of these genes.
INTRODUCTION
Schizophrenia is a complex disorder that affects the lives of millions of people. Since the establishment of familial factors in the etiology of the disease, decades had gone by without the identification of specific genes that predispose to this illness. More recently, many genome-wide linkage scans had been performed with subjects from different ethnic groups, and collectively, several chromosomal regions had been implicated in harboring genes involved in schizophrenia. In the last few years, candidate genes in some of these chromosomal regions have been identified (1–5).
Chromosome 5q22–33 is one of the regions likely to contain risk genes for schizophrenia. Early cytogenetic studies suggested that chromosome 5 was involved in the disease (6,7). In 1997, Straub et al. (8) and Schwab et al. (9) reported separately linkage peak in the 5q22–31 region. Following up on these findings, several other linkage studies showed peaks in the 5q region (10–14). These linkage peaks were broadly distributed over a region from 5q21 to 5q34, covering about 80 million basepairs (mb) genomic distance. The linkage peak from the Irish Study of High Density Schizophrenia Families (ISHDSF) centered around markers D5S642–D5S2120, overlapping substantially with the signal from the German sib-pair sample (9). The ISHDSF linkage signals, however, seemed centromeric to other linkage findings, suggesting that there might be multiple susceptibility genes in the broad 5q linkage region. In a meta-analysis of most major linkage studies performed up to that time, the 5q21–31 region, which coincides the ISHDSF linkage peak, was ranked number 2 of all chromosomal regions implicated to harbor susceptibility genes for schizophrenia (15). Except a few selected candidate genes (16,17), systematic mapping of schizophrenia genes in this region has not to date been reported.
We started to systematically fine map this region in the ISHDSF in 2002. We took a stepwise approach and divided the ISHDSF sample into two mutually exclusive subsamples (which we term the screening and replication subsamples) based on the family NPL scores. The screening subsample, which consisted of 61 families with NPL score ≥1.4, was used for systematic screening to generate promising leads. For those regions where consistent associations were observed in the screening sample, the replication subsample would be genotyped to verify the association. When corroboratory results were obtained from these two subsamples, we sought to replicate these results with independent samples from several sources. Figure 1 illustrates our stepwise study design. In this report, we outline the results of this effort that has led to the identification of a 758 kb fragment in 5q23 showing significant association with schizophrenia in the five samples used in this study. This fragment encodes the non-kinase CDC42 effecter protein (SPEC2) gene, the PDZ-domain containing guanine exchange factor I (PDZ-GEF2) gene and the acyl CoA synthetase long chain member 6 (ACSL6) gene. These genes share high linkage disequilibrium (LD) and overlapping risk haplotypes. Owing to the limitation of LD mapping, we were unable to distinguish whether one or all of the genes are associated with schizophrenia.
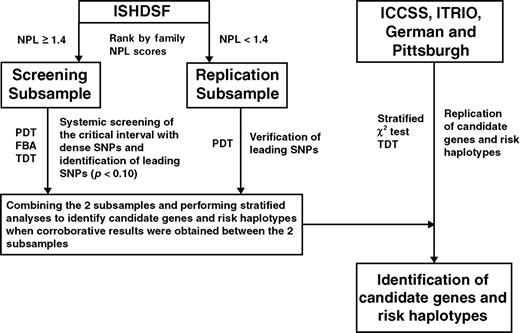
A flow chart illustrating the study design. NPL, non-parametric linkage; PDT, pedigree disequilibrium test; FBAT, family-based association test; TDT, transmission disequilibrium test.
RESULTS
The identification of association in the SPEC2/PDZ-GEF2/ACSL6 region in the ISHDSF sample
In our systematic fine-mapping of the linkage region, we used bootstrap technique to define the critical region most likely to harbor risk genes in the ISHDSF sample. This bootstrap experiment suggested an 8 mb region defined by markers D5S2059 and D5S2053 (Figure 2A). In this 8 mb region, we typed 289 SNPs in the screening subsample, with a density of ~28 kb per marker. The largest remaining gap was 434 kb, located at position 126.1 mb. There were five additional gaps larger than 200 kb sporadically distributed throughout this region (Fig. 2B). An examination of the P-values obtained from the ISHDSF screening subsample (Supplementary Material, Table S1) showed several regions of interest. By chromosomal position, these were at 124.9, 125.2, 126.7 mb (the MEGF10 gene) and a broad location from 130.5 to 131.5 mb. Except the 130.5–131.5 mb region, we found no further evidence for association when we followed up those markers with P-value ≤0.1 in the ISHDSF replication subsample.
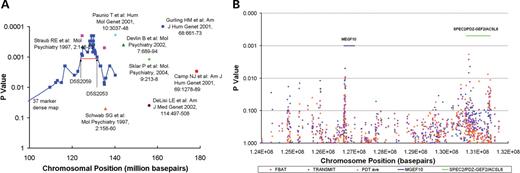
Fine mapping of the 5q linkage peak in the ISHDSF sample. (A) Pairwise NPL P-values of the 37 dense markers covering the linkage peak and their relative position to other linkage peaks reported in the 5q region. Simulated confidence interval as marked by D5S2059 and D5S2053 was outlined. (B) Systematic mapping of the confidence interval using the screen subsample. P-values obtained with the narrow diagnosis for SNPs typed in the screen subsample were plotted. The plot showed the distribution of typed SNPs and the locations of the MEGF10 and SPEC2/PDZ-GEF2/ACSL6 genes.
The interval between 130.5 and 131.5 mb contains the histidine triad nucleotide binding protein 1 (HINT1), SPEC2, PDZ-GEF2, ACSL6 and the interleukin 3 (IL3) genes. Of these 5 genes, HINT1 was previously implicated in the etiology of schizophrenia by microarray studies (18). In the screening subsample, we observed several markers with P-values≤0.05 in the vicinity of HINT1. Multi-marker analyses indicated only marginal significance. For the region covering the SPEC2, PDZ-GEF2 and ACSL6 genes, we typed a total of 80 SNPs in the screening subsample with which we performed single marker analyses for all three disease definitions. We then performed 3-marker sliding window and multi-marker haplotype analyses to identify significant intervals. In multi-marker haplotype analyses, many multi-marker combinations were significant, the most significant combination was 4-5-6-9, with a global P-value of 0.00040 (Table 1). In this combination, the most significant haplotype, 1-1-1-1, which was undertransmitted to the affected subjects, was haplotype A, as shown in Figure 3. The overtransmitted haplotype, 2-1-1-1, was haplotype C, as shown in Figure 3. Table 1 listed two more combinations (13-14-15-16 and 16-17-19), where there were two overtransmitted haplotypes, corresponding to haplotypes C and D in Figure 3. Further analyses revealed that haplotypes C and D both extended from marker 4 to marker 18. For example, in an 8-marker combination (4-5-6-9-14-15-16-18), the two haplotypes, 2-1-1-1-1-2-1-1 (haplotype C) and 2-2-2-2-2-1-2-2 (haplotype D), gave P-values of 0.009898 and 0.02485, respectively, for the narrow diagnosis. The global tests of this 8-maker combination were significant for all three diagnoses (P=0.000814, 0.001163 and 0.002043 for the narrow, intermediate and broad diagnoses, respectively) (data not shown).
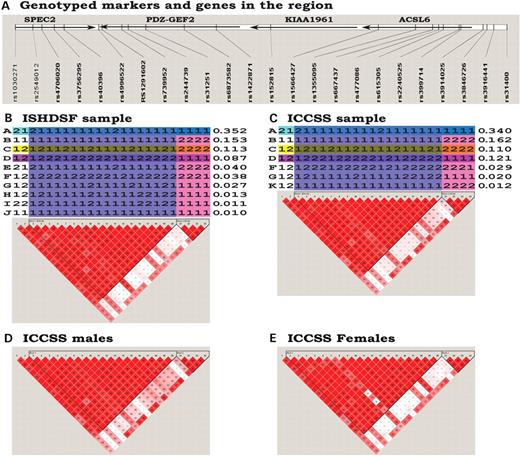
LD and haplotype structure of the SPEC2/PDZ-GEF2/ACSL6 region. (A) Genotyped markers and genes in the region. The arrows illustrated the transcription direction of the genes. KIAA1961 is a hypothetical protein. (B) Haplotype and pairwise LD of the ISHDSF sample. Long-range haplotypes were constructed by the MERLIN and FUGUE programs. Haplotypes were illustrated by the major (1) and minor (2) alleles. Haplotypes were partitioned into LD blocks (colored) by the algorithm reported by Gabriel et al. Each haplotype was labeled by a letter on the left and its frequency was listed on the right. The three highlighted haplotypes, A, C and D, were identified as potential protective and risk haplotypes in this study. The pairwise LD was estimated by the HAPLOVIEW program. (C) Haplotype and pairwise LD of the ICCSS sample. Labels and highlights were the same as in (B). Both the haplotypes and pairwise LD resembled that of the ISHDSF sample. (D) Pairwise LD of the male subjects from the ICCSS sample. (E) Pairwise LD of the female subjects from the ICCSS sample.
PDT haplotype analyses of the ISHDSF
| Marker combination | Global P-value (df) | Haplotype | Trasmitted (V+Ha) | Untrasmitted (V+Ha) | Haplotype P-value | Haplotype frequency |
|---|---|---|---|---|---|---|
| Screen subsamples | ||||||
| 4-5-6-9 | 0.00040 (4) | 1-1-1-1 | 29+175 | 41+206 | 0.00049 | 0.703 |
| 2-1-1-1 | 14+72 | 11+50 | 0.00468 | 0.218 | ||
| 13-14-15-16 | 0.03687 (6) | 2-1-1-1 | 20+130 | 27+147 | 0.00998 | 0.453 |
| 1-1-2-1 | 19+60 | 15+50 | 0.09798 | 0.122 | ||
| 1-2-1-2 | 16+37 | 10+29 | 0.04162 | 0.102 | ||
| 16-17-19 | 0.00254 (3) | 1-1-1 | 30+183 | 38+211 | 0.00290 | 0.654 |
| 1-1-2 | 19+83 | 15+63 | 0.00907 | 0.228 | ||
| Replication subsamples | ||||||
| 4-5-6-9 | 0.15170 (4) | 1-1-1-1 | 52+323 | 51+332 | 0.09353 | 0.685 |
| 2-1-1-1 | 15+108 | 17+108 | 0.81390 | 0.248 | ||
| 13-14-15-16 | 0.06692 (5) | 2-1-1-1 | 40+154 | 41+173 | 0.39980 | 0.441 |
| 1-1-2-1 | 15+50 | 15+45 | 0.54780 | 0.115 | ||
| 1-2-1-2 | 16+54 | 11+36 | 0.00725 | 0.120 | ||
| 16-17-19 | 0.02748 (3) | 1-1-1 | 55+335 | 59+350 | 0.01926 | 0.691 |
| 1-1-2 | 19+130 | 17+115 | 0.03841 | 0.224 | ||
aThe counts for vertical and horizontal transmission in the PDT statistics.
From the multi-marker analyses of the screening subsample, we selected 24 markers for replication in the replication subsample on the basis of the individual marker's significance and its contribution to significant multi-marker haplotypes. Although no marker reached significance in the replication subsample when analyzed with the narrow definition (Table 2), multiple markers reached nominal significance when analyzed with both the intermediate and broad definitions (data not shown). In haplotype analyses, when only the narrow definition was considered, combination 16-17-19 was nominally significant and combinations 4-5-6-9 and 13-14-15-16 showed a trend (see Table 1). When the intermediate and broad disease definitions were considered, combinations 4-5-6-9 and 13-14-15-16 became much more significant. For instance, the global P-values for the intermediate and broad definitions were 0.00126 and 0.00064, respectively, for combination 13-14-15-16. The P-values for haplotype D in Figure 3 or 1-2-1-2 were also more significant (P=0.00016 and 0.00019 for the intermediate and broad definitions, respectively) (data not shown).
Marker information and single marker association in the ISHDSF
| Marker Name | Marker ID | Chromosomal position | Gene | Polymorphism (minor allele) | Screen subsample | Replication subsample |
|---|---|---|---|---|---|---|
| P-value | P-value | |||||
| rs1030271 | 1 | 130708870 | SPEC2 | C/G (C) | 0.0817 | 0.3077 |
| rs2549012 | 2 | 130735973 | SPEC2 | T/G (G) | 0.0526 | 0.3574 |
| rs4706020 | 3 | 130750292 | SPEC2 | A/G (A) | 0.0697 | 0.1859 |
| rs3756295 | 4 | 130769055 | SPEC2 | C/G (G) | 0.0018 | 0.6004 |
| rs40396 | 5 | 130784259 | SPEC2 | G/C (G) | 0.2114 | 0.3393 |
| rs4996522 | 6 | 130837685 | PDZ-GEF2 | G/A (A) | 0.2624 | 0.4564 |
| rs1291602 | 7 | 130842877 | PDZ-GEF2 | G/A (A) | 0.0476 | 0.2201 |
| rs739952 | 8 | 130872784 | PDZ-GEF2 | A/T (T) | 0.4885 | 0.3416 |
| rs244739 | 9 | 130883089 | PDZ-GEF2 | C/A (C) | 0.4570 | 0.2606 |
| rs31251 | 10 | 130910162 | PDZ-GEF2 | A/G (G) | 0.0195 | 0.3596 |
| rs6873582 | 11 | 130968956 | PDZ-GEF2 | A/G (A) | 0.5031 | 0.4988 |
| rs1422871 | 12 | 131018696 | PDZ-GEF2 | C/T (T) | 0.3869 | 0.6130 |
| rs152815 | 13 | 131102433 | KIAA1961 | A/G (A) | 0.0123 | 0.2914 |
| rs1566427 | 14 | 131267887 | ACSL6 | A/G (G) | 0.2141 | 0.3154 |
| rs1355095 | 15 | 131324984 | ACSL6 | G/A (G) | 0.0303 | 0.2968 |
| rs667437 | 16 | 131351725 | ACSL6 | A/G (A) | 0.7855 | 0.6382 |
| rs477086 | 17 | 131360826 | ACSL6 | C/T (T) | 0.7855 | 0.5172 |
| rs615305 | 18 | 131368072 | ACSL6 | A/G (G) | 0.7918 | 0.4352 |
| rs2240525 | 19 | 131392099 | ACSL6 | A/G (G) | 0.0075 | 0.0829 |
| rs399714 | 20 | 131395004 | ACSL6 | C/T (T) | 0.3495 | 0.3628 |
| rs3914025 | 21 | 131429500 | G/A (G) | 0.0564 | 0.0969 | |
| rs3846726 | 22 | 131435214 | C/T (T) | 0.0716 | 0.0559 | |
| rs3916441 | 23 | 131445456 | C/T (T) | 0.0564 | 0.1192 | |
| rs31400 | 24 | 131465722 | C/T (T) | 0.0112 | 0.1969 |
Of all SNPs typed for these three genes, rs1291602 was the only marker that involved an amino acid change. Rs1291602 is located in the penultimate exon of the PDZ-GEF2 gene and changes the 1452th amino acid from arginine (R) to glutamine (Q). For this marker, PDT produced nominally significant results in the screening subsample (P=0.0476). However, in the replication subsample, it was not significant (Table 2). The minor allele, glutamine, was overtransmitted to affected subjects and was carried by haplotype C, which was statistically significant in the screening subsample (see subsequently). Although the changed amino acid was not in any of the well-defined structural domains of the PDZ-GEF2 gene, amino acid sequence alignment indicated that it was conserved among fruit fly, mouse, rat, chimpanzee and human.
From these analyses, we concluded that the results in the screening and replication subsamples were broadly corroborative. In both subsamples, identical haplotypes were implicated, although the strength of the signals differed. Since the families in the screening subsample were selected because they demonstrated linkage to 5q, these results were not unexpected.
LD and haplotype structure in the region
To further our understanding of this region, we estimated pairwise LD and constructed haplotypes for the ISHDSF (including both the screening and replication subsamples) and the Irish case–control study of schizophrenia (ICCSS) samples. As seen in Figure 3, the two samples had very similar LD patterns. Both samples had two LD blocks: markers 2–20 were in one block and markers 21–24 were in the other. For the four markers forming the second LD block, markers 21–23 had low LD with most markers in the first LD block, with the exception of markers 1, 3, 7, 13 and 15. In clear contrast, marker 24 had reasonable LD with most markers in the first LD block, with a few exceptions: markers 2, 4, 10 and 19 were in low LD with marker 24. Interestingly, the markers showing distinct patterns with the second LD block (i.e. markers 1–4, 7, 10, 13, 15, 19) were the same markers with which we observed association signals (P<0.10; Table 2) in the screening subsample. This suggests that there is a relationship between the two LD blocks underlying the same association signals in the ISHDSF sample. When we compared the LD patterns between the two sexes, the results were similar (Fig. 3D and E). The most noticeable differences between the males and females were that in females, two pairwise LDs (markers 7–16 and 7–18) did not reach statistical significance. The implication of these differences is not clear. In the other three samples (the Irish proband–parents trio sample, ITRIO; the German sib pair and proband–parents trio sample, German and the Pittsburgh nuclear family sample, Pittsburgh), the LD patterns were similar to those of the ISHDSF and ICCSS samples. For ITRIO, we typed 20 of the 24 markers. These 20 markers were divided into two LD blocks, such as those seen in both ISHDSF and ICCSS samples, and the partition of the two blocks was the same, i.e. between markers 20 and 21 (data not shown). This was reassuring that the ISHDSF, ICCSS and ITRIO were all of Ireland/UK ancestry and had similar LD patterns. For the German and Pittsburgh samples, we typed 8 and 11 markers, respectively. All typed markers were located within the large LD block of the Irish samples and indeed, they formed a single LD block with high LD between individual markers in both samples (data not shown). These results indicated that the LD structure among the five samples used in this study was very similar.
When haplotypes were analyzed, we saw only a few major haplotypes in this region. The four most abundant haplotypes (frequency >5%) were identical between the ISHDSF and ICCSS samples and had similar frequencies (Fig. 3B and C). Comparing these haplotypes with those identified in Table 1, it was not difficult to recognize that haplotype A was the protective haplotype and C and D were the risk haplotypes. We also noticed that the four markers (2, 4, 10 and 19) showing a distinct LD pattern with marker 24 tagged both haplotypes C and D, sharing the overtransmitted minor allele. None of other markers typed in this region tagged both haplotypes C and D.
Sex- and genotype-conditioned analyses
We initiated our replication with the ICCSS sample by typing the 24 selected SNPs. A few of the markers (2,4,10,19) showed nominal genotypic associations, but none demonstrated allelic association (data not shown). To evaluate whether the genotypic associations observed for these markers were meaningful, we carried out genotype-PDT (19) analyses in the combined ISHDSF sample retrospectively. We found that these same four markers showed genotypic associations in the ISHDSF sample (Table 3), suggesting that the associations of these four markers in the initial ICCSS analyses were unlikely to be false-positive findings. For all four markers, the genotypic associations showed the same pattern within each sample, but the pattern differed between the ICCSS and the ISHDSF. In ICCSS, the 11 homozygotes were overrepresented in the affected subjects and the heterozygotes were underrepresented. In ISHDSF, the heterozygotes were overtransmitted to affected subjects and the 11 homozygotes were undertransmitted. On the basis of the frequencies of haplotypes listed in Figure 3, it was clear that subjects carrying a 11 genotype for these four markers would most likely carry haplotypes A and B. Similarly, the most likely haplotypes carried by a 22 subject would be C and D. In other words, if there was genetic heterogeneity in this region, we reasoned, stratifying the subjects on the basis of the genotypes of these markers, i.e. performing genotype-conditioned analyses, would be the most efficient method to extract the association signals. In the case of ISHDSF, the heterozygotes were overrepresented in the affected subjects. If our reasoning was correct, then we would expect to get similar association signal by analyzing only the affected heterozygotes at these four markers. In light of recent identification of potentially functional estrogen-response elements in the promoter region (between markers 20 and 21) of the ACSL6 gene (20), we also explored sex-conditioned analyses.
Genotype association and sex- and genotype-conditioned TDT analyses of ISHDSF using rs3756295 as conditioning marker
| Marker name | Genotype association | Male | Female | ||||||
|---|---|---|---|---|---|---|---|---|---|
| (Conditioned genotype)-allele | Transmitted frequency | Untransmitted frequency | P-value | (Conditioned genotype)-Allele | Transmitted frequency | Untransmitted frequency | P-value | ||
| rs1030271 | 0.2095 | (1/2)-1 | 0.280 | 0.270 | 0.8742 | (1/2)-1 | 0.475 | 0.225 | 0.0181 |
| rs2549012 | 0.0078 | (1/2)-2 | 0.269 | 0.260 | 0.8751 | (1/2)-2 | 0.310 | 0.214 | 0.3198 |
| rs4706020 | 0.0675 | (1/2)-1 | 0.316 | 0.276 | 0.5312 | (1/2)-1 | 0.575 | 0.175 | 0.0002 |
| rs3756295 | 0.0009 | (1/2)-2 | 0.226 | 0.245 | 0.7462 | (1/2)-2 | 0.341 | 0.182 | 0.0875 |
| rs40396 | 0.0725 | (1/2)-1 | 0.356 | 0.404 | 0.4749 | (1/2)-1 | 0.553 | 0.237 | 0.0044 |
| rs4996522 | 0.0564 | (1/2)-1 | 0.349 | 0.396 | 0.4775 | (1/2)-1 | 0.571 | 0.238 | 0.0016 |
| rs1291602 | 0.3560 | (1/2)-2 | 0.117 | 0.117 | 1.0000 | (1/2)-2 | 0.156 | 0.031 | 0.0742 |
| rs739952 | 0.0930 | (1/2)-1 | 0.346 | 0.375 | 0.6648 | (1/2)-1 | 0.595 | 0.191 | 0.0001 |
| rs244739 | 0.0629 | (1/2)-1 | 0.349 | 0.387 | 0.5688 | (1/2)-1 | 0.568 | 0.227 | 0.0009 |
| rs31251 | 0.0090 | (1/2)-2 | 0.245 | 0.284 | 0.5254 | (1/2)-2 | 0.386 | 0.227 | 0.1042 |
| rs6873582 | 0.1623 | (1/2)-1 | 0.350 | 0.380 | 0.6594 | (1/2)-1 | 0.550 | 0.225 | 0.0025 |
| rs1422871 | 0.0833 | (1/2)-1 | 0.337 | 0.375 | 0.5623 | (1/2)-1 | 0.548 | 0.238 | 0.0033 |
| rs152815 | 0.1333 | (1/2)-1 | 0.298 | 0.298 | 1.0000 | (1/2)-1 | 0.523 | 0.273 | 0.0159 |
| rs1566427 | 0.0644 | (1/2)-1 | 0.356 | 0.375 | 0.7733 | (1/2)-1 | 0.568 | 0.227 | 0.0009 |
| rs1355095 | 0.7187 | (1/2)-2 | 0.115 | 0.125 | 0.8311 | (1/2)-2 | 0.205 | 0.045 | 0.0195 |
| rs667437 | 0.3109 | (1/2)-1 | 0.340 | 0.359 | 0.7732 | (1/2)-1 | 0.548 | 0.214 | 0.0014 |
| rs477086 | 0.2936 | (1/2)-1 | 0.353 | 0.373 | 0.7709 | (1/2)-1 | 0.619 | 0.238 | 0.0003 |
| rs615305 | 0.1082 | (1/2)-1 | 0.349 | 0.377 | 0.6683 | (1/2)-1 | 0.568 | 0.227 | 0.0009 |
| rs2240525 | 0.0016 | (1/2)-2 | 0.226 | 0.274 | 0.4275 | (1/2)-2 | 0.381 | 0.191 | 0.0516 |
| rs399714 | 0.0941 | (1/2)-1 | 0.340 | 0.350 | 0.8817 | (1/2)-1 | 0.525 | 0.225 | 0.0051 |
| rs3914025 | 0.6974 | (1/2)-2 | 0.198 | 0.236 | 0.5049 | (1/2)-2 | 0.455 | 0.091 | 0.0001 |
| rs3846726 | 0.6076 | (1/2)-2 | 0.198 | 0.236 | 0.5049 | (1/2)-2 | 0.455 | 0.091 | 0.0001 |
| rs3916441 | 0.8331 | (1/2)-2 | 0.206 | 0.216 | 0.8637 | (1/2)-2 | 0.452 | 0.095 | 0.0002 |
| rs31400 | 0.8423 | (1/2)-2 | 0.177 | 0.135 | 0.4260 | (1/2)-2 | 0.400 | 0.100 | 0.0015 |
On the basis of this rationale, we carried out sex- and genotype-conditioned transmission disequilibrium test (TDT) analyses for the ISHDSF sample with the TDTPHASE module of the UNPHASED program (the PDTPHASE module does not allow this kind of analysis). Affected subjects were first separated by sex and then stratified by the genotypes of the conditioning marker. Table 3 summarized the TDT results conditioned on sex and the genotypes of marker 4 or rs3756295. In Table 3, for simplicity, we listed only one genotype-allele combination for each sex. In cases where both the undertransmitted and overtransmitted genotype-allele combinations were significant, we arbitrarily listed only the overtransmitted combination. In the table, the conditioning genotype is in parentheses and prefixed the specific allele. For example, for marker 1, rs1030271, for the females, when the genotype of the conditioning marker, marker 4 or rs3756295, was heterozygous (1/2), 47.5% of allele 1 was transmitted to the affected subjects and 22.5% was transmitted to the unaffected subjects, P=0.0181. The reason that we chose marker 4 as the conditioning marker was that it was one of the four markers showing genotypic associations in both the ISHDSF and ICCSS samples and it was the one with the lowest P-value in the ISHDSF sample, which was used to generate the hypothesis. On the basis of the LD structure showing in Figure 3, we predicted that conditioning on the other three of these four markers would produce similar results. For the limited tests we did to verify this prediction, our prediction was correct. For example, for markers 1–3, the corresponding P-values for the same genotype-allele combinations as listed in Table 3 for the male and female subjects were 0.8840, 0.7628, 0.8874 and 0.0136, 0.2615, 0.0037, respectively, when they were analyzed conditioning on marker 19 (rs2240525). These results were comparable with those obtained by conditioning on marker 4, rs3756295, i.e. the significant markers remained significant and the insignificant markers remained insignificant. As predicted by our hypothesis, only the subjects with heterozygous genotype at the conditioning marker showed significant overtransmitted alleles, since heterozygotes were the genotype group overrepresented in the affected subjects in the genotype association analyses. These analyses also indicated that the association signals observed in the ISHDSF derived largely from female subjects. Interestingly, these conditioned analyses readily revealed the risk haplotype in the risk genotype group. For example, for the females, the risk alleles in Table 3 matched perfectly with haplotype C shown in Figure 3B, which was identified as the risk haplotype by standard multi-locus PDT analyses (Table 1). From these results, we hypothesized that the associations were sex-specific and sex- and genotype-conditioned analyses were necessary to reveal these signals.
Replication of the association in the ICCSS, ITRIO, German and Pittsburgh samples
To test this hypothesis, we performed similar analyses in the ICCSS sample. The results were listed in Table 4. As seen in the ISHDSF sample, these analyses identified multiple significant single markers and revealed the risk haplotype without resorting to haplotype analyses.
Sex- and genotype-conditioned analyses using rs3756295 as conditioning marker
| Marker name | ICCSS | ITRIO | ||||||
|---|---|---|---|---|---|---|---|---|
| Male | Female | Male | Female | |||||
| (Conditionedgenotype)-allele | P-value | (Conditioned genotype)-allele | P-value | (Conditioned genotype)-allele | P-value | (Conditioned genotype)-allele | P-value | |
| rs1030271 | (1/1)-2 | 0.5157 | (1/1)-2 | 0.0010 | (1/1)-2 | 0.0005 | (1/1)-2 | 0.0355 |
| rs2549012 | (1/1)-1 | 0.7306 | (1/1)-1 | 0.0015 | (1/1)-1 | 0.0005 | (1/1)-1 | 0.0082 |
| rs4706020 | (1/1)-2 | 0.4948 | (1/1)-2 | 0.0008 | (1/1)-2 | 0.0004 | (1/1)-2 | 0.0355 |
| rs3756295 | (1/1)-1 | 0.6323 | (1/1)-1 | 0.0008 | (1/1)-1 | 0.0234 | (1/1)-1 | 0.0011 |
| rs40396 | (1/1)-1 | 0.5622 | (1/1)-1 | 0.0008 | (1/1)-1 | 0.0007 | (1/1)-1 | 0.0085 |
| rs4996522 | (1/1)-1 | 0.5394 | (1/1)-1 | 0.0012 | (1/1)-1 | 0.0004 | (1/1)-1 | 0.0040 |
| rs1291602 | (1/1)-1 | 0.6323 | (1/1)-1 | 0.0008 | (1/1)-1 | 0.0001 | (1/1)-1 | 0.0097 |
| rs739952 | (1/1)-1 | 0.5107 | (1/1)-1 | 0.0008 | ||||
| rs244739 | (1/1)-1 | 0.5098 | (1/1)-1 | 0.0008 | (1/1)-1 | 0.0003 | (1/1)-1 | 0.0075 |
| rs31251 | (1/1)-1 | 0.5775 | (1/1)-1 | 0.0004 | (1/1)-1 | 0.0005 | (1/1)-1 | 0.0031 |
| rs6873582 | (1/1)-1 | 0.5224 | (1/1)-1 | 0.0008 | ||||
| rs1422871 | (1/1)-1 | 0.5753 | (1/1)-1 | 0.0008 | ||||
| rs152815 | (1/1)-2 | 0.1800 | (1/1)-2 | 0.0017 | (1/1)-2 | 0.0012 | (1/1)-2 | 0.0128 |
| rs1566427 | (1/1)-1 | 0.4612 | (1/1)-1 | 0.0010 | (1/1)-1 | 0.0003 | (1/1)-1 | 0.0085 |
| rs1355095 | (1/1)-1 | 0.7711 | (1/1)-1 | 0.0003 | (1/1)-1 | 0.0001 | (1/1)-1 | 0.0190 |
| rs667437 | (1/1)-1 | 0.5408 | (1/1)-1 | 0.0016 | (1/1)-1 | 0.0002 | (1/1)-1 | 0.0134 |
| rs477086 | (1/1)-1 | 0.5148 | (1/1)-1 | 0.0015 | (1/1)-1 | 0.0002 | (1/1)-1 | 0.0176 |
| rs615305 | (1/1)-1 | 0.6003 | (1/1)-1 | 0.0016 | ||||
| rs2240525 | (1/1)-1 | 0.6551 | (1/1)-1 | 0.0006 | (1/1)-1 | 0.0003 | (1/1)-1 | 0.0109 |
| rs399714 | (1/1)-1 | 0.4421 | (1/1)-1 | 0.0010 | (1/1)-1 | 0.0002 | (1/1)-1 | 0.0138 |
| rs3914025 | (1/1)-1 | 0.7869 | (1/1)-1 | 0.0028 | (1/1)-1 | 0.0034 | (1/1)-1 | 0.0111 |
| rs3846726 | (1/1)-1 | 0.8061 | (1/1)-1 | 0.0045 | (1/1)-1 | 0.0031 | (1/1)-1 | 0.0178 |
| rs3916441 | (1/1)-1 | 0.9973 | (1/1)-1 | 0.0067 | (1/1)-1 | 0.0026 | (1/1)-1 | 0.0157 |
| rs31400 | (1/1)-1 | 0.7206 | (1/1)-1 | 0.0015 | (1/1)-1 | 0.0054 | (1/1)-1 | 0.0092 |
| SNPSpD correction threshold (α=0.05) | 0.00156 | 0.00178 | ||||||
| Marker name | German | Pittsburgh | ||||||
| Male | Female | Male | Female | |||||
| (Conditionedgenotype)-allele | P-value | (Conditioned genotype)-allele | P-value | (Conditioned genotype)-allele | P-value | (Conditioned genotype)-allele | P-value | |
| rs1030271 | ||||||||
| rs2549012 | (2/2)-2 | 0.6469 | (2/2)-2 | 0.0000 | ||||
| rs4706020 | ||||||||
| rs3756295 | (1/1)-1 | 0.0025 | (1/1)-1 | 0.2776 | (2/2)-2 | 0.6387 | (2/2)-2 | 0.0000 |
| rs40396 | (2/2)-2 | 0.9881 | (2/2)-2 | 0.0008 | ||||
| rs4996522 | (2/2)-2 | 0.6706 | (2/2)-2 | 0.0005 | ||||
| rs1291602 | (1/1)-1 | 0.0006 | (1/1)-1 | 0.2010 | (2/2)-1 | 0.8146 | (2/2)-1 | 0.0002 |
| rs739952 | ||||||||
| rs244739 | (2/2)-2 | 0.3471 | (2/2)-2 | 0.0008 | ||||
| rs31251 | (2/2)-2 | 0.6183 | (2/2)-2 | 0.0000 | ||||
| rs6873582 | ||||||||
| rs1422871 | ||||||||
| rs152815 | (1/1)-2 | 0.0132 | (1/1)-2 | 0.0325 | (2/2)-1 | 0.5643 | (2/2)-1 | 0.0000 |
| rs1566427 | (1/1)-1 | 0.0005 | (1/1)-1 | 0.1958 | (2/2)-2 | 0.9946 | (2/2)-2 | 0.0013 |
| rs1355095 | (1/1)-1 | 0.0008 | (1/1)-1 | 0.1678 | (2/2)-1 | 0.6755 | (2/2)-1 | 0.0001 |
| rs667437 | (1/1)-1 | 0.0008 | (1/1)-1 | 0.2139 | (2/2)-2 | 0.8550 | (2/2)-2 | 0.0020 |
| rs477086 | (1/1)-1 | 0.0006 | (1/1)-1 | 0.2125 | (2/2)-2 | 0.7431 | (2/2)-2 | 0.0031 |
| rs615305 | ||||||||
| rs2240525 | (1/1)-1 | 0.0013 | (1/1)-1 | 0.2369 | (2/2)-2 | 0.7053 | (2/2)-2 | 0.0000 |
| rs399714 | ||||||||
| rs3914025 | ||||||||
| rs3846726 | ||||||||
| rs3916441 | ||||||||
| rs31400 | ||||||||
| SNPSpD correction threshold (α=0.05) | 0.00250 | 0.00250 | ||||||
To seek further evidence of these effects, we genotyped some of the 24 markers in three independent samples: the ITRIO (20 markers), the German (8 markers) and the Pittsburg (11 markers) samples. As seen in Table 4, all these samples showed significant associations at the individual marker level. After the correction of multiple testing with the SNPSpD method (21), many of these markers remained significant in the ICCSS, ITRIO, German and Pittsburgh samples. Similar to what we observed in the ISHDSF and ICCSS samples, the risk haplotypes in these samples were readily identified. In ICCSS, there was no association observed in the male subjects. For the females, haplotype A was overrepresented for those who had a 11 genotype at rs3756295, the conditioning marker. This same haplotype was underrepresented in those who had a 12 genotype at the conditioning marker (data not shown). In ITRIO, haplotype A was overtransmitted to those male subjects who had a 11 genotype at the conditioning marker and it became undertransmitted for those male subjects with a 12 genotype at the conditioning marker (data not shown). Females with a 22 genotype showed a trend of association with haplotype C. The German sample was very similar to the ITRIO in that haplotype A was overtransmitted to males with a 11 genotype and undertransmitted to those with a 12 genotype. In the Pittsburgh sample, both haplotypes C and D (only D listed in Table 4) were overtransmitted to those females with a 22 genotype at the conditioning marker. No apparent protective haplotype was found. No association was found in the males.
DISCUSSION
The 5q22–33 region is one of the best replicated regions in linkage studies of schizophrenia. In the last few years, although a few selected candidates from this chromosomal region had been studied (17,22,23), systematic positional mapping efforts have not been reported. In this article, we report such a study with the ISHDSF and other four independent samples. We took a stepwise approach and systematically mapped the critical interval in the ISHDSF sample. As outlined in Figure 1, when a candidate gene or interval was identified in the ISHDSF, other samples were used to replicate the finding. In this process, ISHDSF was used to generate specific hypothesis to be tested in the other samples. For the ISHDSF sample itself, a verification step was included to minimize the likelihood of false-positive findings. This design follows the principles of two-stage design suggested in the recent literature (24–26). The first stage is exploratory in nature, and multiple analyses and testing are appropriate to generate specific hypothesis. The second stage is then used to test the specific hypothesis using appropriate multiple testing correction (Bonferroni correction or correction with the false discovery rate framework). Following this process, we have found significant associations in all five independent samples. Specifically, we have found that sex plays an important role in the associations in this region for all tested samples, and a set of highly correlated markers can be used as stratifiers to partition subjects into more homogeneous groups so that the genetic associations can be readily identified. Without the conditioned analyses, only a few markers reach nominal significance in the ICCSS, ITRIO, German and Pittsburgh samples (data not shown).
Conditioned analyses are not commonly used in association studies and therefore merit discussion. Sex-conditioned analyses were conducted for all samples in this study. Is sex involved in the etiology of schizophrenia? There is evidence to support this notion. In a recent, extensive review of world-wide incidence rate, it was found that males have significantly higher incidence rate than females (27). For the five samples used in this study, the male:female ratio of the affected subjects ranges from 1.21 to 2.72 (Table 5). Males have a younger age of onset than females (28). Sex-specific association was reported for the catecho-O-methyltransferase gene (29). In this current study, in each of the five samples, association signals derive largely from one of the two sexes. These consistent results argue for the involvement of sex in the associations in this region. In fact, several estrogen-response elements, a signature of sex-hormone-regulated genes, were identified in the promoter region of ACSL6 gene in a recent study (20). Another study found that ACSL6 gene exhibits sexually dimorphic expression in a mouse model (30). These studies provide a genomic and molecular basis for the sex-specific associations observed in this region. We also used genotype-conditioned analyses. The rationale was based on two pieces of information. First, in both the ISHDSF and ICCSS samples, the same four markers showed genotypic associations. These consistent genotype associations suggest that they may be a clue to the association signals in this region. Conditional analyses based on the genotypes of these markers could partition the samples into more homogeneous groups and yield more consistent results. Secondly, in the examination of the LD structure, we found that these four markers had the same LD patterns with other markers in this region, especially with the markers of the second LD block. The four markers have very high LD among themselves (D’>0.95, r2>0.75). This implies that the genotypic associations observed among these markers are the same signal, and this signal extends to cover both LD blocks. On the basis of the LD and haplotype information, we predict that conditioned analyses using any one of these four markers would produce similar results. Our limited testing confirms this. We used marker 4, rs3756295, because it produced the best genotypic association among the four markers in our hypothesis-generating ISHDSF sample. In other samples, marker 4 may not be the best of the markers, and therefore, the results presented in Table 4 may not be the best associations in these samples.
Sample ascertainment and description
| Sample | Ascertainment and inclusion criteria | Sample size | Sex ratio |
|---|---|---|---|
| ISHDSF | DSM-IIIR. The sample had a narrow, an intermediate and a broad disease definition. The narrow definition included schizophrenia, poor-outcome schizoaffective disorders and simple schizophrenia. The intermediate definition included the narrow definition, schizotypal personality disorder, schizophreniform disorder, delusional disorder, atypical psychosis and good-outcome schizoaffective disorder. Inclusion criteria for the pedigrees were that one or more persons of the first or secondary relatives met the narrow definition, or two or more persons met the intermediate definition. In this study, only the results with narrow disease definition were reported | The ISHDSF was divided into two subsamples based on family NPL score. The screen subsample consisted of 61 families with NPL score ≥1.44 and a total of 371 subjects. The average family size was six, with two subjects, met the narrow disease definition. The replication subsample contained 206 families and a total of 966 subjects. The average family size was five, with two subjects met the narrow disease definition | Screen subsample: 101 affected males and 42 affected females. Sex ratio: 2.40. The replication subsample: 250 affected males and 122 affected females. Sex ratio: 2.05 |
| ICCSS | DSM-IIIR. The affected subjects had a diagnosis of schizophrenia or poor-outcome schizoaffective disorder. Controls were screened against lifetime history of schizophrenia. All included subjects were of Irish or English ancestry, with all four grandparents born in either Ireland or the UK | 657 cases and 414 controls | Of the cases, 436 were males and 221 were females. Sex ratio: 1.97. Of the controls, 233 were males and 178 were females. Sex ratio: 1.31 |
| ITRIO | The same as the ICCSS | 187 families, 564 subjects | 158 affected males, 58 affected females. Sex ratio: 2.72 |
| German | Affected individuals had either a diagnosis of schizophrenia according to DSM-IIIR or schizoaffective disorder, schizophrenic subtype according to the Research Diagnostic Criteria (RDC) | 211 families (86 affected sib pairs, 125 trios), 751 subjects | 184 affected males, 152 affected females. Sex ratio: 1.21 |
| Pittsburgh | Subjects were recruited from inpatients and outpatients facilities within a 500 mile radius of Pittsburgh and met DSM IV criteria of schizophrenia or schizoaffective disorder. Probands reported Caucasian ancestry | 247 families, 729 subjects | 166 affected males, 82 affected females. Sex ratio: 2.02 |
In this study, we have observed evidence in each of the five tested samples that haplotypes spanning SPEC2, PDZ-GEF2 and ACSL6 genes are associated with schizophrenia. However, there are differences with respect to sex and risk haplotypes among the five samples used in this study. In the ISHDSF, ICCSS and Pittsburgh samples, associations are found largely in the female subjects. In the ITRIO and German samples, the associations derive mainly from male subjects. With respect to haplotypes, A, C and D are implicated. Haplotype A is found associated with the disease in four (ISHDSF, ICCSS, ITRIO and German) of the five samples, whether it is a protective or risk factor in a given sample depends on the genotypes of the conditioning marker. We have noticed that risk haplotypes are always found in the genotype group that is overrepresented in or overtransmitted to the affected subjects. For example, the 11 homozygotes are overrepresented in the cases of the ICCSS sample, and haplotype A found in this genotype group is overrepresented in affected subjects. Similarly, the heterozygotes are underrepresented in the affected subjects in the ICCSS sample, and the same haplotype A found in this genotype group is also underrepresented. Haplotypes C and D were a risk haplotype in ISHDSF and Pittsburgh samples. It is interesting that although both haplotypes are associated with increased risks, the strength of association differs. In the ISHDSF, the association of haplotype C is stronger, whereas in the Pittsburgh sample, that of D is stronger.
The associations observed among the five samples in this study are complex. Since these associations depend on the sex, haplotypes and the genotypes of the conditioning marker, if they are proved to be true—which needs further replications from other independent researchers—this implies that several factors jointly determine the disease status. In other words, these associations require certain interactions among the sex, genotypes of conditioning marker and haplotypes. To verify these results, similarly conditioned analyses are necessary. In each of these five samples, we see clear differences with respect to sex, haplotype and the genotype of conditioning marker. However, we do not see a combination that is consistently associated with the disease across all five samples. A possible explanation is that there are more required factors to be identified. If schizophrenia is not a single disorder but rather a collection of diseases, then, at least in theory, we can partition the affected subjects into a number of homogenous diseases when the required stratifying factors are identified. What we have seen in this study is a starting point for such a process.
Functionally, all three genes are plausible candidates for schizophrenia. They are expressed in several regions of brain on the basis of the Microarray Expression Data from the Genome Browser (http://www.genome.ucsc.edu/). Both SPEC2 and PDZ-GEF2 are components of signal transduction chains, coupling the intercellular signals to intracellular processes. Specifically, SPEC2 is an effecter protein of CDC42, a small GTPase that engages in the processes of cell skeleton assembly. By regulating filamentous actin, CDC42 exerts profound effects on cell shape, polarity, migration, cell–cell adhesion and cytokinesis (31,32). The PDZ-GEF2 gene is a GTP exchange factor that exerts its effects through regulating the active status of G-protein, leading to the activation/deactivation of cellular processes in the events of ligand binding by surface membrane receptors. The small GTPases working with PDZ-GEF2 have been identified as Rap1 and Rap2 (33–35). Activated by many receptors and secondary messengers, Rap1 has been shown to regulate the expression of integrin via the inside-out pathway (36,37). The integrins, in turn, have been shown to be critical in the development of central nervous system (38–40). PDZ-GEF1, a closely related protein of PDZ-GEF2, has been shown to interact with synaptic scaffold molecule (S-SCAM) (41), which interacts with other PSD proteins and plays a critical role in the organization of synaptic complex in glutamatergic neurons. There is ample evidence that abnormalities of the glutamatergic neurons are involved in schizophrenia (42–44). In fact, some recently identified candidate genes, including DTNBP1 (45), may be directly or indirectly involved in the glutamatergic pathway (46,47). ACSL6, also called acyl CoA synthetase 2 (ACS2) and fatty acid CoA long chain 6, is a key enzyme that activates polyunsaturated long chain fatty acids. Its preferred substrates include arachidonic acid (AA), eicosapentaenoic acid (EPA) and docosahexaenoic acid (DHA). There is a hypothesis that membrane phospholipids defects may be involved in the pathophysiology of schizophrenia, of which AA plays a central role (48). Indeed, in many studies (49–53), the amount of AA, EPA and DHA in cell membranes has been found to be reduced in schizophrenia patients. Treatments with these polyunsaturated fatty acids may improve symptoms (54,55). In vitro experiments of overexpression of ACS2 result in increased AA internalization and neurite outgrowth (56). There is also a direct association study of an isozyme, ACS4, with schizophrenia (57).
Schizophrenia is thought to have complex etiology. The association studies of schizophrenia often report complex association signals. DTNBP1 gene, reported first in the ISHDSF, is arguably one of the best replicated schizophrenia candidate genes. Among the several reports of positive associations in the gene, the associated markers and risk haplotypes are different (1,45,58–60). Similar phenomena are also observed in the neuregulin 1 gene (2,61–64), the catechol-O-methyltransferase gene (29,65–68) and the regulator of G-protein signaling 4 gene (4,69–71). In this study, we have observed three haplotypes potentially predisposing risks to the affected subjects, and each haplotype is observed in at least two samples. Although our conditioned analyses give us clean associations in all samples, these analyses have not produced complete consistency among the samples. Some of the Pittsburgh cases reported on here were included in a recent genetic association study of ACSL6 polymorphisms (72). In that study, a group of cases were compared with community-based controls using pooled DNA analyses. Significant associations were not detected. There are several explanations for the discordance between the present study and the report by Chowdari et al. (72). These include differences in sample composition and markers analyzed. In addition, the latter did not include haplotype-based analyses, nor did it investigate subgroups based on gender or genotypes. The results in the study by Chowdari et al. (72) were similar to the results of the ICCSS sample before conditioned analyses. There have been suggestions that replication of association studies can be made at the level of individual markers and haplotypes, or at the level of genes (73). Our study, we believe, has met both criteria. Confounding factors causing the inconsistencies need to be studied further. A future direction would be to include family history, clinical symptoms and other information in association analyses. Since the interval of the SPEC2, PDZ-GEF2 and ACSL6 genes shares extended LD, we are unable to distinguish whether one or more of these genes predispose risks to schizophrenia. Functional studies may be necessary to differentiate them.
MATERIALS AND METHODS
Subjects
We used five independent samples in this study. Of them, the ISHDSF, ICCSS and ITRIO were Irish samples collected from the Republic of Ireland and Northern Ireland, UK. For the ICCSS, the sex of subjects was determined experimentally by genotyping three X-specific (rs320991, rs321029 and rs6647617) and three Y-specific (rs1558843, rs2032598 and rs2032652) SNPs because most of the controls were obtained from blood donation centers and the sex of the donors was not available to us. Subjects with XXY (nine subjects, four cases and five controls) and XYY (one case) genotypes were classified as males. The German sample consisted of two subsamples, 86 affected sib pairs with parents and 125 proband–parents trios. Of the 86 sib pairs, 54 were used in the linkage study where overlapping linkage peak was found between the ISHDSF and German sib samples (8,9). The trios were selected from a larger trio sample (16) with positive family history (defined as at least one first- or second-degree relative of the proband meeting the DSM IV criteria of schizophrenia or schizoaffective disorder). The Pittsburgh sample contained 247 nuclear families (case and parents) with a total of 729 subjects with DNA for genotyping. The details of ascertainment and other information of these samples were listed in Table 5. To minimize the variation of disease definitions used by different samples, except those explicitly stated, all analyses reported for the ISHDSF were conducted with the narrow disease definition that was the closest to the diagnoses used in the other samples.
Marker selection and genotyping
Our strategy for SNP marker selection evolved as the publicly funded HapMap project progressed. In the beginning of our effort, we selected SNPs evenly distributed across our targeted region, giving priority to SNPs within known genes. As the HapMap project developed, we took advantage of the information produced, using SNPs with minor allele frequencies >5% in the Caucasian panel used by the HapMap project. When we focused on a specific gene, we used the HapMap data to construct haplotypes in the gene of interest and selected haplotype-tagged SNPs (74). At this stage, we used a higher density to maximize our ability to detect association.
We used several techniques for SNP typing. For the ISHDSF screening subsample, a majority of SNPs were typed by the FP-TDI protocol (75,76). Briefly, DNA sequences of SNPs obtained from dbSNP (http://www.ncbi.nlm.nih.gov/SNP/index.html) were masked by the RepeatMasker program (77) and PCR and FP-TDI extension primers were designed by the Primer 3 program (78). All SNPs were tested in a panel of 48 randomly selected subjects from the ISHDSF sample. Markers with a minor allele frequency of ≥5% were used to type the screening subsample. We used the FP-TDI genotyping products from the Perkin Elmer Corporation (Boston, MA, USA) and followed the recommended procedures for PCR and single base extension. For some SNPs, when the Perkin Elmer kits did not produce optimal results, we used a different reporting dye set as reported previously (79). We used the TaqMan assay (80) to type most SNPs in the ICCSS, ITRIO and Pittsburgh samples. Some SNPs of the Pittsburgh sample were typed with the SNaPShot method. The German sample was also typed with the TaqMan method. All SNPs typed with the TaqMan method were either validated assays or custom-designed assays developed by Applied BioSystems Incorporated (Foster city, CA, USA). The SNaPShot protocol was the same as reported previously (4). Several measurements of quality control were implemented in genotyping procedures. These included automatic scoring and data handling, positive controls for known genotypes, inclusion of duplicates and retyping subjects for some markers. All SNPs typed were checked for Mendelian errors and Hardy–Weinberg equilibrium deviations with the PEDSTATS program (81).
Statistical analyses
In accordance with our study design, we took a stepwise approach to data analysis. For the ISHDSF screening subsample, which was used to generate leads to be confirmed in the replication subsample, we carried out several TDTs as implemented in the TRANSMIT (82,83), FBAT (84,85) and PDT (86) programs. In the TRANSMIT analyses, we used liberal conditions, including all affected subjects and all nuclear families within a pedigree. P-values reported for the TRANSMIT program were obtained by 100 000 bootstraps. For FBAT analyses, we used the empirical variance estimator (the −e option in the program) to account for genotype correlation among affected siblings, which resulted from linkage since we were fine-mapping a linkage region. The minimal number of transmission was set to 10 families. For PDT analyses, we used the default settings with both vertical (trios) and horizontal (sib pairs) transmission accounted for. P-values reported for the PDT program were weighted equally for all families (PDT ave). Since these programs were based on different assumptions, collectively, they presented a balanced view of the association signals that we were seeking. For each typed SNP in the screening sample, all three programs were run for the narrow, intermediate and broad disease definitions (87). On the basis of our calculation to minimize genotyping cost while retaining reasonable false discovery rate, we used a cutoff P-value of 0.10 for the screening subsample. Markers with P-values less than this cutoff were considered for genotyping in the ISHDSF replication sample. Since we used three programs to evaluate the evidence in the screening subsample, more often than not, the three programs produced different P-values.We took a compromise approach to determine which SNPs would be followed up. Out of the three programs, if two had P-values ≤0.10 for at least one diagnosis or one program had a P-value ≤0.05, the marker would be followed up by genotyping the replication subsample. For the ISHDSF replication subsample, we used only the PDT program to test specific markers and haplotypes for association [for multi-locus haplotype analyses, PDTPHASE (88) was used instead of standard PDT, because PDTPHASE implemented PDT principles for multi-locus analyses, and standard PDT could not analyze multi-locus association]. The replication subsample was analyzed independently. In these analyses, we included uncertain haplotypes as estimated by the expectation-maximization (EM) algorithm (89). We set the number of random restarts for the EM process to 10 and the minimal haplotype frequency to 1%. P-values obtained were χ2 distributions without permutation tests. The reason we chose to use PDT to analyze the ISHDSF replication subsample was that, in theory, PDT is more powerful because it includes both vertical and horizontal transmission. This is particularly relevant for pedigrees like those contained in the ISHDSF.
For the ITRIO, German and Pittsburgh samples, since they were all nuclear families, we decided to use TDT as implemented in the TDTPHASE module of the UNPHASED program. For the ICCSS, the COCAPHASE module of the UNPHASED program (88) was used. Both the TDTPHASE and COCAPHASE were able to analyze single markers and multiple haplotypes. One of the reasons we used the TDTPHASE and COCAPHASE was that both of them allow conditioned analyses based on sex and genotype. In sex-specific analyses, only male or female offspring were used. In genotype-conditioned analyses, subjects were first stratified by the 11, 12 and 22 genotypes of the conditioning marker and the allele frequency or transmission count was then compared between the affected and unaffected subjects. The P-values of these conditioned analyses were obtained from the comparison between a specified allele in a given genotype group between the affected and unaffected subjects. In the analyses of the ICCSS, ITRIO, German and Pittsburgh samples, we used a frequency cutoff of 0.01 for minor haplotypes. Missing genotypes of the parents were incorporated by the EM algorithm. The rate of missing genotypes in the ICCSS, ITRIO, German and Pittsburgh samples varied between 2 and 12%. When markers were in high LD, as the markers used in this study, a small fraction of missing data seemed to cause no bias on haplotype construction and subsequent association analyses (90–92).
We used the HAPLOVIEW program (74) to estimate pairwise LD between markers and to partition haplotype blocks. LD blocks were partitioned using the algorithm of Gabriel et al. (93). Long-range haplotypes and their frequencies were estimated by the MERLIN and FUGUE programs (94).
SUPPLEMENTARY MATERIAL
Supplementary Material is available at HMG Online.
ACKNOWLEDGEMENTS
This study is supported by research grants from the National Institute of Mental Health, USA (MH41953 to K.S.K., MH56242, MH66263 and MH63480 to V.L.N.), the National Health and Medical Research Council, Australia (ID303251 to D.B.W. and S.G.S.) and the National Alliance for Research on Schizophrenia and Depression (Young Investigator Award to X.C.). We thank the patients and their families for participating in this study.
Conflict of Interest statement. None declared.
