


Abstract
Disrupted-in-schizophrenia 1 (DISC1), identified in a pedigree with a familial psychosis with the chromosome translocation (1:11), is a putative susceptibility gene for psychoses such as schizophrenia and bipolar disorder. Although there are a number of patients with major depressive disorder (MDD) in the family members with the chromosome translocation, the possible association with MDD has not yet been studied. We therefore performed an association study of the DISC1 gene with MDD and schizophrenia. We found that Cys704 allele of the Ser704Cys single-nucleotide polymorphism (SNP) was associated with an increased risk of developing MDD ( P =0.005, odds ratio=1.46) and stronger evidence for association in a multi-marker haplotype analysis containing this SNP ( P =0.002). We also explored possible impact of Ser704Cys on brain morphology in healthy volunteers using MR imaging. We found a reduction in gray matter volume in cingulate cortex and a decreased fractional anisotropy in prefrontal white matter of individuals carrying the Cys704 allele compared with Ser/Ser704 subjects. In primary neuronal culture, knockdown of endogenous DISC1 protein by small interfering RNA resulted in the suppression of phosphorylation of ERK and Akt, whose signaling pathways are implicated in MDD. When effects of sDISC1 (Ser704) and cDISC1 (Cys704) proteins were examined separately, phosphorylation of ERK was greater in sDISC1 compared with cDISC1. A possible biological mechanism of MDD might be implicated by these convergent data that Cys704 DISC1 is associated with the lower biological activity on ERK signaling, reduced brain gray matter volume and an increased risk for MDD.
INTRODUCTION
The disrupted-in-schizophrenia 1 (DISC1) gene was initially identified at the breakpoint of a balanced translocation ( 1 , 11 )(q42.1;q14.3), which segregated with major mental disorders in a large Scottish family ( 1 ). In this family, patients with schizophrenia, bipolar disorder and recurrent major depressive disorder (MDD) had been identified as carriers of the translocation ( 1 , 2 ). Subsequent genetic studies in several independent populations, including association and linkage studies, have also suggested that the DISC1 gene may be implicated in both schizophrenia and bipolar disorder ( 3–10 ). Previous studies suggest that genetic variations within the DISC1 gene, which increase risk for schizophrenia, are associated with the cerebral cortical gray matter and hippocampal volumes and function ( 9 , 11 , 12 ). However, no association study between the DISC1 gene and MDD has not yet been reported, despite there are more patients with MDD than those with schizophrenia in the original Scottish family members with translocation.
DISC1 is a multi-functional protein. Several research groups have identified DISC1 interacting proteins, which are associated with the components of the cytoskeleton and centrosome, such as dynein, Nudel, elongation protein zeta-1, etc. ( 13–18 ). DISC1 plays critical roles on the cerebral cortex development via microtubular dynamics and the DISC1–dynein complex ( 13 ). Another function of DISC1 may be modulation of cAMP signaling via an interaction with phosphodiesterase 4B, which also has been found to be disrupted by a balanced translocation in a patient with schizophrenia ( 19 ). Other functions of DISC1, including the mitochondrial and nuclear related functions, have also been suggested ( 15 , 20 , 21 ).
Here, we report an association of the genetic variations of DISC1, including Ser704Cys (rs821616) single-nucleotide polymorphism (SNP) and MDD. The risk allele (Cys704) for MDD is associated with the reduced gray matter volume and fractional anisotropy (FA) in prefrontal white matter in healthy subjects. Furthermore, the risk allele is linked to lower ERK activity (extracellular signal-regulated kinase), which has been suggested to have a role in the pathophysiology in MDD.
RESULTS
Association between the genetic variants of the DISC1 gene and major depression
We examined possible association between genetic variants in the DISC1 gene, including Ser704Cys SNP and MDD or schizophrenia. We genotyped 13 SNPs to cover the DISC1 locus at an average density of 31 kb. We found a significant association between genetic variations in DISC1 and MDD (Table 1 ). The Cys allele frequency of SNP12 (Ser704Cys) was greater in patients with MDD when compared with controls ( χ2 =7.88, df=1, P =0.005, odds ratio=1.46, 95% CI 1.12–1.92). There was a weak evidence for an association with SNP1 ( P =0.048). As previous association studies of the DISC1 gene applied three-marker haplotype analysis ( 4 , 8 , 9 ), we performed this analysis. Consistent with the individual marker results, the three marker haplotypes containing SNPs 11–13 were associated with MDD: SNP11 (G allele)–SNP12(Cys)–SNP13(C allele) ( P =0.002; Table 2 ). When we examined the association between genetic variations of DISC1 and schizophrenia, a weak evidence for association was observed with SNP7 ( P =0.0496), whereas SNP12 (Ser704Cys) was not significantly associated with schizophrenia (Table 1 ). Because a prior study reported sex-dependent effects on association with schizophrenia ( 4 ), we examined males and females separately. This analysis revealed stronger evidence for association with SNP9 in female patients with schizophrenia ( P =0.0088), but no association in male subjects, whereas a prominent gender effect was not found in MDD (Table 3 ). Three marker haplotypes were not associated with schizophrenia (data not shown). SNP12 showed a strong linkage disequilibrium (LD) with SNP10 and SNP11, moderate LD with SNP1 and SNP13 and weak LD with SNP6 in controls, and similar LD results were obtained in MDD and schizophrenia (Supplementary Material, Tables S1–S3). LD pattern of our data was similar to that of HapMap database in the Japanese population. Our results suggest that DISC1 is associated with MDD and with schizophrenia and that Ser704Cys SNP, in particular, is associated with MDD in our sample.
Allele distributions for 13 SNPs in the DISCI gene in patients with MDD, those with schizophrenia and controls
| SNP | dbSNP | Distance from SNPI | Major/minor polymorphism | Amino acid substitution | Controls | MDD | SZ | ||||
|---|---|---|---|---|---|---|---|---|---|---|---|
| n =717 | n =373 | P -value | OR | n =658 | P -value | OR | |||||
| 1 | rs6541281 | C/T | 0.122 | 0.094 | 0.048 | 0.75 | 0.105 | 0.16 | — | ||
| 2 | rs3738401 | 17161 | G/A | Gln264Arg | 0.260 | 0.263 | 0.89 | — | 0.264 | 0.83 | — |
| 3 | rs1340982 | 48898 | C/T | 0.461 | 0.456 | 0.82 | — | 0.459 | 0.92 | — | |
| 4 | rs1322784 | 115801 | T/C | 0.351 | 0.371 | 0.36 | — | 0.375 | 0.19 | — | |
| 5 | rs1535529 | 141475 | C/T | 0.425 | 0.441 | 0.48 | — | 0.410 | 0.42 | — | |
| 6 | rs7551537 | 159083 | C/T | 0.363 | 0.363 | 0.98 | — | 0.382 | 0.29 | — | |
| 7 | rs999710 | 197809 | C/T | 0.404 | 0.424 | 0.39 | — | 0.441 | 0.05 | 1.16 | |
| 8 | rs967433 | 218681 | T/C | 0.409 | 0.416 | 0.76 | — | 0.387 | 0.24 | — | |
| 9 | rs821577 | 253923 | G/T | 0.201 | 0.166 | 0.05 | — | 0.172 | 0.06 | — | |
| 10 | rs821597 | 289130 | T/C | 0.414 | 0.438 | 0.28 | — | 0.404 | 0.60 | — | |
| 11 | rs843979 | 317474 | C/G | 0.335 | 0.358 | 0.29 | — | 0.334 | 0.92 | — | |
| 12 | rs821616 | 331464 | A/T | Ser704Cys | 0.104 | 0.145 | 0.005 | 1.46 | 0.122 | 0.14 | — |
| 13 | rs2806465 | 353160 | G/C | 0.376 | 0.378 | 0.92 | — | 0.370 | 0.75 | — | |
Minor allele frequencies in controls are shown. SZ, schizophrenia, OR, odds ratio. Significant results ( P <0.05) indicated by italics.
Three-marker haplotype analysis among patients with major depression and controls
| SNP | Haplotype | ||||||||||
|---|---|---|---|---|---|---|---|---|---|---|---|
| 1 | 2 | ||||||||||
| 2 | 1 | 1 | |||||||||
| 3 | 1 | 1 | 2 | ||||||||
| 4 | 2 | 1 | 1 | ||||||||
| 5 | 2 | 1 | 1 | ||||||||
| 6 | 2 | 2 | 2 | ||||||||
| 7 | 1 | 1 | 1 | ||||||||
| 8 | 2 | 2 | 1 | ||||||||
| 9 | 2 | 2 | 2 | ||||||||
| 10 | 1 | 2 | 2 | ||||||||
| 11 | 1 | 2 | 2 | ||||||||
| 12 | 2 | 2 | |||||||||
| 13 | 2 | ||||||||||
| Global P -value | 0.030 | 0.19 | 0.043 | 0.81 | 0.74 | 0.55 | 0.69 | 0.20 | 0.012 | 0.17 | 0.057 |
| Individual P -value | 0.017 | 0.026 | 0.018 | 0.24 | 0.25 | 0.25 | 0.19 | 0.023 | 0.019 | 0.017 | 0.002 |
| Haplotype frequency in control | 0.050 | 0.201 | 0.180 | 0.123 | 0.136 | 0.108 | 0.081 | 0.064 | 0.018 | 0.096 | 0.074 |
| Haplotype fequency in MDD | 0.026 | 0.250 | 0.233 | 0.104 | 0.116 | 0.089 | 0.060 | 0.035 | 0.000 | 0.130 | 0.116 |
Major allele=1, minor allele=2. Individual P -value indicates the best P -value among the haplotypes. Significant results ( P <0.05) indicated by italics.
Gender difference of allele distributions for 13 SNPs in the DISCI gene among patients with schizophrenia, those with major depression and controls
| SNP female | Male | |||||||||||||
|---|---|---|---|---|---|---|---|---|---|---|---|---|---|---|
| Control | SZ | MDD | Control | SZ | MDD | |||||||||
| n =366 | n =318 | P -value | OR | n =226 | P -value | OR | n =351 | n =340 | P -value | OR | n =147 | P -value | OR | |
| 1 | 0.135 | 0.102 | 0.061 | — | 0.091 | 0.021 | 0.64 | 0.108 | 0.107 | 0.96 | — | 0.099 | 0.65 | — |
| 2 | 0.258 | 0.274 | 0.52 | — | 0.279 | 0.44 | — | 0.262 | 0.254 | 0.74 | — | 0.238 | 0.43 | — |
| 3 | 0.466 | 0.459 | 0.80 | — | 0.465 | 0.97 | — | 0.456 | 0.459 | 0.91 | — | 0.442 | 0.69 | — |
| 4 | 0.344 | 0.385 | 0.12 | — | 0.356 | 0.68 | — | 0.359 | 0.366 | 0.78 | — | 0.395 | 0.29 | — |
| 5 | 0.414 | 0.399 | 0.58 | — | 0.469 | 0.063 | — | 0.437 | 0.421 | 0.53 | — | 0.398 | 0.25 | — |
| 6 | 0.373 | 0.381 | 0.77 | — | 0.354 | 0.51 | — | 0.352 | 0.384 | 0.22 | — | 0.378 | 0.44 | — |
| 7 | 0.404 | 0.447 | 0.12 | — | 0.427 | 0.44 | — | 0.405 | 0.437 | 0.23 | — | 0.418 | 0.69 | — |
| 8 | 0.411 | 0.390 | 0.42 | — | 0.425 | 0.65 | — | 0.406 | 0.384 | 0.40 | — | 0.401 | 0.89 | — |
| 9 | 0.209 | 0.154 | 0.0088 | 1.45 | 0.164 | 0.054 | — | 0.192 | 0.190 | 0.90 | — | 0.170 | 0.41 | — |
| 10 | 0.399 | 0.426 | 0.31 | — | 0.442 | 0.14 | — | 0.430 | 0.384 | 0.08 | — | 0.432 | 0.96 | — |
| 11 | 0.328 | 0.343 | 0.56 | — | 0.369 | 0.14 | — | 0.343 | 0.325 | 0.47 | — | 0.340 | 0.92 | — |
| 12 | 0.111 | 0.137 | 0.14 | — | 0.146 | 0.073 | — | 0.097 | 0.107 | 0.52 | — | 0.143 | 0.035 | 0.64 |
| 13 | 0.383 | 0.363 | 0.46 | — | 0.363 | 0.50 | — | 0.369 | 0.376 | 0.77 | — | 0.401 | 0.34 | — |
Minor allele frequencies in controls are shown. SZ, schizophrenia; OR, odds ratio. Significant results ( P <0.05) indicated by italics.
Effects of the DISC1 Ser704Cys polymorphism on in vivo brain structure
As the abnormalities in the brain gray matter volume and white matter microstructure have been implicated in the biology of mood disorders and schizophrenia ( 22 , 23 ), we examined the possible effects of the Ser704Cys SNPs and other associated SNPs with schizophrenia on brain structure in healthy subjects (demographic information for Ser704Cys, Table 4 ). We found a bilateral (left dominant) reduction in the gray matter volume in the anterior cingulate cortex (ACC) [Brodmann area (BA) 24, Talairach coordinates x , y , z =−6, 27, 17, respectively, t =3.58], cingulate gyrus (BA24, Talairach coordinates x , y , z =0, 3, 34, respectively, t =3.7) and the posterior cingulate gyrus (BA31, Talairach coordinates x , y , z =−9, −39, 36, respectively, t =3.39) in cys-DISC1 carriers (cys/cys and cys/ser) compared with ser/ser-DISC1 individuals by tensor-based morphometry (TBM) analysis (Fig. 1 , upper panel). When we analyzed the effect of this SNP on brain morphology in the other direction (i.e. cys>ser), we found a significant reduction in the volumes of the lateral ventricle, interhemispheric fissure and the bilateral Sylvian fissure in ser/ser-DISC1 individuals compared with cys-DISC1 carriers (Fig. 1 , lower panel). This finding suggests that cys-DISC1 carriers have expanded cerebrospinal fluid (CSF) space compared with ser/ser-DISC1 individuals, possibly consistent with our finding that cys carriers in our analysis have reductions in tissue volume measures. We did not detect significant differences in hippocampal volume related to this DISC1 polymorphism with even at a lenient threshold at P <0.05. In comparison with ser/ser-DISC1 individuals, cys-DISC1 carriers demonstrated a significantly decreased FA value in the frontal white matter ( P <0.001) (Fig. 2 ). The reversed contrast, i.e. increased FA in cys-DISC1 carriers, was not observed even at the level of P <0.05. Our results suggest that the Ser704Cys SNP of the DISC1 gene might affect human gray matter volume and white matter microstructure, particularly in peri-cingulate area. On the other hand, genotype effects of other SNPs, i.e. SNP1, SNP7 and SNP9 on the brain morphology or white matter microstructure, were not detected.
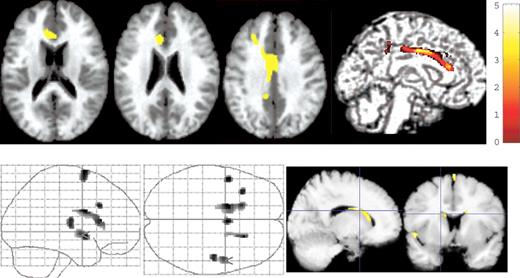
Impact on the brain morphology of the Ser704Cys SNP in healthy subjects. (Upper panel) The SPM {t} is displayed onto T1-weighted MR images. Cys-DISC1 carriers ( n =22) had reduced volumes in the bilateral ACC, cingulate gyrus and the posterior cingulate gyrus compared with ser/ser-DISC1 individuals ( n =86). (Lower panel) The SPM{t} is displayed on a standard maximum intensity projection images and T1-weighted MR images. Ser/Ser-DISC1 individuals demonstrated decreased volumes of the lateral ventricle, interhemispheric fissure and bilateral Sylvian fissure, indicating an expansion of the CSF space in cys-DISC1 carriers.
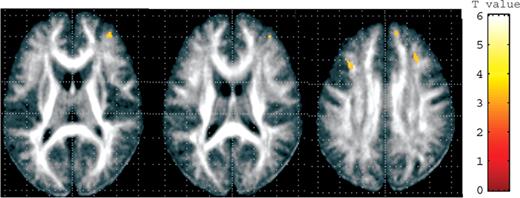
Disruption of white matter integrity revealed by DTI. The SPM{t} is displayed onto a FA map. A significant reduction in FA in the prefrontal white matter was found in the cys-DISC1 carriers ( n =22) when compared with individuals with ser/ser-DISC1 ( n =86).
Demographic information for the brain MRI study
| Variables | ser/ser-DISC1 ( n =86) | cys-DISC1 carriers ( n =22) | P -value |
|---|---|---|---|
| Age | 35.1 (11.5) | 40.1 (13.8) | 0.08 |
| Gender (M/F) | 33/53 | 7/15 | 0.81 |
| Education years | 16.7 (2.8) | 16.8 (3.4) | 0.89 |
| Full-scale IQ | 111.8 (11.5) | 109.2 (13.7) | 0.39 |
| Variables | ser/ser-DISC1 ( n =86) | cys-DISC1 carriers ( n =22) | P -value |
|---|---|---|---|
| Age | 35.1 (11.5) | 40.1 (13.8) | 0.08 |
| Gender (M/F) | 33/53 | 7/15 | 0.81 |
| Education years | 16.7 (2.8) | 16.8 (3.4) | 0.89 |
| Full-scale IQ | 111.8 (11.5) | 109.2 (13.7) | 0.39 |
Cys-DISC1 carriers ( n =22): cys/ser-DISC1 ( n =21) and cys/cys-DISC1( n =1). Mean values (SD) are presented.
DISC1 and ERK signaling
ERK signaling and Akt signaling have been implicated in MDD ( 24 , 25 ). Thus, we investigated the possible involvement of DISC1 on ERK and Akt signaling pathways. The endogenous DISC1 function in cortical cultures was examined using small interfering RNA (siRNA) for DISC1, and robust decrease (70%) of endogenous DISC1 protein was confirmed (Fig. 3 Aa and d). We found decreased levels of phosphorylation of ERK1/2 (pERK1/2: an activated form of ERK) and phosphorylation of Akt (pAkt: an activated form of Akt) after DISC1-siRNA transfection, suggesting that endogenous DISC1 protein is involved in ERK and Akt activations (Fig. 3 Aa–c). In contrast, the levels of total ERK1/2, Akt and TUJ1 (class III β-tubulin, a neuronal marker) proteins were not altered (Fig. 3 Aa, quantified data (mean±SD): ERK1: 1.15±0.22, 0.95±0.27; ERK2: 1.01±0.17, 0.99±0.22; Akt: 1.05±0.06, 1.09±0.04; TUJ1: 1.03±0.07, 1.01±0.07; relative to none; scramble, si-DISC1, respectively).
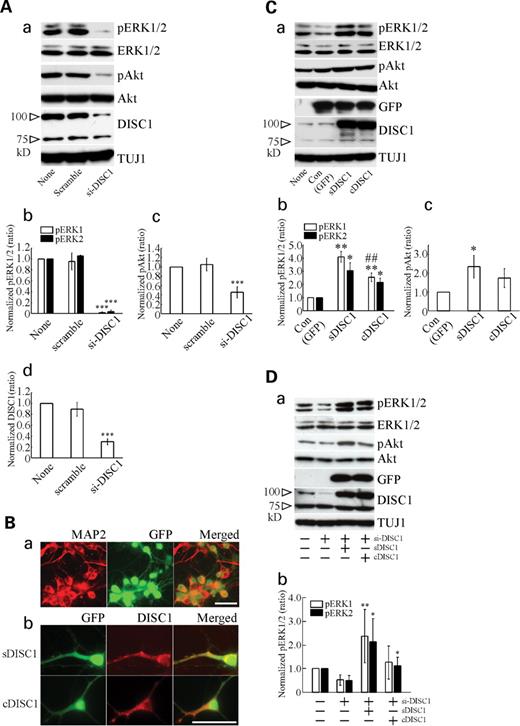
Effects of the DISC1 protein on the ERK and Akt signaling in cortical neurons. ( A ) Suppression of phosphorylation of ERK and Akt in DISC1-siRNA-transfected cultures. Cortical cultures after DIV4 were treated with siRNA for DISC1 (si-DISC1; 100 n m ) or control (scramble; 100 n m ) for 72 h. Cortical cultures were harvested at DIV7 for western blotting for pERK1/2, ERK1/2, pAkt, Akt, DISC1 or TUJ1. The immunoblots shown are representative of four independent experiments (a). Quantification of the immunoreactivity of pERK1/2 (b), pAkt (c) or DISC1 (d). Quantitative data represent the mean±SD ( n =4). *** P <0.001 versus scramble. ( B ) (a) Double staining with GFP (green) signal and immunostaining signal by anti-MAP2 (red, a neuronal marker) antibody after sindbis virus-mediated gene transfer. Representative control (GFP only)-infected cortical cultures were shown. (b) GFP and DISC1 signal after sDISC1 ( upper ) or cDISC1 ( lower ) gene transfer, respectively. DISC1 localization was detected as a red signal. Virus infection was performed at DIV4 and infected cultures were fixed at DIV6 for immunostaining. Bar=50 µm. ( C ) Differential activation of ERK and Akt between sDISC1 and cDSIC1. Samples for blotting pERK1/2, ERK1/2, pAkt, Akt, GFP, DISC1 or TUJ1 were prepared 24 h (DIV5) after viral infection at DIV 4 (a). The quantification of pERK1/2 (b) or pAkt (c) levels after overexpression of sDISC1 or cDISC1 was shown. The immunoblots shown are representative of four independent experiments. Quantitative data represent the mean±SD ( n =4). ** P <0.01, * P <0.05 versus control, ## P <0.001 versus sDISC1. ( D ) (a) Recovery of the activation of ERK1/2 and Akt after sDISC1 and cDISC overexpressing in DISC1 knockdown cultures. To downregulate endogenous DISC1, si-DISC1 was applied at DIV4 or DIV5 cultures. Sindbis virus-infection for sDISC1 or cDISC1 overexpression was performed 48 h after the si-DISC1 treatment. Samples for blotting for pERK1/2, ERK1/2, pAkt, Akt, GFP, DISC1 or TUJ1 were prepared 48 h after viral infection. The immunoblot images are representative of five independent experiments. (b) The quantification of pERK1/2 for each experimental condition was shown. Quantitative data represent the mean±SD ( n =5). ** P <0.01, * P <0.05 versus si-DISC1.
To examine the effect of Ser704Cys SNP on ERK and Akt signaling, we overexpressed each type of DISC1 protein (sDISC1: DISC1 protein with Ser704; cDISC1: DISC1 protein with Cys704) using a sindbis virus-mediated gene delivery system. Neuronal cultures infected with the control viral construct [green fluorescence protein (GFP) only] were doubly stained with GFP signal and immunostaining signal by anti-microtubule-associated protein 2 (MAP2: a neuronal dendritic marker) antibody, as well as viral constructs of two types of DISC1 (sDISC1 and cDISC1) (Fig. 3 Ba). About 85% of MAP2-positive cells in control-, sDISC1- or cDISC1-infected cortical cultures were GFP positive, indicating that the majority of neurons were infected, respectively [control (mean±SD): 84.4±6.4%; sDISC1: 86.6±5.1%; cDISC1: 86.3±9.8%, n =6 fields, selected randomly]. When cortical cultures infected by sDISC1 or cDISC1 were doubly stained with GFP signal and immunostaining signal by the DISC1 antibody, the sDISC1 and cDISC1 proteins were located in both cell body and neurites in punctuate manner, especially perinuclear region and neurite branch (Fig. 3 Bb). As expression levels of GFP and TUJ1 were not altered by viral infections and both sDISC1- and cDISC1-infected cultures showed similar levels of DISC1 expression (Fig. 3 Ca, quantified data (mean±SD): GFP: 1.00±0.10, 0.92±0.15; TUJ1: 0.98±0.07, 0.98±0.09; DISC1: 5.43±0.52, 5.43±0.33, relative to control, sDISC1, cDISC1, respectively), we examined the phosphorylation of ERK and Akt in this system. Two-way ANOVA indicated significant main effects of viral infection ( F =202, df=2, P <0.001) and measurement of protein levels ( F =161, df=8, P <0.001) and interaction of these two factors ( F =44.4, df=16, P <0.001). There were significant effects of viral infection in the measurements of pERK1/2 and pAkt; however, neither total ERK1/2 nor Akt was altered after virus infection (pERK1: F =104, P <0.001; pERK2: F =29.2, P <0.001; pAkt: F =9.0, P <0.01; ERK1: F =1.8, P >0.2; ERK2: F =3.0, P >0.1; Akt: F =0.2, P >0.8) (Fig. 3 C). Post hoc comparison revealed significant increases in pERK1/2 in sDISC1- or cDISC1-infected cultures compared with control (pERK1: sDISC1 P <0.01; cDISC1 P <0.01; pERK2: sDISC1 P <0.05; cDISC1 P <0.05) (Fig. 3 Ca and b). The levels of ERK1 activation in sDISC1-overexpressing cultures were more intensive than those in cDISC1-overexpressing cultures ( P <0.01) (Fig. 3 Ca and b). A significant elevation of pAkt was observed in the sDISC1-overexpressing cultures compared with control ( P <0.05), although an increase in the pAkt level by cDISC1 overexpression was not significant ( P >0.1) (Fig. 3 Ca and c). However, there were no significant difference of pAkt levels between sDISC1 and cDISC1 ( P >0.1).
We next examined rescue experiments, transfection with sDISC1 or cDISC1 into primary culture knocked down to DISC1. In this experiment, siRNA for DISC1 decreased phosphorylation of ERK by ∼50% and there were significant effects of viral infection in the measurements of pERK1/2 (pERK1: F =7.3, P <0.01; pERK2: F =9.4, P <0.01) (Fig. 3 D). Post hoc comparison revealed a significant elevation of pERK1 levels in the sDISC1-overexpressing cultures compared with si-DISC1 treatment ( P <0.01), although an increase in the pERK1 level by cDISC1 overexpression was not statistically significant ( P >0.1) (Fig. 3 D). A significant elevation of pERK2 was observed in sDISC1- and cDISC1-infected cultures compared with si-DISC1 treatment (sDISC1: P <0.05; sDISC1: P <0.05) (Fig. 3 D). Western blots showed that total ERK, Akt and TUJ1 protein levels were not changed and that pAkt levels were also rescued by DISC1 overexpression (Fig. 3 Da). These results suggest the recovery of the activation of ERK1/2 and Akt after sDISC1- and cDISC-overexpression in DISC1 knockdown cultures. The effect of rescue on phosphorylation of ERK was larger in sDISC1 compared with cDISC1, although the difference did not reach the statistical significance (Fig. 3 D). This might be due to the complexity of this experiment (siRNA plus overexpression) compared with the overexpression only experiments, as the standard deviations of these experiments were larger than those of overexpression experiments. Our results suggest a possible role of DISC1 in the ERK and Akt signaling and an impact of Ser704Cys on ERK activation.
DISCUSSION
Here, we report the evidence for association between MDD and the Ser704Cys SNP as well as several haplotypes including the Ser704Cys SNP. We also replicated earlier evidence for a weak association with schizophrenia which is stronger in female patients ( 4 ). Previous association studies with schizophrenia suggested several regions in the DISC1 gene, such as intron2–intron3, intron4–intron9 and intron9–exon13 (4, 5, 8, 9). The region of intron8–intron9 is common across the studies. Consistent with the previous studies, two SNPs in intron9 were associated with schizophrenia in our study. Both false-positive and false-negative associations due to population stratification cannot be excluded in our case–control study, despite the precaution of ethnic matching of this study. Differences in gender ratio and ages between groups could be potential confounding factors. Therefore, it is necessary to carry out further investigations to confirm our findings in other samples. It has also suggested that allelic heterogeneity exists for association between the DISC1 gene and psychiatric illness ( 26 ), and this may explain different alleles being associated with illness in our sample compared with others.
We demonstrated that healthy subjects with the risk allele carriers for MDD (cys-DISC1) had relatively reduced the gray matter volumes in cingulate cortex, relatively expanded CSF space and reduced the FA values in the prefrontal white matter. This pattern of changes on magnetic resonance imaging (MRI) scanning, specifically the gray matter volume deficits in the ACC, expanded the CSF and reduced the FA values in prefrontal cortex, has been repeatedly reported in the studies of patients with schizophrenia and MDD ( 22 , 27–29 ). Several studies demonstrated a decreased volume in the ACC in patients with MDD in remission, MDD with a family history or in early onset depression ( 30–33 ) and abnormalities of cortical neuronal organization in postmortem brain of MDD have been reported in the ACC ( 34 ). It has been reported that relatively higher FA is associated with remission of MDD, following treatment with drugs or electroconvulsive therapy; however, reduced prefrontal FA has not been reported consistently in MDD ( 29 , 35–37 ). These various findings suggest that decreased gray matter volume and FA in the frontal area might be associated with the increased risk for MDD. Previous studies found that the risk haplotype of the DISC1 gene affected cortical gray matter and that Ser704Cys SNP had an impact on the hippocampal structure and function ( 9 , 11 ); however, we did not observe either effects of SNPs associated with schizophrenia in our sample on cortical gray matter or effects of Ser704Cys SNP on hippocampal volume. Moreover, in our study of the effect of Ser/Cys genotype on brain imaging derived phenotypes and clinical association, it is the cys allele that is relatively deleterious, whereas in an earlier study, it was the ser allele ( 9 ). These inconsistencies may relate to sample differences, methodological differences, and also to possible genetic and allelic heterogeneity.
We found robust effects of DISC1 on ERK and Akt signaling and evidence that the cDISC1 (the risk allele for MDD) might exert a weaker effect on the ERK activation than sDISC1. The involvement of ERK in the therapeutic mechanisms of mood disorder has been proposed ( 38 , 39 ). It has been shown that ERK can phosphorylate PDE4 and alter its activity ( 40 , 41 ) and that PDE inhibitors might have antidepressant efficacy ( 24 ). Taken together, the regulation of ERK signaling by DISC1 may contribute, at least in part, to the mechanisms of the risk for MDD. Structural imaging studies have demonstrated reduced gray matter volumes and white matter abnormality in several brain areas of patients with mood disorders relative to healthy controls, and postmortem morphometric brain studies also demonstrated cellular atrophy and/or loss ( 24 ). As the ERK kinase signaling is implicated in cytoskeletal remodeling, neurite outgrowth and cell survival ( 24 ) and decreased expression of ERK was observed in the postmortem brain of depressive patients ( 42 ), impaired ERK signaling could be related to the structural abnormality in major depression.
In conclusion, we have found evidence for association between genetic variation of DISC1 and MDD, brain morphology and ERK signaling pathway. Our data suggest that Ser704Cys might be a functional variant that impacts on neural mechanisms implicated in the biology of major depression.
MATERIALS AND METHODS
Subjects
Subjects for the clinical association study were recruited at Fujita Health University School of Medicine, Showa University School of Medicine and National Center of Neurology and Psychiatry, Japan. They were 373 patients with MDD [147 males and 226 females with mean age of 54.0 years (SD 16.0); mean age of onset of 46.5 years (SD 15.3)], 658 patients with schizophrenia [340 males and 318 females with mean age of 43.6 years (SD 14.6); mean age of onset of 24.2 years (SD 8.6)] and 717 healthy comparison subjects [351 males and 366 females with mean age of 41.3 years (SD 16.9)]. All the subjects were Japanese. Consensus diagnosis was made for each patient by at least two psychiatrists, according to the Diagnostic and Statistical Manual of Mental Disorders, 4th edition (DSM-IV Criteria). Control subjects were healthy volunteers who had no current or past contact to psychiatric services.
One hundred and eight healthy Japanese (biologically unrelated) for MR experiments were recruited at the National Center of Neurology and Psychiatry and screened by a questionnaire on medical history and excluded if they had neurological, psychiatric or medical conditions that could potentially affect the central nervous system, such as substance abuse or dependence, atypical headache, head trauma with loss of consciousness, asymptomatic or symptomatic cerebral infarction detected by the T2-weighted MRI, hypertension, chronic lung disease, kidney disease, chronic hepatic disease, cancer or diabetes mellitus. Detail demographics of subjects in genotypes of SNP1, SNP7, SNP9 and SNP12 (Ser704Cys) were noted in Supplementary Material. After description of the study, written informed consent was obtained from every subject. The study protocol was approved by institutional Ethics Committees.
Genetic analysis
Venous blood was drawn from subjects and genomic DNA was extracted from the whole blood according to the standard procedures. Thirteen SNPs were genotyped using the TaqMan 5′-exonuclease allelic discrimination assay as described previously ( 43 , 44 ). Primers and probes for detection of the SNPs are available upon request. Statistical analysis of association studies was performed using SNPAlyse (DYNACOM, Yokohama, Japan). Allele distributions between patients and controls were analyzed by the χ2 test for independence. The measure of LD, denoted as D ′ and r2 , was calculated from the haplotype frequency using the expectation–maximization algorithm. Case–control haplotype analysis was performed by the permutation method to obtain the empirical significance ( 45 ). The global P -values represent the overall significance using the χ2 test when the observed versus expected frequencies of all the haplotypes are considered together. The individual haplotypes were tested for association by grouping all others together and applying the χ2 -test with 1 df. P -values were calculated on the basis of 10 000 replications. All P -values reported are two tailed. Statistical significance was defined at P <0.05.
Neuroimaging analysis
Brain MR procedure is described in Supplementary Material. The basic principle of TBM is to analyze the local deformations of an image and to infer local differences in the brain structure. The method was described in detail previously ( 46 ) (Supplementary Material). Diffusion tensor imaging (DTI) analysis was performed using FA maps by a voxel-by-voxel analysis (Supplementary Material). The statistical parametric maps of Jacobian determinants and FA values were analyzed using statistical parametric mapping (SPM) 2, which implements a ‘general linear model’. To test hypotheses about regional population effects, data were analyzed by a two-sample t -test without global normalization. We used P <0.001 without a correction for multiple comparisons to avoid type-II error to explore whole brain and then applied small-volume correction ( P <0.01) to each cluster. Since there has been no a priori hypothesis for FA changes associated with DISC1 polymorphism, we applied conservative statistical threshold ( P <0.001) for the analysis of FA values. The resulting sets of t -values constituted the statistical parametric maps {SPM (t)}.
Molecular biology
Primary cultures were prepared from the cerebral cortex of postnatal 2-day-old rats (Wister ST; SLC, Shizuoka, Japan) as reported previously ( 47 , 48 ).
The siRNA transfection was performed as reported previously ( 49 ). We used 21 nt siRNA duplexes with two nucleotides of the rat DISC1 mRNA coding region (113–131, GACCAGGCTACATGAGAAG, NM_175596). Sense (GACCAGGCUACAUGAGAAGtt) and antisense (CUUCUCAUGUAGCCUGGUCtc) strands were chemically synthesized by Ambion Ltd (Cambridge, UK). The siRNA (GCGCGCUUUGUAGGAUUCG) named ScrambleII from Dharmacon Research Inc. was used as a scramble control. The plasmid for viral construction of the DISC1 gene was derived from pSinRep5 (Invitrogen, USA) and had two subgenomic promoters followed by a multiple cloning site for an arbitrary gene insertion and an enhanced GFP open-reading frame, thus the virus can produce both arbitrary protein and enhanced GFP independently in the infected cell ( 50 ). The control virus produces GFP only, whereas DISC1 virus produces both DISC1 and GFP independently. Detail procedure for viral construction is in Supplementary Material.
Immunocytochemistry was performed, as described previously ( 51 ). We used anti-MAP2 (1:1000; Sigma) or anti-DISC1 (1:100) ( 17 ) antibodies as a primary antibody, respectively. Alexa Fluor (1:1000, Molecular Probes) was applied as a secondary antibody. Fluorescent images were observed by an inverted microscope (Axiovert 200, ZEISS) with a CCD (cool SNAPfx, ZEISS).
Immunoblotting was carried out as described previously ( 47 ). Primary antibodies for immunoblotting were used at the following dilutions: anti-Akt (1:1000, Cell Signaling), anti-phospho-Akt (1:1000, Cell Signaling), anti-ERK (1:1000, Cell Signaling), anti-phospho-ERK (1:1000, Cell Signaling), anti-TUJ1 (1:5000, Berkeley antibody company), anti-GFP (1:1000, Medical & Biological Laboratories) and anti-DISC1 antibodies (1:1000) ( 17 ). To quantify the amount of proteins after immunoblotting, we measured the density of immunoblots with an image-analysis software (Science Lab 98 Image Gauge; Fuji Photo Film Co. Ltd, Tokyo, Japan). The level of protein expression was indicated as a ratio that was normalized to control the condition (none, sole GFP-infected, or scramble-transfection, respectively) in each experiment. Statistical analysis was performed with unpaired t -test or ANOVA, followed by the Tukey post hoc comparisons when applicable.
SUPPLEMENTARY MATERIAL
Supplementary Material is available at HMG Online.
ACKNOWLEDGEMENTS
The authors thank Tomoko Shizuno for technical assistance. This work was supported in part by Grants-in-Aid from the Japanese Ministry of Health, Labor and Welfare (H17-kokoro-007 and H16-kokoro-002), the Japanese Ministry of Education, Culture, Sports, Science and Technology, CREST (Core research for Evolutional Science and Technology) of JST (Japan Science and Technology Agency), Research on Health Sciences focusing on Drug Innovation of the Japan Health Sciences Foundation, the Uehara Memorial Foundation, Takeda Science Foundation and Japan Foundation for Neuroscience and Mental Health.
Conflict of Interest statement . The authors declare that they have no conflict of interests.
REFERENCES
Author notes
The authors wish it to be known that, in their opinion, the first three authors should be regarded as joint First Authors.
