


Abstract
Human mannose-binding lectin (MBL) is a member of the collectin protein family that binds a broad range of microorganisms and activates the lectin-complement pathway of innate immunity. Common alleles of MBL2 disrupt the MBL protein or modulate the amount of protein produced, resulting in MBL deficiency. The clinical manifestations of MBL deficiency have been extensively studied but the actual role of this lectin in immunity to infection remains a matter of strong debate. MBL is commonly thought to play a key role in protective immunity, because MBL deficiency has been associated with an increase in susceptibility to infectious diseases. However, the high worldwide prevalence of multiple MBL2 deficiency or low-producing alleles suggests the converse that MBL deficiency confers protection. To explore the underlying forces accounting for the high worldwide prevalence of MBL2 deficiency alleles, we characterized genetic diversity in and around the MBL2 genomic region in 1166 chromosomes from 24 worldwide populations. Our results clearly demonstrate that the patterns of MBL2 variation are compatible with neutral evolution, as opposed to negative, positive or balanced natural selection. The high worldwide frequencies of MBL2 alleles associated with the production of little or no protein therefore result exclusively from human migration and genetic drift. The evolutionary neutrality of MBL2 strongly supports the notion that MBL2 variation does not have strong effects on population fitness, suggesting, therefore, that this lectin is largely redundant in host human defences.
INTRODUCTION
Mannose-binding lectin (MBL) is thought to be a key player in the innate immune system because of its putative central role in host defence. MBL is a member of the collectin protein family that binds a broad range of microorganisms and activates the lectin-complement pathway (1–3). MBL thus enhances phagocytosis by binding to the cell-surface receptors present on phagocytic cells (2). Common alleles of MBL2, the gene encoding MBL on 10q21.1, disrupt the MBL protein or modulate the amount of protein produced (3). All these genetic polymorphisms are clustered in a region of strong linkage disequilibrium (LD) (4), the so-called secretor-haplotype region, covering the first exon and the 5′-untranslated and promoter regions of MBL2. Three independent coding mutations in exon 1 (alleles D, B and C, allele A being the wild-type at all three positions) dramatically reduce serum MBL concentration, by disrupting the collagenous structure of the protein (3,5). In addition, three regulatory variants in the promoter (alleles H/L and X/Y) and 5′-UTR (alleles P/Q) regions also influence final serum MBL concentration (3,6). Combinations of the coding and regulatory alleles result in seven widespread haplotypes: LYPB, LYQC and HYPD, resulting in the absence of MBL, LXPA giving low levels, LYPA, intermediate levels and HYPA and LYQA giving high levels (3).
The clinical consequences of MBL deficiency have been extensively studied over the last 17 years but the biological role of this lectin in human host defences remains a matter of debate (7,8). The immunological controversy arises from the apparently contradictory information generated by various clinical, genetic and epidemiological studies. In some studies, MBL was found to play a protective role in host defence, as the absence of MBL or low levels of MBL were associated with greater susceptibility to various infectious diseases (reviewed in 9). However, some of these associations were weak or preliminary, casting doubts on the clinical significance of MBL deficiency (7,8). Further controversy has arisen from population-based longitudinal studies showing that MBL deficiency in adults is not associated with a higher risk of morbidity and mortality due to infections (10). Furthermore, MBL deficiency in children leads to only a modest increase in the risk of respiratory disease, limited to the narrow age-window of 6–17 months (11). Thus, the clinical manifestations of MBL deficiency seem to be of greater importance during infancy, a vulnerable period in which the child's adaptive immune system is still immature.
In stark contrast, MBL has been also considered deleterious to human health, because its presence may favour some intracellular infections such as tuberculosis and leishmaniasis (12–14). Although never formally demonstrated as such, these observations have traditionally been interpreted as reflecting a selective advantage of low MBL levels (15,16). According to this interpretation, natural selection has targeted MBL2 deficiency haplotypes, keeping the frequency of these haplotypes high in the population. An alternative, and equally likely hypothesis to explain the high worldwide frequency of MBL2 alleles resulting in the production of little or no MBL, is evolutionary neutrality. According to this hypothesis, MBL2 deficiency alleles have no effect on population fitness and can therefore increase in frequency in human populations. This would suggest that MBL2 plays a redundant role in the human immune system.
Using an evolutionary approach, we tested these hypotheses (selective versus neutral) and explored the forces underlying the currently high worldwide prevalence of MBL2 alleles associated with the production of little or no MBL protein. Thus, we carried out a systematic screening of sequence diversity as well as single nucleotide polymorphism (SNP) genotyping in and around the MBL2 genomic region. Our results indicate that the patterns of diversity of MBL2 are compatible with neutral evolution and therefore provide evidence supporting a largely redundant role of MBL in human host defences.
RESULTS
Worldwide genetic and functional diversity of the MBL2 secretor-haplotype region
We characterized genetic diversity at the MBL2 secretor-haplotype region, which accounts for almost all phenotypic variation in plasma MBL concentration (3), in 1166 chromosomes from 24 different ethnologically well-defined populations (Table 1). The sequence of this genomic region, which includes the first exon and the 5′-UTR and promoter regions of MBL2 (Fig. 1), revealed a total of 38 polymorphic sites (i.e. 36 SNPs and two deletions) (Supplementary Material, Table S1). The promoter and 5′-UTR regions were found to contain 35 segregating sites, including the three previously described regulatory variants (−619C>G, −290C>G, −66C>T) (3,4,6). In exon 1, we identified only the three commonly observed coding variants: 154C>T (Arg→Cys), 161G>A (Gly→Asp) and 170G>A (Gly→Glu) (3). The frequency of the six functional alleles, which include the three regulatory variants and the three coding variants, was found to reach high frequencies worldwide (Table 2). Following haplotype reconstruction, we identified a total of 36 different haplotypes, with ∼98% of individuals phased with 95% confidence (Supplementary Material, Table S2). All of these haplotypes could be assigned to one of the seven known functional haplotypes (i.e. HYPA, LYQA, LYPA, LXPA, HYPD, LYPB and LYQC) (3,4), with the exception of two uncharacterized recombinant haplotypes (an LYQB haplotype in a Bakola Pygmy and a Sardinian and an HXPA haplotype in a Moroccan Berber). Worldwide, we observed 22% of deficiency haplotypes (i.e. haplotypes associated with null levels of MBL), 13% of low-producing haplotypes, 15% of intermediate-producing haplotypes and 49% of high-producing haplotypes (Fig. 2, Supplementary Material, Table S3). The deficiency haplotypes (HYPD, LYPB and LYQC) were observed at variable, high frequencies throughout the various geographic regions studied.
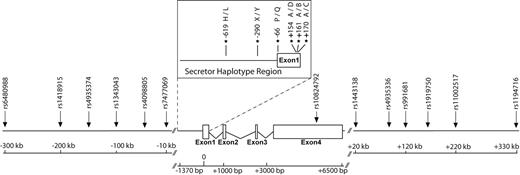
Scaled schematic representation of the entire MBL2 genomic region. The boxed secretor-haplotype region corresponds to the region sequenced in this study. Arrows indicate the position of genotyped SNPs.
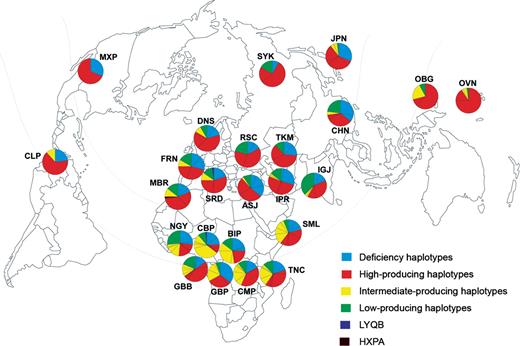
Worldwide distribution of MBL2 secretor haplotypes. Population codes are as reported in Table 1. Each secretor-haplotype segment in the pie chart (illustrated in different colors) is partitioned to reflect the internal degree of haplotype diversity. LYQB and HXPA are functionally uncharacterized haplotypes identified in this study.
General summary statistics in the 24 different worldwide populations
| Population | Code | Na | ηb | ηSc | πd | θWe | HDf |
|---|---|---|---|---|---|---|---|
| Gabonese Baka Pygmy | GBP | 48 | 11 | 2 | 21.4 | 15.9 | 0.779 |
| Cameroonese Bakola Pygmy | CBP | 62 | 17 | 5 | 18.1 | 23.2 | 0.831 |
| CARg Biaka Pygmy | BIP | 48 | 14 | 4 | 23.8 | 20.2 | 0.848 |
| DRCh Mbuti Pygmy | CMP | 48 | 13 | 5 | 21.5 | 18.8 | 0.792 |
| Gabonese Bantu | GBB | 64 | 19 | 5 | 23.8 | 25.8 | 0.809 |
| Nigerian Yoruba | NGY | 64 | 16 | 3 | 25.4 | 21.7 | 0.843 |
| Tanzanian Chagga | TNC | 64 | 19 | 4 | 26.8 | 25.8 | 0.877 |
| Somali | SML | 48 | 19 | 3 | 27.4 | 27.4 | 0.918 |
| Moroccan Berber | MBR | 48 | 12 | 2 | 24 | 17.3 | 0.8254 |
| African | AFR | 494 | 27 | 4 | 24.5 | 25.5 | 0.8706 |
| Ashkenazi Jewish | ASJ | 42 | 12 | 1 | 24.6 | 17.9 | 0.835 |
| Iranian Persian | IPR | 48 | 14 | 4 | 22.2 | 20.2 | 0.824 |
| Turkmen | TKM | 50 | 9 | 0 | 18.1 | 12.9 | 0.75 |
| Indian Gujarati | IGJ | 48 | 14 | 5 | 16.6 | 20.2 | 0.776 |
| South-West Asian | SWA | 188 | 16 | 3 | 20.7 | 17.7 | 0.8026 |
| Danish | DNS | 48 | 10 | 1 | 17.8 | 14.4 | 0.767 |
| French | FRN | 48 | 9 | 0 | 18.2 | 13 | 0.831 |
| Sardinian | SRD | 40 | 11 | 3 | 20.5 | 16.6 | 0.824 |
| Russian Chuvash | RSC | 48 | 9 | 0 | 19 | 13 | 0.749 |
| European | EUR | 184 | 13 | 4 | 18.7 | 14.4 | 0.7911 |
| Siberian Yakut | SYK | 48 | 8 | 0 | 16 | 11.6 | 0.627 |
| Japanese | JPN | 48 | 12 | 2 | 18.8 | 17.3 | 0.77 |
| Chinese | CHN | 48 | 13 | 2 | 14.3 | 18.8 | 0.782 |
| East Asian | EAS | 144 | 15 | 3 | 16.9 | 17.3 | 0.7544 |
| Oceanian Bougainville | OBG | 38 | 7 | 0 | 8.8 | 10.7 | 0.559 |
| Oceanian Vanuatu | OVN | 44 | 9 | 1 | 12.7 | 13.3 | 0.419 |
| Oceanian | OCN | 82 | 9 | 0 | 10.9 | 11.6 | 0.4929 |
| Mexican Pima | MXP | 48 | 2 | 0 | 5.6 | 2.9 | 0.439 |
| Colombian Piapoco | CLP | 26 | 4 | 0 | 8.1 | 6.7 | 0.526 |
| Native American | AMR | 74 | 4 | 0 | 6.5 | 5.3 | 0.4676 |
| Worldwide | 1166 | 36 | 9 | 22.3 | 30.2 | 0.8462 | |
Deletion polymorphisms were excluded for all these analyses.
aNumber of chromosomes.
bNumber of segregating sites.
cNumber of singletons.
dNucleotide diversity per base pair (×10−4).
eWatterson's estimate of theta per base pair (×10−4).
fHaplotype diversity.
gCentral African Republic.
hDemocratic Republic of Congo.
Frequencies (in %) of the six MBL2 functional variants in the different geographical regions studied
| SNP | dbSNP | Allelesa | Allele names | SNP typeb | Populationsc | |||||
|---|---|---|---|---|---|---|---|---|---|---|
| AFR | SWA | EUR | EAS | OCN | AMR | |||||
| −619 | rs11003125 | C/G | L/H | Promoter | 6.9 | 40.4 | 43.5 | 41.7 | 69.5 | 67.6 |
| −290 | rs7096206 | G/C | Y/X | Promoter | 12.3 | 18.6 | 14.7 | 8.3 | 4.9 | — |
| −66 | rs7095891 | C/T | P/Q | 5′-UTR | 46.4 | 23.4 | 22.3 | 15.3 | 12.2 | — |
| +154 | rs5030737 | C/T | A/D | NS (Arg>Cys) | — | 8.0 | 8.7 | — | — | — |
| +161 | rs1800450 | G/A | A/B | NS (Gly>Asp) | 4.2 | 14.9 | 13.6 | 25.0 | — | 28.4 |
| +170 | rs1800451 | G/A | A/C | NS (Gly>Glu) | 18.2 | 4.3 | 0.5 | — | — | — |
Frequencies are reported for the derived allele of each functional variant.
aThe first allele corresponds to the ancestral status (inferred from the chimpanzee sequence).
bNS stands for non-synonymous mutation.
cPopulation codes referring to broad geographical groups are as in Table 1.
The global variation observed in the secretor-haplotype region resulted in high levels of worldwide nucleotide diversity (π=22.3×10⁻⁴) (Table 1), whose spatial distribution follows the out-of-Africa model (17). Indeed, the MBL2 secretor-haplotype region was found to be most diverse in African populations at both nucleotide (π) and haplotype levels (Table 1, Fig. 2), followed by Eurasian, Pacific and Native American populations, consistent with the later arrival of modern humans in these regions (17). Interestingly, the highest levels of diversity were observed in the two East-African populations studied. This observation is consistent with the findings of previous studies on autosomal, Y-chromosome and mtDNA neutral markers, suggesting that modern humans originated in East Africa (17).
MBL2 diversity is compatible with neutral evolution
Evolutionary pressures generate a number of detectable signals at the locus under selection that are not present in regions of the genome evolving under neutrality. According to population genetics theory, positive selection significantly increases the proportion of low-frequency alleles, whereas balancing selection results in an excess of intermediate-frequency alleles (18,19). We searched for such molecular signatures of natural selection in the MBL2 secretor-haplotype region by carrying out a number of sequence-based neutrality tests, such as Tajima's D, Fu's Fs, Fu and Li's F*, D*, F and D and Fay and Wu's H tests (reviewed in 19,20), in the 24 different populations. In addition, in order not to loose any potential signature of natural selection affecting broad continental groups, we performed these tests by grouping populations into six major geographical regions (i.e. Africa, South-West Asia, Europe, East Asia, Oceania and America) (Table 3). Out of the 210 tests performed, the null hypothesis of neutral evolution was rejected in only one of these tests, a Fay and Wu's H test for the Pacific population of Bougainville (H=−2.98, P=0.03), that was no longer significant after Bonferroni correction for multiple testing (P>0.05).
Sequence-based neutrality tests for the MBL2 secretor-haplotype region
| Populationa | Nb | ηc | Tajima's D | Fu's Fs | Fu and Li's D* | Fu and Li's F* | Fu and Li's D | Fu and Li's F | Fay and Wu's H |
|---|---|---|---|---|---|---|---|---|---|
| GBP | 48 | 11 | 1.01 | 2.25 | 0.30 | 0.63 | 0.29 | 0.64 | 0.08 |
| CBP | 62 | 17 | −0.67 | −2.16 | −0.59 | −0.73 | −0.66 | −0.80 | −0.27 |
| BIP | 48 | 14 | 0.53 | 0.43 | −0.37 | −0.08 | −0.44 | −0.12 | 0.99 |
| CMP | 48 | 13 | 0.00 | 0.71 | −1.01 | −0.64 | −1.13 | −0.70 | 0.67 |
| GBB | 64 | 19 | −0.24 | −0.79 | −0.38 | −0.39 | −0.44 | −0.44 | −1.10 |
| NGY | 64 | 16 | 0.50 | 0.69 | 0.20 | 0.37 | 0.19 | 0.37 | 1.18 |
| TNC | 64 | 19 | 0.12 | −0.82 | 0.03 | 0.78 | 0.45 | 0.40 | −0.56 |
| SML | 48 | 19 | −0.01 | −0.87 | 0.52 | 0.40 | 0.54 | 0.41 | −0.06 |
| MBR | 48 | 12 | 1.15 | 1.17 | 0.41 | 0.77 | 0.40 | 0.79 | 1.04 |
| AFR | 494 | 27 | −0.10 | −2.36 | −0.004 | −0.06 | −0.008 | −0.06 | −0.70 |
| ASJ | 42 | 12 | 1.14 | 1.72 | 0.96 | 1.20 | 1.00 | 1.26 | 0.89 |
| IPR | 48 | 14 | 0.31 | 0.17 | −0.37 | −0.17 | −0.44 | −0.21 | 0.56 |
| TKM | 50 | 9 | 1.12 | 3.62 | 1.35 | 1.50 | 1.40 | 1.56 | −0.73 |
| IGJ | 48 | 14 | −0.54 | 0.44 | −0.85 | −0.88 | −0.96 | −0.97 | −1.24 |
| SWA | 188 | 16 | 0.44 | 1.09 | −0.13 | 0.10 | −0.15 | 0.10 | 0.07 |
| DNS | 48 | 10 | 0.66 | 1.46 | 0.79 | 0.88 | 0.81 | 0.91 | −0.67 |
| FRN | 48 | 9 | 1.12 | 2.46 | 1.35 | 1.50 | 1.41 | 1.56 | −0.54 |
| SRD | 40 | 11 | 0.72 | 0.88 | −0.19 | 0.12 | 0.35 | 0.56 | −1.71 |
| RSC | 48 | 9 | 1.30 | 3.80 | 1.35 | 1.57 | 1.41 | 1.63 | −0.37 |
| EUR | 184 | 13 | 0.75 | 1.75 | −1.15 | −0.53 | −0.51 | −0.04 | −2.27 |
| SYK | 48 | 8 | 1.06 | 4.27 | 1.30 | 1.44 | 1.35 | 1.49 | −1.13 |
| JPN | 48 | 12 | 0.25 | 0.90 | 0.41 | 0.42 | 0.40 | 0.42 | −0.40 |
| CHN | 48 | 13 | −0.72 | −0.10 | 0.50 | 0.11 | 0.51 | 0.10 | −1.96 |
| EAS | 144 | 15 | −0.07 | 0.28 | −0.16 | −0.15 | −0.18 | −0.16 | −0.92 |
| OBG | 38 | 7 | −0.49 | 1.52 | 1.26 | 0.84 | 1.30 | 0.87 | −2.98d |
| OVN | 44 | 9 | −0.13 | 1.85 | 0.72 | 0.52 | 0.73 | 0.53 | −2.23 |
| OCN | 82 | 9 | −0.15 | 2.12 | 1.33 | 0.98 | 1.36 | 0.99 | −2.49 |
| MXP | 48 | 2 | 1.71 | 3.41 | 0.75 | 1.20 | 0.75 | 1.20 | −0.29 |
| CLP | 26 | 4 | 0.55 | 2.12 | 1.07 | 1.07 | 1.09 | 1.10 | 0.21 |
| AMR | 74 | 4 | 0.50 | 2.50 | 0.97 | 0.96 | 0.97 | 0.97 | −0.08 |
The chimpanzee sequence was used as outgroup for Fu and Li's D and F and Fay and Wu's H tests of neutrality. P-values for the various tests were estimated from 104 coalescent simulations under an infinite-site neutral model of evolution with no recombination.
aPopulation codes are as in Table 1.
bNumber of sequenced chromosomes.
cNumber of polymorphic sites.
dP<0.05.
The sequence-based neutrality tests are designed to unmask the effects of natural selection over a genomic region without identifying the alleles subject to selection. Moreover, they have been shown to present low power when it comes to detect recent selection (21). In this context, the LD-based long-range haplotype (LRH) test has been shown to be very powerful in detecting more subtle signatures of selection in an allele-specific manner (21). This test was designed to identify mutations/haplotypes under recent positive selection, by comparing the frequency of a given allele with the breakdown of LD around it. In conditions of simple genetic drift, a new mutation requires a long time to reach a high frequency in the population, making it possible to break down the haplotype in which the mutation appeared, through recombination. Under positive selection, the time required for a selected mutation to reach a high frequency is much shorter, so the level of LD in the flanking regions is much higher than that for neutral variants with a similar frequency.
We tested for signatures of selection targeting the MBL2 secretor-haplotypes directly, by evaluating the extent of LD surrounding the ‘core secretor-haplotype region’ (i.e. composed of the three regulatory and three coding variants). This was achieved by genotyping 13 additional SNPs, covering a region of ∼600 kb around the gene (Fig. 1). A background neutral distribution based on the expected demographic parameters of human populations was generated separately for Africans and non-Africans, by simulating ∼1 Mb regions under a neutral coalescent model with recombination (22,23). Again, we observed no significant departure from neutrality for any of the secretor haplotypes, suggesting that these haplotypes, which account for the absence or low levels of MBL, have not been targeted by recent positive selection (Fig. 3).
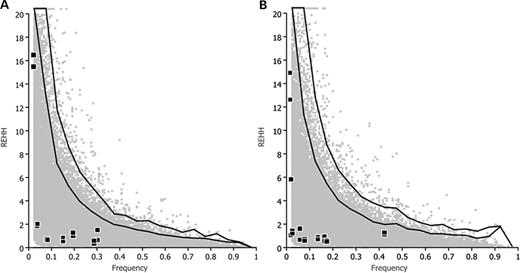
REHH, calculated 300 kb (5′ and 3′) from the MBL2 secretor-haplotype region, plotted against MBL2 core haplotype frequencies. Black squares represent the results for (A) African core haplotypes and (B) non-African core haplotypes, plotted against simulated distributions (gray dots). From bottom to top, black lines indicate the 95 and 99% percentiles of the simulated distribution.
Selective constraints on MBL2 were relaxed after human speciation
In view of the neutral pattern observed for the human MBL2 secretor-haplotype region, we sought to assess the selective pressures acting on this gene at the interspecies level. We calculated the interspecific ratios of fixed non-synonymous mutations per non-synonymous site (dN) and fixed synonymous mutations per synonymous site (dS) across primate species of the Hominid family (Fig. 4). We focussed our analysis on the first exon of the gene, which contains the three coding variants leading to MBL deficiency. Overall, we detected strong amino acid conservation in the secretor-haplotype region throughout the evolution of Hominids, as attested by the dN/dS values, which were systematically less than 1 (Fig. 4). These observations are consistent with a previous study based on pairwise comparisons of the MBL2 coding region across 12 primate species (24). The high levels of amino acid conservation observed were particularly clear for the Pan and Homo lineages, which showed no fixed differences in exon 1 (100% nucleotide identity), making it impossible to calculate a dN/dS ratio (Fig. 4). Regions showing high levels of conservation across species, such as the first exon of MBL2, would also be expected to display low levels of within-species diversity (19). The high level of amino acid diversity in humans is at odds with this prediction and is thus best accounted for by a relaxation of selective constraints in the human lineage.
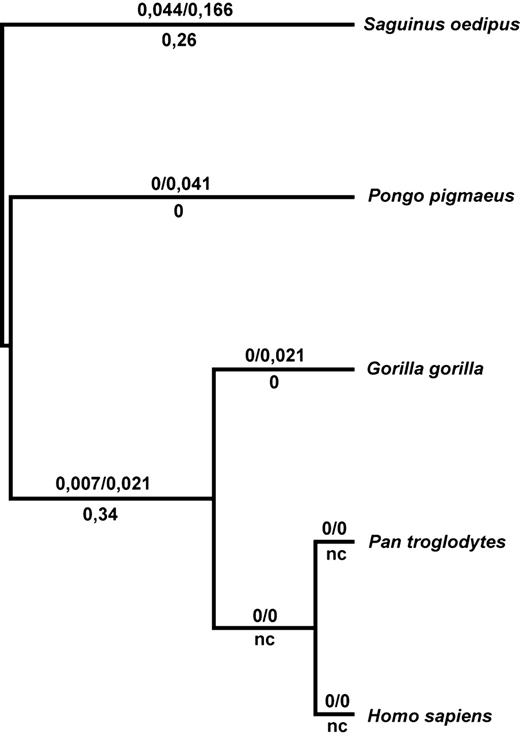
Neighbor-joining tree based on the first exon of MBL2 for five Hominid species, using Saguinus fascicularis as an outgroup. The numbers shown above each branch are estimates of dN and dS, respectively, and dN/dS ratios are reported below. ‘nc’, non-computable.
We investigated whether the pattern observed in humans was shared with our closest relatives, the chimpanzees, by sequencing the MBL2 orthologous region from a panel of 34 chromosomes from unrelated chimpanzees. Interestingly, despite the similar levels of nucleotide diversity in the MBL2 non-coding regions (i.e. promoter and 5′-UTR) in humans and chimpanzees (πHomo=22.4×10⁻⁴ versus πPan=24.3×10⁻⁴), a clear contrast in coding nucleotide diversity was observed between the two species (πHomo=21.3×10⁻⁴ versus πPan=0; Supplementary Material, Table S4). We reasoned that the complete lack of coding polymorphisms detected in exon 1 in chimpanzees, as opposed to the three common non-synonymous polymorphisms observed in humans, might be due to differences in sample size (34 chimpanzee chromosomes versus 1166 human chromosomes). We thus generated 1000 independent samples, each containing 34 human chromosomes randomly re-sampled from the initial collection of 1166 human chromosomes. None of the re-sampled groups presented a complete absence of coding variants in exon 1, as observed for chimpanzees. Indeed, the average number of coding variants observed in the 1000 data sets of 34 randomly chosen human chromosomes was estimated to be between 2.50 and 2.57, with 95% confidence. Thus, our data suggest that the selective constraints acting on MBL2 were relaxed after human speciation. In contrast, selective constraints continue to operate on MBL2 in chimpanzees, consistent with the general pattern observed during Hominid evolution.
DISCUSSION
In this work, we characterized genetic diversity at the MBL2 genomic region in 1166 chromosomes from 24 ethnologically well-defined populations, representing the first systematic screening of MBL2 worldwide diversity. The overall variation observed resulted in levels of nucleotide diversity (π=22.3×10⁻⁴), which are three times the average estimate for the human genome (π=7.51×10⁻⁴) and exceeds the upper limit of the 95% interval defined by the SNP consortium (π=2×10⁻⁴−15.8×10⁻⁴) (25). This observation and the high worldwide frequencies of MBL2 deficiency haplotypes could be consistent with balancing selection (i.e. heterozygote advantage) acting on MBL2, as this type of selection is known to inflate overall levels of diversity (18,19). Alternatively, MBL2 may be subject to neutral evolution, according to which, the spread of MBL2 deficiency alleles results solely from human migration and genetic drift. In this case, the high nucleotide diversity values observed at this locus would have arisen by chance, within the upper 5% boundary of the genomewide distribution of π. To formally address this question, we performed the Hudson/Kreitman/Aguadé (HKA) test that asks whether the levels of intraspecific polymorphism and interspecific divergence are consistent with neutral expectations (26). A multilocus version of the HKA test was applied to our data to compare the levels of diversity of MBL2 with those observed at 10 unlinked non-coding regions (27). No significant departures from the neutral expectations were observed in any of the geographical regions considered, indicating that the patterns of MBL2 diversity are compatible with those observed at neutrally evolving loci (Table 4).
Results of the multilocus HKA test of MBL2 against 10 unlinked non-coding regions
| Population | Maximum deviationa | χ2-approximation P-valueb | Simulation-based P-valuec |
|---|---|---|---|
| African | 2.93 | 0.09 | 0.69 |
| European | 1.88 | 0.17 | 0.52 |
| East Asian | 3.39 | 0.07 | 0.14 |
| Population | Maximum deviationa | χ2-approximation P-valueb | Simulation-based P-valuec |
|---|---|---|---|
| African | 2.93 | 0.09 | 0.69 |
| European | 1.88 | 0.17 | 0.52 |
| East Asian | 3.39 | 0.07 | 0.14 |
The test was performed for the three major geographical regions, for which sequence data from 10 non-coding regions evolving under neutrality were available (27).
aLargest observed deviation value (i.e. difference between expected and observed values) regardless of whether the observation corresponds to polymorphism or divergence levels.
bObtained P-values assuming that deviation values approximate a χ2 distribution with one degree of freedom.
cProportion of simulated deviation values (i.e. 10 000 simulations under neutral assumptions) larger than the observed deviation.
An additional population-based analytical approach for distinguishing between selective and neutral evolution involves comparing the genetic distances among sampled populations, as quantified by the FST statistic. Natural selection acts in a locus-specific manner and can cause systematic distortions of population genetic distances for a targeted gene. Generally, local positive selection tends to increase population FST values, whereas balancing selection tends to decrease population distances (18,19). In contrast, in neutral evolution conditions, FST values are influenced only by genetic drift and migration, which affect all loci throughout the genome in a similar, predictable fashion. When calculating genetic distances for our 24 worldwide populations, we obtained an overall FST of 13.3%, which is consistent with the expectations for neutral evolution based on average genomewide FST estimates (10–15%) (17,18,28). Thus, population genetic distances as well as the geographic clines observed in diversity values (Table 1) are all consistent with the commonly accepted out-of-Africa model, with no need for selective pressures to account for the observed patterns.
Several lines of evidence further privilege the hypothesis of the relaxation of selective constraints on human MBL2 to explain the accumulation of deficiency alleles at the population level. The results of our sequence-based neutrality tests clearly indicated that the MBL2 secretor-haplotype region follows a pattern compatible with evolutionary neutrality, either at the local population scale or when considering broad geographical groups (Table 3). These data are, however, at odds with a recent study in which the 10 kb MBL2 region was sequenced in four cosmopolitan populations from the USA (4). On the basis of the significantly positive Tajima's D and Fu and Li's F* values obtained for a sample of 31 Caucasian individuals, the authors concluded that this region was subject to balancing selection. We re-analyzed the data published by Bernig et al. (4) and calculated Tajima's D and Fu and Li's F* statistics, restricting the analysis to the 1560 bp region sequenced in our study, to make the two data sets comparable. Both statistics remained significant in the US Caucasian sample (P<0.05). Thus, the discrepancy between the two data sets cansnot be accounted for by a loss of power associated with the design of our study, which focussed directly on the MBL2 secretor-haplotype region. The differences between the two studies probably reflect population subdivision in the small cosmopolitan sample of diverse European ancestries in the study by Bernig et al. (4). Indeed, such a demographic regime may bias these statistics towards significant positive values (20). Further support to the pattern of evolutionary neutrality depicted by our sequence-based neutrality tests comes from the LD-based LRH test, which did not provide evidence pointing to a selective advantage of the secretor haplotypes leading to null or low MBL levels (Fig. 3). Thus, the patterns of MBL2 variation support the notion that, after the human–chimpanzee divergence, the selective constraints acting on MBL were relaxed in humans allowing MBL2 deficiency alleles to increase in frequency in human populations. At this point, it is important to highlight that a pattern of evolutionary neutrality can also be accounted by insufficient power of the existing neutrality tests. However, all our tests at the intra (sequence-based and LD-based) and inter-specific levels point to the same direction, that is, an absence of major selective forces having shaped the patterns of variability of MBL2 in humans.
Our results, which clearly contest the traditional view of a strong selective advantage of low MBL levels (15,16), have important implications in the context of the long-debated, and highly controversial, role of MBL in host defence (7,8). Parallels between the expected evolutionary patterns of MBL2 and its immunological relevance should be considered here. If MBL plays an essential role in protective immunity, then we would expect MBL2 deficiency alleles to be selectively removed at the population level, which is clearly not the case. If the presence of MBL is detrimental, then we would expect MBL2 deficiency haplotypes to be favored and subject to positive selection, which might account for the high population frequencies of deficiency alleles. Also, the presence, in most populations, of both deficiency and wild-type MBL2 haplotypes may result from a more general pattern of balancing selection, favoring heterozygous individuals presenting intermediate MBL levels. Our results are not consistent with any of these selective regimes and show instead that the genetic variants accounting for MBL phenotypic variation have not probably been subject to natural selection, whether positive, negative or balanced. Thus, the worldwide distribution of MBL2 secretor haplotypes simply reflects the demographic history of human migrations and the effects of genetic drift.
The evolutionary neutrality of MBL2 provides novel insights that inform the long-standing debate as to whether MBL is protective, deleterious or both and suggests instead that this lectin is largely redundant in human defences. In a context of immunological redundancy, MBL2 deficiency alleles have freely increased in frequency in human populations because, in the absence of MBL or low presence of MBL, alternative mechanisms of target recognition may guarantee sufficiently high levels of antimicrobial protection. Indeed, it has been shown that other molecules or pathways, such as the ficolins, the C1q-dependent classical pathway and/or the alternative complement amplification loop pathway may compensate MBL deficiency (29–31). It is, however, important to emphasize that the pattern of evolutionary neutrality observed at MBL2 does not inexorably imply that MBL is functionally irrelevant. Our data clearly show that MBL has not played a major role at the population level but they do not exclude, for example, a possible role of this lectin in coexistent morbidity. Indeed, MBL may play a compensatory role or may act as a disease modifier in individuals who are already immunocompromised and present deficiencies, such as common variable immune deficiency, chemotherapy-induced neutropenia or properdin deficiency (32–34). More generally, the integration of MBL2 population genetics data into a medical framework neatly illustrates the value of the evolutionary approach for determining the ecological relevance of genes in immunity to infection.
MATERIALS AND METHODS
DNA samples
Variation at the MBL2 locus was defined in 247 Africans, 94 South-West Asians, 92 Europeans, 72 East Asians, 41 Oceanians and 37 Americans, giving a total of 583 individuals. Details on the composition of these populations from around the world are reported in Table 1. All individuals were healthy blood donors from whom informed consent was obtained. The orthologous MBL2 region was also sequenced in 17 chimpanzees (Pan troglodytes) from Western and Central Africa.
Sequencing and genotyping data
We sequenced the MBL2 secretor-haplotype region, covering a total of 1560 bp in each individual (Fig. 1). Human primers were used to amplify both human and chimpanzee sequences (primer sequences and PCR conditions are available upon request). All nucleotide sequences were obtained using the Big Dye Terminator kit and an Applied Biosystems 3100 automated sequencer. Sequence files and chromatograms were analyzed with GENALYS software (v. 2.0, http://software.cng.fr/). As a quality control measure, amplification and sequencing were repeated for all singletons. The 13 genotyped SNPs (Fig. 1) were chosen from dbSNP (http://www.ncbi.nlm.nih.gov/projects/SNP/) and HapMap (http://www.hapmap.org/) databases, on the basis of their minor allele frequencies >20%. Genotyping was carried out by fluorescence polarization (VICTOR-2TM Technology; PerkinElmer, Wellesley, CA, USA) or TaqMan (ABI Prism-7000 Sequence Detection System; Applied Biosystems, Foster City, CA, USA) assays.
Statistical analyses
Haplotypes were reconstructed from unphased genotypic data using the Bayesian method (35) implemented in PHASE software (v2.1, http://www.stat.washington.edu/stephens/software.html). Summary statistics (π, θW) were calculated and sequence-based neutrality tests (19,20) were performed with the DnaSP package (36) (v. 4.1, http://www.ub.es/dnasp/). Deletion polymorphisms were excluded for all these analyses. P-values for the various tests were estimated from 104 coalescent simulations under an infinite-site neutral model of evolution with no recombination. The multilocus HKA test was performed by means of the HKA computer program (http://lifesci.rutgers.edu/~heylab/HeylabSoftware.htm#HKA) and using sequence data from 10 unlinked non-coding regions assumed to evolve under neutrality (27). The significance of the test was conducted using both coalescent simulations and a conventional χ2 approximation. Genetic distances between populations (FST) were estimated using the Arlequin package (v. 3.0, http://cmpg.unibe.ch/software/arlequin3/). To perform the LRH test (21), we assessed for each core secretor haplotype its relative extended haplotype homozygozity (REHH) 300 kb apart (5′ and 3′) from the MBL2 core secretor-haplotype region. The background neutral distribution was obtained by simulating ∼1 Mb regions under a neutral coalescent model with recombination (22) using previously described parameters for African and non-African populations (23). For the African data set, the seven core haplotypes (14 one-sided tests) were tested against ∼59 000 simulated African core haplotypes, and for the non-African data set, the nine core haplotypes (18 one-sided tests) were tested against ∼46 000 simulated non-African core haplotypes. For inter-specific comparisons, we calculated a neighbor-joining tree using the PHYLIP package (v. 3.65, http://evolution.genetics.washington.edu/phylip.html). We reconstructed the best possible now-extinct ancestral sequences at each node of the phylogenetic tree, using the maximum-likelihood method (37) implemented in PAML software (v. 3.15, http://abacus.gene.ucl.ac.uk/software/paml.html). The dN/dS ratios between observed and reconstructed sequences were calculated with the DnaSP package (36).
SUPPLEMENTARY MATERIAL
Supplementary Material is available at HMG Online.
ACKNOWLEDGEMENTS
We warmly thank Guillaume Laval and Olivier Neyrolles for critical reading of the manuscript and the following investigators who collected various samples and made them available to us: Dr.F. Okonofua (for Nigerian Yoruba), Dr S. Kajuna (for Tanzanian Chagga), Dr J. Parnas (for Danes) and Dr E. Grigorenko (for Russian Chuvash). We also acknowledge two anonymous reviewers for constructive criticisms. This work was supported in part by the CNRS and Institut Pasteur research funding and by an Agence Nationale de la Recherche (ANR) research grant (ANR-05-JCJC-0124-01) to L.Q.-M and by a USPHS grant GM57672 to K.K.K. and J.R.K. J.-L.C. is an International Scholar of the Howard Hughes Medical Institute.
Conflict of Interest statement. The authors state that they have no conflicts of interest with this work.
REFERENCES
Author notes
The authors wish it to be known that, in their opinion, the first two authors should be regarded as joint First Authors.
