


Abstract
The role of BRCA1 in breast and ovarian tumor suppression has been primarily ascribed to the maintenance of genome integrity. BRCA1 interacts with components of the non-homologous end-joining pathway previously shown to play a role in telomere maintenance in yeast. Here, we provide evidence that links Brca1 with telomere integrity. Brca1−/− T-cells display telomere dysfunction in both loss of telomere repeats as well as defective telomere capping. Loss of Brca1 synergizes with p53 deficiency in the onset and frequency of tumorigenesis. Karyotyping of tBrca1−/−p53−/− thymic lymphomas revealed the presence of telomere dysfunction accompanied by clonal chromosomal translocations. The telomere dysfunction phenotype in Brca1-deficient cells suggests that loss of telomere integrity might contribute to chromosome end dysfunction and permit the formation of potentially oncogenic translocations.
INTRODUCTION
Mutations in the breast cancer susceptibility gene BRCA1 confer genetic predisposition to early-onset familial breast and ovarian cancer (1). Although the BRCA1 protein has been shown to impact the maintenance of genome integrity, transcriptional regulation and chromatin remodeling, the exact mechanism responsible for the tumor suppressor function of BRCA1 remains unknown (1,2). BRCA1-associated mammary gland tumors in humans and murine cells deficient in Brca1 exhibit genomic imbalances and chromosomal aberrations that are hallmarks of genomic instability (1,3,4). As elevated frequencies of chromosomal aberrations are correlated with an increased risk for cancer, the tumor suppressor function of BRCA1 has been linked to its role in genome surveillance. However, dissection of the role of BRCA1 in maintaining genome integrity has been complicated by studies that link BRCA1 to multiple DNA repair pathways, such as homologous-recombinational repair (5), non-homologous end joining (6) and nucleotide excision repair (7).
The study of BRCA1 function in vivo is complicated by its essential role in cellular viability, in that disruption of Brca1 in the absence of additional compensatory mutations results in lethality (3,8–11). Mice that are tBrca1−/− carry a targeted null mutation of Brca1 restricted to the T-cell compartment, resulting in a drastic depletion of thymocytes and peripheral T-cells, the accumulation of chromosomal abnormalities and activation of p53 (12). Thymocyte development in tBrca1−/− mice is restored in the absence of p53 or the presence of overexpressed Bcl2. As perturbations in telomere length and/or structure have been identified as mechanisms that contribute to genomic instability (13–15), tBrca1−/− cells in the absence of p53 or the presence of overexpressed Bcl2 were analyzed for chromosomal telomere integrity and the presence of telomere-associated chromosomal damage.
RESULTS
Proliferation and developmental defects of Brca1−/− T-cells complicate the analysis of mature T-cells (12). Accordingly, ex vivo analysis of Brca1−/− T-cells was performed in bcl2 transgenic or p53 nullizygous backgrounds which rescue thymic development. In order to assess whether Brca1 disruption impacts telomere integrity, the length of telomeric TTAGGG repeats in activated peripheral T-cells from tBrca1−/−p53−/− mice and p53−/− mice were measured using quantitative fluorescence in situ hybridization (qFISH) (16). This methodology facilitates the quantitation of telomere repeat sequences from individual chromosome ends and the subsequent analysis of telomeric length distribution, as murine telomeres have large inter-chromosomal variations in the number of TTAGGG repeats. Analysis was conducted on metaphase chromosome spreads prepared using activated peripheral T-cells from sibling cohorts consisting of one tBrca1−/−p53−/− mouse and one p53−/− mouse, for a total of three different cohorts (Fig. 1A and Table 1). In all three cohorts, the average length of telomeres from the tBrca1−/−p53−/− peripheral T-cells was reduced when compared with the p53−/− controls. T-cells from p53−/− mice have equivalent telomere lengths when compared with cells from wild-type mice (Fig. 1A). The absence of p53 was not required for the observed reduction in telomere length in tBrca1−/− T-cells, as loss of telomere repeats was also observed in tBrca1−/− cells in a transgenic bcl2 background when compared with controls (Fig. 1A and Table 1). Unlike tBrca1−/−p53−/− peripheral T-cells, tBrca1−/− bcl2 T-cells exhibit a profound proliferation block in response to activation. tBrca1−/− bcl2 T-cells displayed a less dramatic yet reproducible decrease in average telomere length when compared with bcl2 T-cell controls. The greater reduction in telomeric sequence in the concomitant absence of p53 might reflect the more efficient elimination of cells with shorter telomeres in the presence of a p53-dependent damage response (17). Similar studies performed on these cells using flow-FISH were consistent with data obtained using qFISH (data not shown). Taken together, these findings indicate a role for Brca1 in maintenance of telomere length.
Telomerase activity was observed in tBrca1−/−p53−/− and p53−/− cells (data not shown), suggesting that telomere erosion was not due to a lack of telomerase activity. There were no obvious alterations in the subcellular localization of TRF1 and TRF2 to punctate nuclear foci (18,19) by indirect immunofluorescence of tBrca1−/−p53−/− cells compared to p53−/− cells (data not shown). Telomere termini end in G-rich single-stranded 3′-overhangs that are required for proper telomere structure and protect against chromosomal end-to-end fusions (19,20). The integrity of telomeric 3′-overhangs was assayed in genomic DNA from tBrca1−/−p53−/− and p53−/− activated T-cells using non-denaturing in-gel hybridization (20). Single-stranded 3′-overhangs were detected in genomic DNA from both tBrca1−/−p53−/− and p53−/− cells, as demonstrated by the stepwise reduction of signal following incubation with increasing amounts of the single-strand-specific Mung Bean nuclease (Fig. 1B). To ensure the integrity of double-stranded genomic DNA following nuclease treatment, the same probe recognized telomere restriction fragments following denaturation of the same gel and subsequent hybridization (Fig. 1C). Quantitative analyses from four independent experimental sets did not reveal any significant difference in the integrity of single-stranded 3′-overhangs from tBrca1−/−p53−/− and p53−/− activated T-cells (representative experiments depicted in Fig. 1B–C).
Metaphases from tBrca1−/− bcl2 and tBrca1−/−p53−/− activated T-cells show a marked increased incidence of end-to-end fusions (ring chromosomes, dicentric chromosomes and Robertsonian fusions) when compared with bcl2 and p53−/− T-cells, respectively (Fig. 1D–I and Table 2). Of note, end-to-end fusions with detectable telomere signal at the fusion point are markedly increased (Table 2), suggestive of defective telomere capping (13). Mammalian cells with dysfunctional telomeres display increased frequency of anaphase chromosome bridges (19,21). Interestingly, the frequency of anaphase bridges per mitotic events was found to be elevated in tBrca1−/−p53−/− cells (50.7±1.8%) when compared with p53−/− cells (13.3±2.3%) (Fig. 1J–K). The increased accumulation of chromosomal fragments detected in tBrca1−/−bcl2 and tBrca1−/−p53−/− cells (Table 2) could be the result of catastrophic mitotic shearing in cells with fused chromosomes (19,22).
In the thymus, Brca1 and p53 mutations were found to potentiate the formation of thymic lymphomas (23). All tBrca1−/−p53−/− mice develop CD4+CD8+ thymic lymphomas (Fig. 2A) and are moribund or die at a decreased latency (91±41 days, mean age±SD, n=20) when compared with tBrca1+/−p53−/− mice (179±80 days, n=20) and p53−/− mice (155±90 days, n=15), which develop thymic lymphomas or other tumors. A small subset of tBrca1−/−p53+/− animals (<10%) also developed tumors with an onset similar to tBrca1−/−p53−/− animals. Southern blot analysis of all tBrca1−/−p53+/− thymic lymphomas examined shows loss of the remaining wild-type p53 allele (Fig. 2B). A low incidence (<5%) of T-cell lymphomas was observed in tBrca1−/− mice in peripheral organs of older animals (∼1-year-old). No difference in tumor incidence or onset was observed in tBrca1−/−bcl2 mice when compared with bcl2 controls (data not shown). These findings suggest that p53 tumor suppressor function is stringently enforced in tBrca1−/− and tBrca1−/−bcl2 cells and that loss of p53 is required for thymic lymphoma development.
The accelerated onset and increased frequency of tumorigenesis observed in tBrca1−/−p53−/− mice prompted the examination of telomere integrity and chromosomal structure in tBrca1−/−p53−/− thymomas. FISH revealed loss of telomere sequence from chromosome ends of tBrca1−/−p53−/− tumors (Fig. 2C, F and G). In addition, numerous chromosomal translocations were identified with fusions containing readily detectable interstitial telomeric DNA (Fig. 2F), as well as dicentric chromosomes and Robertsonian-like fusions with either trace amounts (Fig. 2D and E) or no detectable telomeric DNA at the fusion point. Analysis of chromosome structure by spectral karyotyping (SKY) (24) of thymic lymphoma cells from three different tBrca1−/−p53−/− animals revealed the presence of clonal reciprocal and non-reciprocal chromosomal translocations (Fig. 2H–N and Table 3) that are not typically observed in p53−/− thymic lymphomas (22). SKY analysis of tBrca1−/−p53−/− peripheral T-cells revealed the presence of only non-clonal chromosomal translocations, with an absence of any translocation events in p53−/− peripheral T-cells (Fig. 3).
DISCUSSION
Telomeres are chromosomal elements that serve a protective function in the maintenance of genome stability by suppressing erosion and/or ligation of chromosome ends (13). Chromosomes with defective telomere length and/or structure are more susceptible to forming end-to-end fusions that fail to segregate properly in mitosis, resulting in chromosomal breakage accumulation and DNA damage checkpoint activation. The addition of telomeric tracts by telomerase compensates for the progressive loss of telomeric sequences from successive rounds of DNA replication.
Here, we provide evidence suggesting that Brca1 participates in the maintenance of telomere integrity. Furthermore, the observed telomere erosion phenotype in tBrca1−/− cells could conceivably precipitate genomic instability and p53 activation following Brca1 disruption, which contribute to the observed defects in development, survival and proliferation (12). The mechanism whereby Brca1 loss precipitates telomere loss is not understood and appears to occur independent of factors that have been previously identified as regulators of telomere length and structure. The increased accumulation of chromosomal fragments detected in tBrca1−/−bcl2 and tBrca1−/−p53−/− cells (Table 2) could be the result of catastrophic mitotic shearing in cells with fused chromosomes (19,22). Tri- and quadric-radial configurations in tBrca1−/−bcl2 and tBrca1−/−p53−/− cells are a consequence of reciprocal exchange of double-stranded DNA, leading to chromatid exchange. The appearance of these structures has not been reported to occur as a consequence of telomere erosion and may reflect a telomere-independent mechanism of genomic instability, as Brca1 normally interacts with components of multiple DNA repair pathways (5,6,25). However, the formation of such structures has been observed to persist in telomerase-negative fibroblasts following exposure to γ-irradiation (26). Although our experimental approach does not distinguish the temporal relationship between loss of telomeres and onset of genome instability in Brca1-deficient cells, compelling evidence for telomere dysfunction contributing to genomic instability has been reported in yeast (27).
As Brca1 has been implicated in several apparently distinct processes that could impact genomic integrity, we are presently unable to dissect using our experimental approach which cellular process contributes to the Brca1 effect on telomere integrity. Several lines of evidence support a role for Brca1 in recombinational processes (5,25,28). The fact that Brca1 deficiency results in a generation-independent telomere shortening suggests that Brca1 could be involved in a telomerase-independent pathway of telomere maintenance that involves recombination (reviewed in 29,30). Components of the DNA damage response associated with DNA end-to-end joining or homologous recombination have been proposed to mediate alterations in telomere structure believed to be required for telomerase access (13–15). These activities have also been linked to ‘telomere rapid deletion’ in yeast, which has been proposed to reset telomere size during meiosis (31). Telomere rapid deletion has been defined as an end-mediated intrachromatid homologous-recombination event that results in a deleted telomere and a linear or circular by-product (31). Both Rad50 and Mre11 are required for telomere maintenance in yeast (32–36), and hypomorphic Rad50 mutant mice have been shown to exhibit attrition of telomere sequence in first-generation animals similar to Brca1-deficient cells (37). The components of the Mre11/Rad50/Nbs1 complex have been found to associate with the telomere binding proteins TRF1 and TRF2 (38,39). Previous studies have demonstrated interaction of human Mre11/Rad50/Nbs1 protein complex with Brca1 (40) consistent with a role in recombinational DNA repair (41,42). Further studies will be required to establish whether the attrition of telomere sequences observed in our studies of Brca1-deficient T-cells is related to telomere maintenance associated with Mre11/Rad50/Nbs1 or other components of the DNA damage response pathway. Mammalian recombination-repair molecules DNA-PKcs (43–45), Ku (43,46–50) and PARP-1 (51) have been shown to be critical for maintenance of telomere integrity. Furthermore, recent studies of telomerase and the telomere proteins RIF1 and TRF2 have demonstrated broader roles in general DNA repair processes (52–54).
Telomere shortening in the absence of p53 has been previously shown to cooperate in tumorigenesis (17,22). The presence of clonal rearrangements in all tumors analyzed (Table 3) together with the presence of only non-clonal translocations in peripheral tBrca1−/−p53−/− T-cells (Fig. 3) suggests that these rearrangements accelerate tumorigenesis observed in the thymus. Hence, loss of both Brca1 and p53 increases the propensity for formation of chromosomal translocations and thereby permits the fusion or deregulation of oncogenes at translocation breakpoints, together with deletions and unbalanced chromosomal translocations leading to loss of tumor suppressor genes. The observed heterogeneity of these clonal changes between tumors suggests that the synergistic effect of Brca1 and p53 on tumorigenesis can be achieved through multiple pathways that involve the generation of oncogenic translocations. The presence of such rearrangements is unusual in T-cells, in that reciprocal translocations are predominately associated (especially involving the antigen receptor loci) with lymphoid tumors, whereas non-reciprocal translocations are a characteristic feature of many solid tumors (55).
A substantial percentage of metaphases chromosomes in Brca1-deficient cells and tumors analyzed contained chromosomal translocations with telomeric DNA at the fusion site (Fig. 2 and Table 2). Telomere shortening has been shown to act synergistically with p53 deficiency in malignant transformation, presumably by enhancing genomic instability (17,22). Telomere erosion in telomerase-deficient mutant p53 mice has been shown to contribute to tumorigenesis through generation of non-reciprocal translocations that likely occur through successive rounds of chromosomal fusion and breakage (22). Interestingly, breast tumors from these mice were also found to have non-reciprocal translocations, a cytogenetic feature of clinical breast cancer and other carcinomas (56). Hence, the presence of clonal chromosomal translocations containing telomeric DNA at the fusion points in tBrca1−/−p53−/− thymomas is suggestive of the contribution of telomeric dysfunction. We propose that Brca1 deficiency results in two telomere-related outcomes: loss of telomere end maintenance (uncapping) and telomere length erosion. The observed synergy in tumorigenesis provides a rationale for the frequent mutation of p53 in human BRCA1 tumors (57). Our findings support a role for Brca1 in maintaining telomere stability and provide a rationale whereby disruption of BRCA1 in familial carriers contributes to tumorigenesis.
MATERIALS AND METHODS
Quantitative fluorescence in situ hybridization
tBrca1−/− mice (Brca1fl5-6 mice bearing floxed Brca1 alleles and the Lck-Cre transgene) crossed with p53−/− mice or Eµ-bcl2-36 transgenic mice. Fluorescence-activated cell sorting analysis and preparation of anti-CD3ϵ activated peripheral T-cells have been previously described (12). FISH with Cy3-labeled (CCCTAA)3 peptide nucleic acid and quantitative analysis of telomere fluorescence were performed as described previously (16). Telomere length measurements and chromosome karyotyping were performed blind from sibling pairs derived from three independent litters. To score the incidence of anaphase chromosome fusions, at least 100 anaphase events were scored from p53−/− and tBrca1−/−p53−/− activated peripheral T-cells, following immobilization of cells on poly-l-lysine coated coverslips and DAPI staining. Data shown are the mean±standard deviation from three independent experiments.
Native in-gel hybridization
Detection of telomeric 3′-overhangs was performed essentially as described (20). Native gels were hybridized with a (TTAGGG)4 probe to ensure the absence of denatured DNA in sample lanes prior to hybridization with a (CCCTAA)4 probe. To rule out non-specific degradation of double-stranded telomere sequence, gels were denatured and subsequently hybridized to (CCCTAA)4.
Cytogenetic analysis/SKY
Cytogenetic preparations of thymoma samples (tBrca1−/−p53−/−) and peripheral T-cells (tBrca1−/−p53−/− and p53−/−) were made according to standard protocols (24). The SKY™ KIT probe cocktail from Applied Spectral Imaging (ASI, Carlsbad, CA, USA) was hybridized to all cytogenetic preparations. Metaphase images were captured using an SD 200 spectral bio-imaging system (ASI Ltd, MigdalHaemek, Israel) attached to a Zeiss microscope (Axioplan 2) using Spectral Imaging software (ASI). The images were analyzed using the SKYView software version 1.5 (ASI). For each sample, 10 SKY-metaphase spreads were karyotyped according to spectral and inverted DAPI images.
ACKNOWLEDGEMENTS
We thank L. Harrington, Y. Liu, A.S. Balajee, F. di Fagagna and A. Elia for advice and experimental assistance; S. Benchimol for critical reading of the manuscript; J. Marth and S. Cory for providing Lck-Cre and Eµ-Bcl2-36 transgenic mice. This work was supported by grants from the Academic Research Fund, National University of Singapore and National Medical Research Council, Ministry of Health, Singapore (M.P.H.) and by grant #TFPP12000 from the National Cancer Institute of Canada and Amgen, Inc. (R.H.). J.P.M. was supported by a Medical Research Council of Canada fellowship.
Conflict of Interest statement. The authors have no conflicts of interest to declare.
The authors wish it to be known that, in their opinion, the first two authors should be regarded as joint First Authors.
Present Address: Department of Pharmacology, University of Toronto, Toronto, Ontario, Canada M5S 1A8.
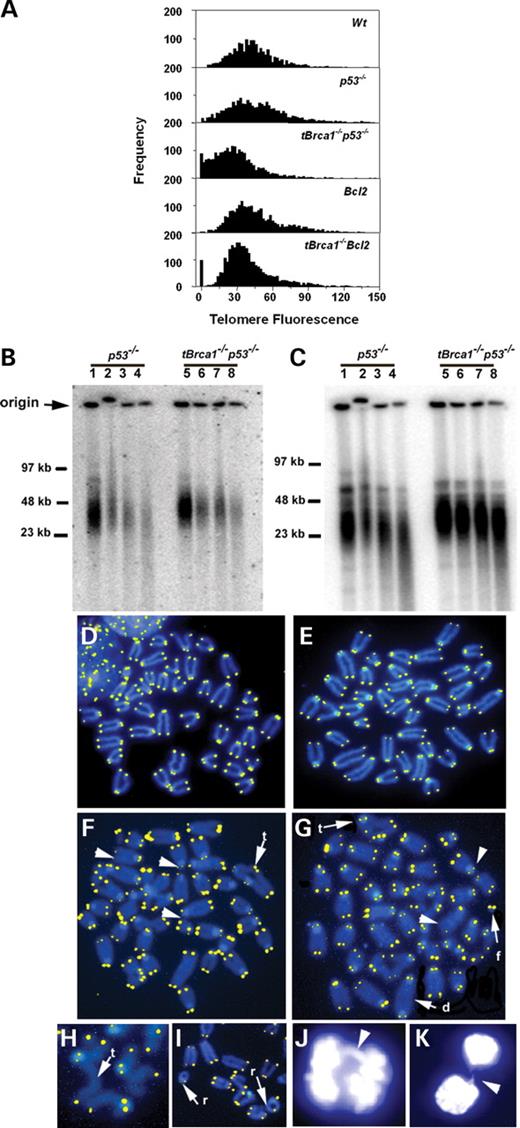
Figure 1. Telomere erosion and chromosomal abnormalities in Brca1-deficient peripheral activated T-cells. (A) Representative frequency distributions of telomere fluorescence data collected from qFISH analysis of metaphase chromosomal spreads of tBrca1−/−p53−/− compared with p53−/− and tBrca1−/−bcl2 compared with bcl2 activated T-cells. The x-axis depicts the intensity of each signal as expressed in telomere fluorescence units (TFU; 1 TFU=1 kb of telomeric repeats), the y-axis shows the frequency of telomeres of a given length. (B) Non-denaturing in-gel hybridization of genomic DNA from p53−/− (lanes 1–4) and tBrca1−/−p53−/− (lanes 5–8) activated T-cells with radiolabeled (CCCTAA)4 oligonucleotide. Specificity of signal was ensured by the stepwise reduction in intensity following incubation with increased amounts of Mung bean nuclease (0 units, lanes 1 and 5; 10 units, lanes 2 and 6; 40 units, lanes 3 and 7; 160 units, lanes 4 and 8). (C) To control for non-specific degradation in (B), the same gel is shown following denaturation and subsequent hybridization with radiolabeled (CCCTAA)4. Results shown in (B) and (C) are representative of four independent experiments using T-cells from p53−/− and tBrca1−/−p53−/− siblings derived from three different litters. (D–I) Telomere-FISH analysis of metaphase chromosomal spreads from p53−/− (D) bcl2 (E) tBrca1−/−p53−/− (F and I) and tBrca1−/−bcl2 (G and H) activated T-cells. Arrowheads denote chromosome ends with reduced telomere signal, t-triradial-like, d-dicentric, f-fragment, r-ring chromosome. (J and K) Representative anaphase chromosome bridge (J, arrowhead) and chromatin bridge (K, arrowhead) from newly divided daughter tBrca1−/−p53−/− cells. Results shown in (J) and (K) are representative of three independent experiments using T-cells from p53−/− and tBrca1−/−p53−/− siblings derived from three different litters. Telomere fluorescence intensity in pictures shown in (D–I) are for qualitative display only and is not meant to be quantitative in nature.
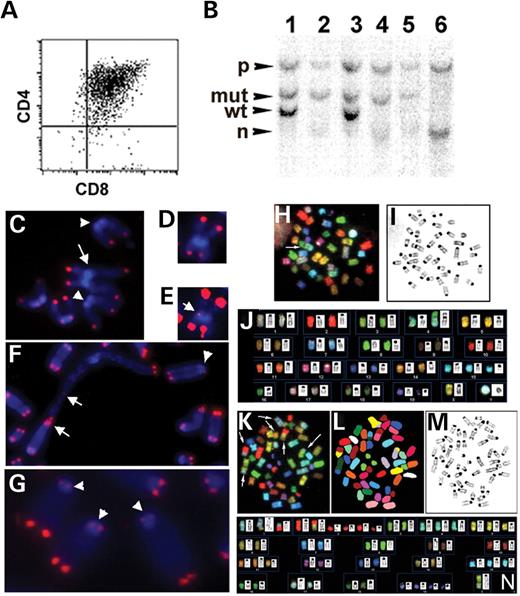
Figure 2. (A) Typical CD4 and CD8 profile of tBrca1−/−p53−/− thymomas. (B) Representative Southern analysis of p53 alleles in two tBrca1−/−p53+/− mice (lane 1, tail; lane 2, thymoma for the first mouse; lane 3, tail; lane 4, thymoma for the second) compared with tBrca1−/−p53−/− mouse (lane 5, tail; lane 6, thymoma) showing loss of wild-type (wt) and mutant (mt) alleles and generation of novel p53 exon 4-containing hybridization fragment (n) in thymomas (lanes 2, 4 and 6). (C–G) Telomere-FISH analysis of tBrca1−/−p53−/− tumors. Arrowheads denote chromosome ends with reduced telomere signal (C, F and G); arrows denote chromosomal fusions (C, E and F). Representative Robertsonian fusion-like chromosome (D and E) shown at normal exposure settings (D) and enhanced exposure to reveal telomeric signal at fusion point (E). Chromosomal fusion with interstitial telomeric signal (F). (C–E) Chromosomes from thymic lymphoma 2; (F–G) chromosomes from thymic lymphoma 3 (Table 3). (H–N) Structural and numerical chromosomal changes revealed by SKY analysis of tBrca1−/−p53−/− tumors. (H–J) and (K–N) Representative metaphase cells from thymic lymphoma 2 and 3, respectively. (H and K) SKY RGB image visualizing each chromosome pair. Arrows indicate translocations observed as the juxtaposition of two colors within one chromosome. (I and M) Metaphase analysis using an inverted DAPI counterstain. (L) The same metaphase in (K) using pseudo-colors to aid identification. (J and N) Combined SKY and DAPI-banding karyotype analysis (Table 3).
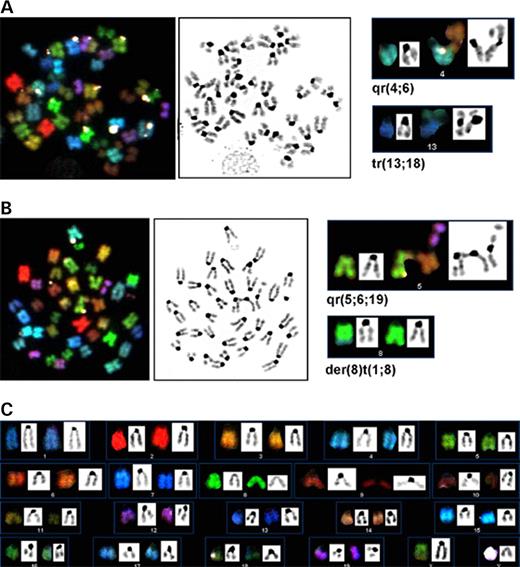
Figure 3. Structural and numerical chromosomal changes of tBrca1−/−p53−/− (A and B) and tBrca1+/−p53−/− peripheral T-cells (C) revealed by SKY analysis. (A) and (B) Representative analyses from two different metaphases (from left to right: SKY image, inverted DAPI counterstain, identification of chromosomal rearrangements) of T-cell population from the same p53−/− mouse that is homozygous for the Brca1 mutation (contains the Lck-cre transgene and is homozygous for the conditionally disrupted Brca1 allele). In contrast to tBrca1−/−p53−/− thymic lymphomas, all chromosomal translocations detected were non-clonal in nature. (C) Representative SKY karyotype analysis from T-cell population of p53−/− mouse that is heterozygous for the Brca1 mutation (contains the Lck-cre transgene and is heterozygous for the conditionally disrupted Brca1 allele). No structural changes were detected.
Telomere shortening in tBrca1−/− peripheral T-cells
| Genotypea | Telomere p-arm | Fluorescenceb q-arm | All telomeres (mean±SE) | |
|---|---|---|---|---|
| Cohort 1c | L+/−p53−/− | 37.0±0.6 | 56.3±0.8 | 46.7±0.5 |
| cLLp53−/− | 22.4±0.5 | 34.3±0.6 | 28.3±0.4d | |
| Cohort 2 | LLp53−/− | 36.6±0.4 | 45.3±0.5 | 41.0±0.3 |
| cLLp53−/− | 33.8±0.4 | 39.8±0.5 | 36.9±0.3d | |
| Cohort 3 | cL+/−p53−/− | 38.1±0.5 | 44.6±0.6 | 41.2±0.4 |
| cLLp53−/− | 32.2±0.3 | 39.4±0.4 | 35.8±0.3d | |
| Mean | p53−/− | 42.9±0.3 | ||
| tBrca1−/−p53−/− | 33.8±0.2 | |||
| Cohort 1c | cL+/−Bcl2 | 44.5±0.5 | 56.9±0.8 | 50.6±0.5 |
| cLLBcl2 | 39.1±0.5 | 38.4±0.5 | 38.8±0.4d | |
| Cohort 2 | LLBcl2 | 41.6±0.6 | 51.7±0.7 | 46.6±0.5 |
| cLLBcl2 | 33.2±0.4 | 44.4±0.7 | 38.9±0.4d | |
| Cohort 3 | LLBcl2 | 35.6±0.5 | 39.1±0.6 | 37.3±0.4 |
| cLLBcl2 | 32.3±0.4 | 37.8±0.4 | 35.1±0.3d | |
| Mean | Bcl2 | 45.2±0.3 | ||
| tBrca1−/−Bcl2 | 37.6±0.2 |
Wild-type data for telomere fluorescence (TFU, mean±SE): p-arm: 39.1±0.6; q-arm: 48.1±0.8; all telomeres: 43.5±0.5. A minimum of 1800 individual telomeres per sample was analyzed (6418 telomeres for p53−/− mice, 7472 telomeres for tBrca1−/− p53−/− mice, 6578 telomeres for Bcl2 mice and 8050 telomeres for tBrca1−/−Bcl2 mice).
ac, mouse contains one allele of the Lck-cre transgene; L+/−, mouse is heterozygous for the Brca1 conditionally disrupted allele; LL, mouse is homozygous for the Brca1 conditionally disrupted allele. tBrca1−/− mice are genotyped as cLL.
bTelomere fluorescence intensity expressed as TFU, where 1 TFU corresponds to 1 kb of (T2AG3)n sequence.
cEach cohort represents two sibling mice of the indicated genotypes. All cohorts are derived from independent litters produced by heterozygous parents, one of which carries the cre transgene.
dStatistically significant P≤0.001 in a Mann–Whitney rank sum test; statistical analysis was performed at individual telomere level.
Increased aneuploidy and chromosomal abnormalities in tBrca1−/− peripheral T-cells
| Genotype | Cells analyzed | Chromosomes per metaphasea | Aneuploid cells (%) | Total end-to-end fusionsb,c,d | Fusions with telomeresb | Tri-radial-like structuresb | Chromosome breaksb | Chromatid breaksb | Fragmentsb,e |
|---|---|---|---|---|---|---|---|---|---|
| p53−/− | 47 | 39.2±2.7 (26–40) | 8 (17.0) | 3 (0.06/cell) 6.38% | 2 (0.043/cell) 4.25% | 0 | 1 (0.02/cell) 2.13 % | 3 (0.06/cell) 4.26 % | 7 (0.15/cell) 12.77 % |
| tBrca1−/−p53−/− | 46 | 38.1±6.7 (24–56) | 28 (60.9) | 40 (0.87/cell) 67.4% | 19 (0.41/cell) 39.1% | 26 (0.57/cell) 41.3 % | 15 (0.33/cell) 21.7 % | 20 (0.44/cell) 34.8 % | 32 (0.70/cell) 45.7 % |
| Bcl2 | 51 | 39.6±1.7 (30–40) | 5 (9.8) | 0 | 0 | 0 | 0 | 0 | 8 (0.16/cell) 15.7 % |
| tBrca1−/−Bcl2 | 49 | 39.0±3.6 (25–49) | 15 (30.6) | 15 (0.31/cell) 24.5% | 9 (0.18/cell) 18.4% | 13 (0.27/cell) 22.5 % | 6 (0.12/cell) 12.2 % | 16 (0.33/cell) 24.5 % | 12 (0.24/cell) 24.5 % |
| Wild-type | 46 | 40.0±0.2 (39–40) | 2 (4.3) | 0 | 0 | 0 | 1 (0.02/cell) 2.2 % | 0 | 3 (0.06/cell) 6.5% |
Chromosome aberration classification was done as described earlier (58). Results shown are pooled from metaphase spreads from activated T-cell populations of three different animals per genotype.
aChromosomes per metaphase presented as mean±SD and range of chromosome numbers presented in parentheses.
bNumbers presented with incidence per cell are indicated in parentheses in the second row. In the third row, percentage of cells having aberrations are presented. Fusions with telomeres indicate that the chromosome fuses where telomeres are present at the fusion point.
c66.6% of p53−/− fusions, 47.5% of tBrca1−/−p53−/− and 60% of tBrca1−/-bcl2 fusions have telomeres at the fusion point, respectively.
dIncludes Robertsonian fusion-like configurations (p-arm fusions), telomere associations, dicentric chromosomes (q-arm fusions), ring-like structures (sister chromatid fusion) (58).
eIncludes centric and acentric fragments.
Karyotypes of tBrca1−/−p53−/− thymomas by SKY analysis
| Thymoma 1 | Thymoma 2 | Thymoma 3 |
|---|---|---|
| a3×40, XX | 10×40, XY | 10×50, der(X)dup(X) |
| 7×34∼40, XX | (?E)t(X;17)(?F5;?B), −X/−Y | |
| der(7)t(7;11)(F4;B4) [4] | der(4;16)(A1;A1) [10] | t(1;3)(H1;H1) |
| −13 [4] | der(6)t(6;*)(F1;*) [3] | +der(1)t(1;2)(C3;F1) |
| del(13)(C3) [2] | +del(15)(A2::C) [10] | der(2)t(2;14)(C3;A2) |
| der(19)t(14;19)(D3;D1)[2] | del(19)(C1) [10] | +del(2)(C3)x4,+4, +del(5)(G1) |
| +der(11)t(11;?X)(B2;?) | ||
| +15,del(17)(B::D) | ||
| +del(19)(C2)×2 |
Ten metaphases were analyzed per thymoma. Only clonal changes are shown and are described following ISCN 95 guidelines.
a(), numbers indicate chromosomes participating on cytogenetic aberrations, letters followed by number identify particular chromosomal band involved; [], the total number of cells exhibiting a particular chromosomal change are shown. The karyotype for thymoma 3 was identical in all 10 metaphases analyzed. In different metaphases studied, three chromosomes (2, 13 and 14) underwent translocation to the band 6 (F1). der, derivative chromosome resulted from chromosomal change; del, deletion of specified chromosomal region; dup, duplication of specified chromosomal region; t, translocation.
References
Welcsh, P.L., Owens, K.N. and King, M.C. (
Starita, L.M. and Parvin, J.D. (
Shen, S.X., Weaver, Z., Xu, X., Li, C., Weinstein, M., Chen, L., Guan, X.Y., Ried, T. and Deng, C.X. (
Xu, X., Weaver, Z., Linke, S.P., Li, C., Gotay, J., Wang, X.W., Harris, C.C., Ried, T. and Deng, C.X. (
Moynahan, M.E., Chiu, J.W., Koller, B.H. and Jasin, M. (
Zhong, Q., Chen, C.F., Chen, P.L. and Lee, W.H. (
Hartman, A.R. and Ford, J.M. (
Gowen, L.C., Johnson, B.L., Latour, A.M., Sulik, K.K. and Koller, B.H. (
Hakem, R., de la Pompa, J.L., Sirard, C., Mo, R., Woo, M., Hakem, A., Wakeham, A., Potter, J., Reitmair, A., Billia, F. et al. (
Liu, C.Y., Flesken-Nikitin, A., Li, S., Zeng, Y. and Lee, W.H. (
Ludwig, T., Chapman, D.L., Papaioannou, V.E. and Efstratiadis, A. (
Mak, T.W., Hakem, A., McPherson, J.P., Shehabeldin, A., Zablocki, E., Migon, E., Duncan, G.S., Bouchard, D., Wakeham, A., Cheung, A. et al. (
Viscardi, V., Clerici, M., Cartagena-Lirola, H. and Longhese, M.P. (
Hande, M.P., Samper, E., Lansdorp, P. and Blasco, M.A. (
Chin, L., Artandi, S.E., Shen, Q., Tam, A., Lee, S.L., Gottlieb, G.J., Greider, C.W. and DePinho, R.A. (
van Steensel, B. and de Lange, T. (
van Steensel, B., Smogorzewska, A. and de Lange, T. (
Hemann, M.T. and Greider, C.W. (
Zhang, X., Mar, V., Zhou, W., Harrington, L. and Robinson, M.O. (
Artandi, S.E., Chang, S., Lee, S.L., Alson, S., Gottlieb, G.J., Chin, L. and DePinho, R.A. (
McPherson, J.P., Lemmers, B., Hirao, A., Hakem, A., Abraham, J., Migon, E., Matysiak-Zablocki, E., Tamblyn, L., Sanchez-Sweatman, O., Khokha, R. et al. (
Liyanage, M., Coleman, A., du Manoir, S., Veldman, T., McCormack, S., Dickson, R.B., Barlow, C., Wynshaw-Boris, A., Janz, S., Wienberg, J. et al. (
Scully, R., Chen, J., Ochs, R.L., Keegan, K., Hoekstra, M., Feunteun, J. and Livingston, D.M. (
Wong, K.K., Chang, S., Weiler, S.R., Ganesan, S., Chaudhuri, J., Zhu, C., Artandi, S.E., Rudolph, K.L., Gottlieb, G.J., Chin, L. et al. (
Hackett, J.A., Feldser, D.M. and Greider, C.W. (
Scully, R., Chen, J., Plug, A., Xiao, Y., Weaver, D., Feunteun, J., Ashley, T. and Livingston, D.M. (
Dunham, M.A., Neumann, A.A., Fasching, C.L. and Reddel, R.R. (
Kass-Eisler, A. and Greider, C.W. (
Lustig, A.J. (
Chamankhah, M. and Xiao, W. (
Le, S., Moore, J.K., Haber, J.E. and Greider, C.W. (
Nugent, C.I., Bosco, G., Ross, L.O., Evans, S.K., Salinger, A.P., Moore, J.K., Haber, J.E. and Lundblad, V. (
Usui, T., Ogawa, H. and Petrini, J.H. (
Bender, C.F., Sikes, M.L., Sullivan, R., Huye, L.E., Le Beau, M.M., Roth, D.B., Mirzoeva, O.K., Oltz, E.M. and Petrini, J.H. (
Wu, G., Lee, W.H. and Chen, P.L. (
Zhu, X.D., Kuster, B., Mann, M., Petrini, J.H. and de Lange, T. (
Zhong, Q., Chen, C.F., Li, S., Chen, Y., Wang, C.C., Xiao, J., Chen, P.L., Sharp, Z.D. and Lee, W.H. (
Lim, D.S., Kim, S.T., Xu, B., Maser, R.S., Lin, J., Petrini, J.H. and Kastan, M.B. (
Nelms, B.E., Maser, R.S., MacKay, J.F., Lagally, M.G. and Petrini, J.H. (
Bailey, S.M., Meyne, J., Chen, D.J., Kurimasa, A., Li, G.C., Lehnert, B.E. and Goodwin, E.H. (
Gilley, D., Tanaka, H., Hande, M.P., Kurimasa, A., Li, G.C., Oshimura, M. and Chen, D.J. (
Hande, P., Slijepcevic, P., Silver, A., Bouffler, S., van, B.P., Bryant, P. and Lansdorp, P. (
Bianchi, A. and de Lange, T. (
d'Adda di Fagagna, F., Hande, M.P., Tong, W.M., Roth, D., Lansdorp, P.M., Wang, Z.Q. and Jackson, S.P. (
Hsu, H.L., Gilley, D., Blackburn, E.H. and Chen, D.J. (
Hsu, H.L., Gilley, D., Galande, S.A., Hande, M.P., Allen, B., Kim, S.H., Li, G.C., Campisi, J., Kohwi-Shigematsu, T. and Chen, D.J. (
Samper, E., Goytisolo, F.A., Slijepcevic, P., van Buul, P.P. and Blasco, M.A. (
d'Adda di Fagagna, F., Hande, M.P., Tong, W.M., Lansdorp, P.M., Wang, Z.Q. and Jackson, S.P. (
Bradshaw, P.S., Stavropoulos, D.J. and Meyn, M.S. (
Masutomi, K., Possemato, R., Wong, J.M., Currier, J.L., Tothova, Z., Manola, J.B., Ganesan, S., Lansdorp, P.M., Collins, K. and Hahn, W.C. (
Silverman, J., Takai, H., Buonomo, S.B., Eisenhaber, F. and de, L.T. (
Atkin, N.B. (
Crook, T., Crossland, S., Crompton, M.R., Osin, P. and Gusterson, B.A. (
