


Abstract
The degradation of freshwater quality induced by cyanobacterial blooms is a major global environmental concern. Microbially driven nitrogen removal could alleviate eutrophication to some degree in freshwater ecosystems. However, the response of anaerobic ammonium oxidizing (anammox) bacterial communities to cyanobacterial blooms remains poorly understood, especially in reservoir ecosystems. Here we compared the dynamics of anammox bacterial communities during and after a cyanobacterial bloom in a subtropical reservoir. Our data showed that a cyanobacterial bloom triggered a significant increase in bottom anammox bacterial abundance. During the bloom period, anammox bacterial abundance in bottom waters was 9-fold and 52-fold higher compared with non-bloom stratification and mixing periods, respectively. The community composition of anammox bacteria in surface waters changed substantially accompanied by the disappearance of the cyanobacterial bloom, and a shift of dominance from unidentified anammox genera to Ca. Brocadia was observed. Although Ca. Brocadia was always predominant in both middle and bottom waters, the non-bloom period had more unique taxa than the bloom period. Cyanobacterial bloom-related changes in environmental conditions (e.g. NH4-N and total organic carbon) and water stratification together influenced the distribution and dynamics of anammox bacteria. Altogether, our study lays the basis for a better understanding of the breakdown of cyanobacterial blooms in a stratified reservoir.
INTRODUCTION
Harmful cyanobacterial blooms, especially those of Microcystis sp., are becoming more frequent in global aquatic environments, representing a serious threat to the sustainability of freshwater ecosystems and human health (Carmichael and Boyer 2016). Reservoirs are the major drinking water resources for many populations worldwide and contribute to local economic and social development in both developing and developed countries (Yang et al.2012). Owing to climate change, hydrological variability and anthropogenic eutrophication, cyanobacterial blooms have become an important disturbance in reservoir ecosystems (Mariani et al.2015; Yang et al.2016). Traditionally, phosphorus (P) input restrictions have a central role in the control of cyanobacterial bloom formation (Schindler 1977). Increasingly, non-diazotrophic cyanobacteria (e.g. Microcystis) dominate such blooms in P-limited systems, indicating that decreasing nitrogen (N) loading may be key to long-term eutrophication and cyanobacterial bloom control in eutrophic systems (Paerl et al.2011).
During a cyanobacterial bloom, high cyanobacterial biomass can result in carbon sequestration, high pH, oxygenation in the epilimnion and nutrient loading of sediments (Gao et al.2012; Wilhelm et al.2014). In the late dense stage of a bloom, the breakdown of large amounts of cyanobacterial biomass can cause aquatic hypoxia (Chen et al.2010). Meanwhile, large amounts of dissolved organic matter are released into the water from decaying cyanobacteria, and this represents an important carbon and nitrogen pool in the microbial food web (Cherrier and Bauer 2004; Aoki et al.2008). Recent studies have found that cyanobacterial blooms are associated with elevated rates of denitrification and nitrification, further accelerating N removal in Lake Taihu (Chen et al.2016; Peng et al.2017), demonstrating the self-purification ability of cyanobacterial blooms. Therefore, during blooms in reservoirs, understanding the N cycling characteristics is crucial because it could help to mitigate eutrophication and restore water resources.
Microbial processes, including anaerobic ammonium oxidation (anammox) and denitrification, can be responsible for N removal. Anammox can mitigate eutrophication to some degree by oxidizing ammonium with nitrite under hypoxic or anoxic conditions to produce N2, which is not available to most primary producers (Yoshinaga et al.2011; Teixeira et al.2014). For instance, 15N-labeling experiments indicated that anammox may contribute to 10% of total N2 production in a temperate eutrophic lake (McCarthy et al.2016). However, the anammox reaction accounted for 13% and 19–35% of total N2 formation in the water column of freshwater lakes (Schubert et al.2006) and the anoxic waters of a coastal bay (Dalsgaard et al.2003), respectively. Anammox bacteria are sensitive to changes in environmental conditions, such as temperature, pH, dissolved oxygen and substrate concentration (Oshiki, Satoh and Okabe 2016). Different anammox contributions to N loss probably depend on distinct environmental conditions, which may influence the abundance, composition and distribution of anammox bacteria (Dang et al.2010). The contrasting changes in the environment induced by a cyanobacterial bloom may be essential to the shifts of aquatic anammox bacterial communities. Although the effect of a cyanobacterial bloom on N removal has been demonstrated with a prime focus on denitrification, research on the response of anammox bacteria to cyanobacterial blooms in lakes or reservoirs has been lacking until now.
In subtropical deep reservoirs, the longer duration of thermal stratification is a crucial physical driver for cyanobacterial development and domination (Lv, Yang and Liu 2013). Seasonal thermal stratification leads to the formation of discrete water masses (i.e. epilimnion and hypolimnion) that harbor contrasting bacterial communities, and also creates barriers to nutrient and dissolved oxygen exchange between the epilimnion and hypolimnion (Wilhelm and Adrian 2008; Yu et al.2014). With the breakdown of stratification, water column mixing can contribute to the exchange of various N-compounds and changes in oxygen levels in the water column (Zhang et al.2014). The occurrence of thermal stratification has important implications for the vertical patterns of microbial abundance, composition and diversity (Yu et al.2014; Wang et al.2015). Consequently, cyanobacterial bloom-related changes in environmental conditions, in conjunction with water stratification, may further complicate the relationship between anammox bacteria and environmental variables.
Xidong Reservoir is a seasonally stratified reservoir characterized by steep gradients in temperature, dissolved oxygen and nutrient concentrations down the water column, and thus provides a promising habitat in which to determine the vertical distribution of anammox bacteria along the water column. A cyanobacterial bloom event occurred in early October 2014, and we hypothesized that cyanobacterial bloom-induced changes in environmental conditions may have a significant influence on the temporal dynamics of anammox bacterial communities. Thus we used PCR-clone sequencing, catalyzed reporter deposition-fluorescence in situ hybridization (CARD-FISH), an isotope-tracing technique and quantitative real time-PCR (Q-PCR) to investigate the occurrence, abundance, activity and diversity of anammox bacteria along the water column from cyanobacterial bloom to non-bloom periods in Xidong Reservoir. The main aims were (i) to compare the temporal dynamics and vertical distribution patterns of anammox bacteria in the water column during and after the cyanobacterial bloom, and (ii) to elucidate the relationships between anammox bacterial communities, the cyanobacterial bloom and water stratification.
MATERIALS AND METHODS
Site description and sample collection
The field sampling was conducted in Xidong Reservoir (24°49΄ N, 118°10΄ E), which is a deep monomictic reservoir located near the city of Xiamen, Fujian province, southeast China, with a maximal depth of 27 m and a capacity of 14.0 × 10⁶ m3. Reservoir stratification usually occurs in early spring and can persist throughout the summer and autumn. The reservoir only mixes completely, and remains isothermal, for several weeks in winter. The main uses of Xidong Reservoir are flood control, hydroelectric power generation and water supply. The area has a subtropical humid monsoon climate with a highly seasonal precipitation pattern. Annual mean temperature and annual mean precipitation are 21°C and 1468 mm, respectively. The rainy season is from May to September, while the dry season lasts from October to April (Yang et al.2017a).
In this study, the sampling station was located in the lacustrine zone near the dam. Water samples (n = 18) were collected twice a month in October, November and December 2014 at three different depths: aerobic surface (0.5 m), hypoxic or anoxic middle (12–20 m) and anaerobic bottom (25 m) waters. The cyanobacterial bloom had been present for more than 2 weeks before the initial sampling was undertaken, and the dominant species (Microcystis aeruginosa) was identified using both light microscopy and ribosomal genetic makers (i.e. universal bacterial 16S rRNA gene primers 341F and 805R; Bagatini et al.2014; Supplementary Fig. S1). Water samples were taken in the middle and later bloom period based on the temporal variations of chlorophyll a concentration and water transparency (Supplementary Table S1; Fig. 1b). Sampling time spanned from water stratification (days 297, 304, 325, 332 and 346) to mixing periods (day 363). For comparative analysis, our sampling dates were classified into three stages: bloom stratification (days 297 and 304), non-bloom stratification (days 325, 332 and 346) and non-bloom mixing (day 363). For the anammox bacterial analysis, 500 mL water samples were filtered through polycarbonate membrane (0.22 μm, 47 mm diameter, Millipore, Billerica, MA, USA). The membrane was kept at −80°C until DNA extraction.
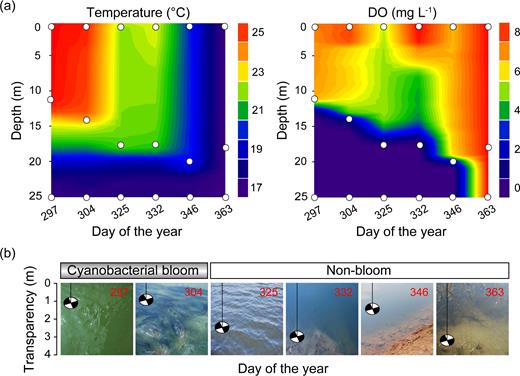
(a) Depth–time profiles of water temperature and dissolved oxygen in Xidong Reservoir from day 297 to day 363. White circles represent sampling depth and time. (b) Temporal variation in the water transparency of Xidong Reservoir from cyanobacterial bloom to non-bloom periods – Secchi depth shown in meters.
Environmental analysis
The physical and chemical characteristics of the water were measured as described in Liu et al. (2013). Transparency was determined with a 30 cm Secchi disk. Chlorophyll a (Chl-a) was measured using a PHYTO-PAM Phytoplankton Analyzer (Heinz Walz GmbH, Eichenring, Germany). The comprehensive trophic state index was calculated according to Yang et al. (2012).
Fluorescence in situ hybridization and catalyzed reporter deposition
CARD-FISH was performed to identify anammox bacterial cells from the surface and bottom water membranes (bloom period, day 297) following the protocol of Nie et al. (2015). The horseradish peroxidase-labeled oligonucleotide probe Amx820 (5΄-AAAACCCCTCTACTTAGTGCCC-3΄; Schmid et al.2000) was used for the detection of anammox bacterial cells, including Ca. Brocadia and Ca. Kuenenia. The HRP-labeled probe Non338 (5΄-ACTCCTACGGGAGGCAGC-3΄; Wallner, Amann and Beisker 1993) was applied to check for unspecific staining and autofluorescence. Total cells were quantified based on staining with 4΄,6-diamidino-2-phenylindole using an LSM 710 confocal laser scanning microscope (Carl Zeiss, Jena, Germany).
DNA extraction and quantitative real-time PCR
Total DNA was extracted from the membrane using a Fast DNA spin kit (MP Biomedicals, Santa Ana, CA, USA) according to the manufacturer's instructions. For the detection of anammox bacterial abundance, Q-PCR assay was performed in a LightCycler 480 Real-Time PCR System (Roche Applied Science, Mannheim, Germany) with a SYBR Green qPCR kit (Takara Bio Inc., Kusatsu, Japan). Primers sets of hzsB-396F (5΄-ARGGHTGGGGHAGYTGGAAG-3΄) and hzsB-742R (5΄-GTYCCHACRTCATGVGTCTG-3΄) were used targeting the hzsB gene following the PCR conditions of Wang et al. (2012). Amplification was carried out in 20 μL reaction mixtures including 10 μL SYBR Premix ExTaqTM (Takara Bio Inc., Kusatsu, Japan), 0.8 μL of each primer, 2 μL DNA template and 6.4 μL RNase-free water. All PCR runs consisted of tested samples and negative controls (using double distilled water) in triplicate, and no signal was detected in control samples. A standard curve (R2 = 0.998) was generated over six orders of magnitude from 102 to 107 copies of template per assay using a plasmid containing hzsB gene. The quantitative PCR amplification efficiency (E = 98.2%) was calculated according to the equation E = [10(−1/slope) − 1].
Total bacterial 16S rRNA gene abundance was quantified using two universal primers specific for members of Eubacteria, 341F (5΄-CCTACGGGNGGCWGCAG-3΄) and 515R (5΄-ATTCCGCGGCTGGCA-3΄), following the PCR conditions as described by Yu et al. (2014). A standard curve was generated over six orders of magnitude from 105 to 1010 copies of template per assay using a plasmid containing the 16S rRNA gene. The R2 value for linear regression of threshold value and standard abundance was 0.998 and PCR amplification efficiency was 101.7%.
Measuring anammox and denitrification rates
The surface sediment samples (0–5 cm) were collected using a grab sampler during the cyanobacterial bloom (day 297). The top 2 cm of sediment was placed in sterile bags, and transported to the laboratory on ice. The potential rates of both anammox and denitrification were measured as previously described (Yang et al.2015). About 3.5 g of sediment (fresh weight) was transferred to He-flushed 12.6-mL glass vials (Exetainer, Labco, High Wycombe, UK), together with N2-purged in situ media water. The resulting sediment was then preincubated for 48 h to remove residual NOx− and oxygen. Subsequently, 100 μL of N2-purged stock solution of each isotopic mixture, i.e. (i) 15NH4+ (15N-(NH4)2SO4 at 99.14%), (ii) 15NH4+ + 14NO3− and (iii) 15NO3− (15N-KNO3 at 98.15%), was injected through the septa of each vial, resulting in a final concentration of about 100 μM N. Time course incubations were carried out in triplicate at 0, 3, 6, 12 and 24 h. To stop microbial activity, ZnCl2 solution (200 μL, 7 M) was added at each time point (0, 3, 6, 12 and 24 h). The rate and potential contribution to N2 formation of either anammox or denitrification were calculated from the produced 29N2 and 30N2, measured by continuous-flow isotope ratio mass spectrometry (MAT253 with Gasbench II and autosampler (GC-PAL); Finnigan, Thermo Electron Corp., Bremen, Germany).
Construction of clone libraries and phylogenetic analysis
A nested PCR was used to amplify the 16S rRNA gene of anammox bacteria. First, the primer pair PLA46f (a Planctomycete-specific forward primer; 5΄-GACTTGCATGCCTAATCC-3΄; Neef et al.1998) and PLA630r (Escherichia coli positions 1529 to 1545; 5΄-CAKAAAGGAGGTGATCC-3΄; Juretschko et al.1998) was used to amplify the Planctomycete 16S rRNA genes. PCR reaction conditions were 94°C for 5 min, followed by a touchdown protocol started with annealing at 66°C for 1 min, 10 cycles with an annealing temperature decrement of 1°C, and 29 cycles with annealing at 56°C, and an extension at 72°C for 10 min. Afterwards, a 10-fold dilution PCR product was used as the template for the second amplification with primer pair Amx368f targeting all anammox organisms (5΄-CCTTTCGGGCATTGCGAA-3΄; Schmid et al.2003) and Amx820r targeting Ca. Brocadia anammoxidans, Ca. Brocadia fulgida and Ca. Kuenenia stuttgartiensis (5΄-AAAACCCCTCTACTTAGTGCCC-3΄; Schmid et al.2000) with the following PCR conditions: 96°C for 10 min, followed by 29 cycles of 30 s at 96°C, 1 min at 58°C and 1 min at 72°C. Finally, PCR products were examined by 1% agarose gel electrophoresis.
For anammox bacterial community composition, three representative sampling dates were selected for clone sequencing, including bloom period (day 297) and non-bloom period (days 325 and 346). The purified PCR product was cloned using the pMD18-T vector (Takara Bio Inc.). Seventy positive clones per sample were picked randomly for sequencing on an ABI3730 DNA Sequencer (Applied Biosystems, Foster City, CA, USA). The recovered 16S rRNA gene sequences of anammox bacteria were imported into MEGA 6 software, where the alignment was manually checked and trimmed. In total 603 high-quality sequences were retrieved from nine clone libraries. The sequences were clustered into 36 operational taxonomic units (OTUs) at 97% sequence similarity level with the MOTHUR v.1.33.0 program (Schloss et al.2009). Then one representative sequence for each OTU was compared with sequences available in the GenBank database using BLASTN to obtain the closest relatives, and 10 of all the OTUs represented unidentified bacteria (Planctomycete and uncultured bacteria; Supplementary Table S2). Due to their low contribution to sequence abundance (2.65%) and possible bias, these 10 unidentified bacterial OTUs were excluded from the dataset before performing downstream analyses. The final total dataset retained 26 anammox bacterial OTUs and 587 sequences at 97% sequence similarity level. The phylogenetic analysis of the anammox bacterial 16S rRNA gene sequences was conducted with MEGA 6.0 software using the neighbor-joining method. A bootstrap analysis with 1000 replicates was applied to estimate the confidence values of the tree nodes (Tamura et al.2013).
Statistical analyses
We used a non-parametric Mann–Whitney U-test and one-way ANOVA for the comparisons of anammox bacterial abundance at spatiotemporal scales. The diversity indices for nine clone libraries were calculated with MOTHUR v.1.33.0. The relationships between environmental variables and the abundance, richness and diversity of anammox bacteria were examined with Spearman's rank correlation analysis. All test and correlation analyses were conducted using SPSS Statistics v. 20.0 (IBM Corp., Armonk, NY, USA).
Canonical correlation analysis was performed to explore the relationships between anammox bacterial communities and environmental variables. We applied redundancy analysis to show the effect of environmental variables on anammox bacterial communities at genus level. Before the canonical correlation analysis or redundancy analysis, preliminary detrended correspondence analysis on the microbial data was used to decide whether linear or unimodal ordination methods should be used in subsequent analysis (Liu et al.2013). The Shapiro–Wilk test was used to check the normality of the environmental variables, and variables were log(x + 1) transformed with the exception of pH. All the multivariate analyses were conducted using the CANOCO software package for Windows v. 4.5.
Nucleotide sequence accession numbers
The 603 sequences generated in this study for anammox bacteria (587) and unidentified bacteria (16) are available in the NCBI database under the accession numbers KU593650–KU594252. The two 16S rDNA sequences of Microcystis aeruginosa were stored in the NCBI database under accession numbers KY285028 and KY285029.
RESULTS
Spatiotemporal heterogeneity of limnological factors
Surface chlorophyll a (Chl-a) concentration notably decreased from 46.28 μg L−1 on day 297 to 29.58 μg L−1 on day 304 during the bloom period, and middle and bottom waters showed similar patterns (Supplementary Table S1). During the non-bloom period, Chl-a concentrations in the water column were less than 10 μg L−1 except for a surface sample on day 332 (14.87 μg L−1). The comprehensive trophic state index showed a synchronous decline from middle eutrophic levels (61.3–62.2) to light eutrophic and mesotrophic levels (46.1–52.4) accompanied by the disappearance of the cyanobacterial bloom. The vertical profiles of temperature and dissolved oxygen (DO) demonstrated that our sampling periods corresponded to the thermal stratification dynamics of reservoirs, with a relatively constant temperature and DO in the bottom waters from day 297 to day 346 (Fig. 1a). The cyanobacterial bloom period revealed higher total organic carbon (TOC) concentration and above neutral pH throughout the water column. During the bloom period, bottom total nitrogen (TN), ammonium nitrogen (NH4-N) and total phosphorus (TP) concentrations increased, whereas bottom nitrate nitrogen (NO3-N) concentration decreased. Under thermal stratification condition, NH4-N concentration was depleted in the upper water column. Conversely, NO3-N concentration remained high in the upper waters compared with the bottom waters. After overturn on day 363, all the environmental parameters were almost uniform throughout the water column (Supplementary Tables S1 and S3).
Anammox bacterial abundance
Anammox bacterial cells, including the genera Ca. Brocadia and Ca. Kuenenia, were detected in both surface and bottom waters by CARD-FISH during the bloom period, but substantially higher cell numbers of anammox bacteria were observed in bottom waters (Fig. 2d). The hzsB gene abundance significantly increased with depth under stratified conditions (Mann–Whitney U-test, P < 0.01), especially during the bloom period (Fig. 2a and b; Supplementary Table S4). Anammox bacterial abundance increased by an order of magnitude with depth. Conversely, the hzsB gene abundance did not differ significantly between depths during non-bloom mixing period (Mann–Whitney U-test, P > 0.05; Fig. 2c; Supplementary Table S4). During the bloom period, hypolimnelic anammox bacterial hzsB gene abundance and the ratio of hzsB/16S rRNA increased significantly from day 297 to day 304 (Supplementary Fig. S2). Our stable isotope experiment further confirmed the anammox activity during the bloom period, with the potential rate of 0.69 nmol N2 g−1 sediment h−1, which contributed 27.3% of the N2 production (Fig. 2e). More importantly, the bottom hzsB gene abundance displayed a significantly enhanced response to the cyanobacterial bloom, being enriched 9-fold and 52-fold compared with non-bloom stratification and mixing periods, respectively (Mann–Whitney U-test, P < 0.001); this did not happen in surface and middle waters (Mann–Whitney U-test, P > 0.05). The ratio of anammox bacteria (hzsB gene) to total bacteria (16S rRNA gene) showed a similar distribution pattern to anammox bacterial hzsB gene abundance (Fig. 2a–c; Supplementary Table S4).
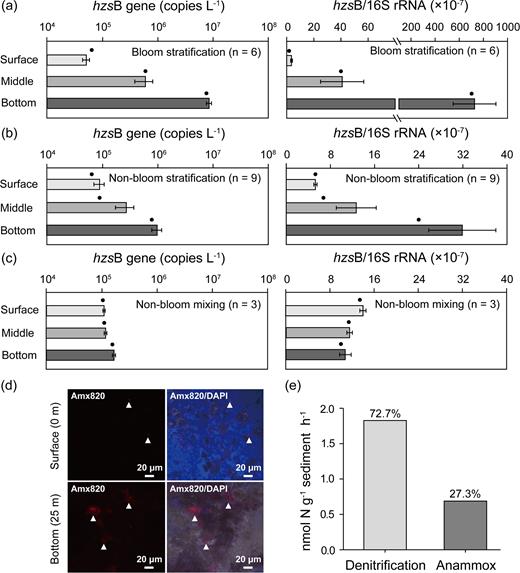
Gene and cell abundances of anammox bacteria at different depths in Xidong Reservoir. (a–c) Patterns of anammox bacterial hzsB gene abundance and hzsB gene/bacterial 16S rRNA gene ratio across depth and time, including bloom stratification (a), non-bloom stratification (b) and non-bloom mixing (c) periods. Values, error bars and solid black circles indicate mean, standard error and median, respectively. For details of comparisons of gene abundance across depth and time, see Supplementary Table S4. (d) Microscopy images of anammox bacteria from both surface and bottom waters on day 297 taken by laser scanning confocal microscopy. Anammox bacteria stained by probe Amx820 specific for genera Ca. Brocadia and Ca. Kuenenia (left); combination of 4΄,6-diamidino-2-phenylindole-stained cells and cells stained with probes specific for anammox bacteria (right). Arrowheads show anammox bacteria cells. (e) Anammox, denitrification activity and their contribution to N2 production in the surface sediment of the Xidong Reservoir during the cyanobacterial bloom (day 297).
Diversity and community composition of anammox bacteria
A total of 587 anammox bacterial 16S rRNA gene sequences were obtained in this study, and these clustered into 26 OTUs (Supplementary Fig. S3). The majority (46.2%) of OTUs were affiliated with Ca. Brocadia (407/587), 26.9% of OTUs were related to Ca. Kuenenia (131/587) while only 3.8% were identified as Ca. Scalindua (2/587). The remaining 47 sequences formed three novel clusters, which may represent unidentified anammox genera, accounting for 23.1% of the anammox population. OTU1 was the most abundant (302/587), followed by OTU13 (79/587), OTU2 (62/587) and OTU14 (43/587). The diversity of anammox bacteria showed a high variability across the nine samples (e.g. the Shannon index, 0.49–1.49). Interestingly, the diversity of anammox bacteria in the middle and bottom waters gradually increased following the cyanobacterial bloom (Table 1).
Richness and diversity indices of anammox bacteria based on 16S rRNA genes in Xidong Reservoir at 97% sequence similarity level. The sample names are indicated by the sampling day and depth, and the letters S, M and B represent surface, middle and bottom waters, respectively.
| Sample ID | Depth (m) | No. of sequences | Coverage (%) | OTU | Chao1 | Shannon–Wiener | Simpson | Pielou's evenness |
|---|---|---|---|---|---|---|---|---|
| 297S | 0.5 | 48 | 91.7 | 7 | 10 | 0.89 | 0.39 | 0.46 |
| 297M | 14 | 68 | 100.0 | 2 | 2 | 0.49 | 0.31 | 0.70 |
| 297B | 25 | 68 | 98.5 | 3 | 3 | 0.56 | 0.33 | 0.51 |
| 325S | 0.5 | 67 | 95.5 | 7 | 8 | 0.94 | 0.45 | 0.49 |
| 325M | 17 | 69 | 95.7 | 7 | 9 | 0.90 | 0.41 | 0.46 |
| 325B | 25 | 68 | 95.6 | 5 | 8 | 0.81 | 0.46 | 0.50 |
| 346S | 0.5 | 66 | 100.0 | 2 | 2 | 0.66 | 0.47 | 0.96 |
| 346M | 20 | 67 | 91.0 | 9 | 17 | 1.06 | 0.49 | 0.48 |
| 346B | 25 | 66 | 100.0 | 5 | 5 | 1.49 | 0.74 | 0.89 |
OTUs affiliated to three novel clusters were only detected in the bloom surface sample, and a distinct shift of dominance from unidentified anammox genera to Ca. Brocadia was observed in surface waters (Fig. 3). However, Ca. Brocadia was always predominant in both middle and bottom waters. For middle and bottom waters, anammox communities between bloom and non-bloom periods contrasted, with very few shared OTUs and many unique OTUs, and the non-bloom period harbored more unique OTUs than the bloom period (Fig. 3). The shared OTUs were the most abundant taxa including OTU1 (Ca. Brocadia) and OTU13 (Ca. Kuenenia) (Supplementary Table S2). In contrast, unique OTUs were quite rare in terms of their abundance (Fig. 3).
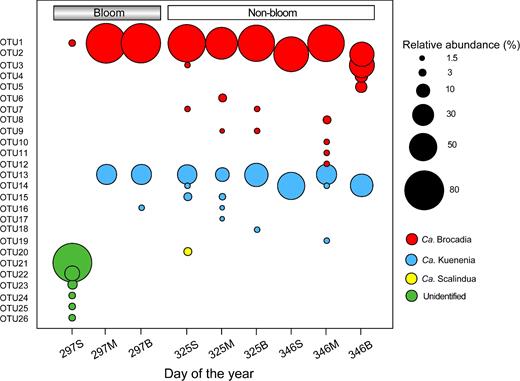
Relative abundance of the anammox bacterial OTUs based on 16S rRNA gene sequences across depth and time. The sample names are indicated with the sampling day and depth. The letters S, M and B represent surface, middle and bottom waters, respectively.
Relationships between environmental factors and anammox bacteria
Spearman's correlation analysis showed that the abundance of anammox bacteria was significantly and positively related to NH4-N, TP and PO4-P, but negatively to DO, NO3-N, TN:TP ratio and temperature (Table 2). Total carbon, TOC and Chl-a were significantly negatively correlated with the Simpson index, while only Chl-a had a significant negative effect on the Shannon–Wiener index (Supplementary Table S5).
Spearman correlations between hzsB gene abundance, ratio of hzsB gene to bacterial 16S rRNA gene and environmental variables in Xidong Reservoir.
| Environmental variable | hzsB gene | hzsB/16S rRNA |
|---|---|---|
| Temperature | −0.401 | −0.517* |
| Electrical conductivity | 0.176 | 0.088 |
| Turbidity | 0.470 | 0.453 |
| pH | 0.154 | 0.095 |
| ORP | 0.146 | 0.221 |
| Dissolved oxygen | −0.689** | −0.575* |
| Total carbon | 0.193 | 0.083 |
| Total organic carbon | −0.205 | −0.288 |
| Total nitrogen | 0.222 | 0.226 |
| Ammonium nitrogen | 0.503* | 0.525* |
| Nitrate nitrogen | −0.564* | −0.409 |
| Nitrite nitrogen | 0.265 | 0.283 |
| Total phosphorous | 0.460 | 0.474* |
| Phosphate phosphorus | 0.522* | 0.618** |
| TN:TP | −0.552* | −0.546* |
| Chlorophyll a | −0.230 | −0.309 |
*P < 0.05, **P < 0.01. ORP, oxidation reduction potential.
In terms of community composition, our correlation-based redundancy analysis showed that TOC was significantly correlated with unidentified anammox genera. NH4-N was strongly associated with Ca. Brocadia and Ca. Kuenenia, while NO3-N was strongly associated with Ca. Scalindua (Fig. 4a). Canonical correlation analysis further compared the relationships between environmental variables and anammox bacterial community composition at the OTU level (Fig. 4b). More specifically, TOC was significantly correlated with the OTUs (21–26) affiliated to unidentified anammox genera. The dominant OTU1 (Ca. Brocadia) and OTU13 (Ca. Kuenenia) were significantly positively related to TOC. However, the remaining OTUs affiliated to Ca. Brocadia or Ca. Kuenenia were related to NH4-N and NO3-N. NO3-N was strongly associated with the OTU20 affiliated to Ca. Scalindua.

Redundancy analysis (RDA)/canonical correlation analysis (CCA) ordinations showing the effect of environmental variables on anammox bacterial community composition at genus level (a) and OTU level (b) (*P < 0.05, **P < 0.01).
DISCUSSION
Distribution patterns of anammox bacteria across the water column
We demonstrated that anammox bacteria were ubiquitously distributed in the water column of a deep subtropical reservoir based on both microscopy and molecular approaches, even in fully oxygenated (surface) waters. Although anammox bacteria are known as strict anaerobes, the tolerance of anammox bacteria to elevated oxygen concentration has been previously reported (Fu et al.2015). One possible explanation is that anammox cells may rely on suspended particles (Woebken et al.2007); this may enable access not only to the anoxic microniche, but also to particle-associated sources of nitrite and/or ammonium (Ganesh et al.2015).
Anammox bacteria were not randomly distributed throughout the water column in our reservoir and may adapt to different environmental niches. We found that anammox bacterial abundance increased significantly with depth under conditions of thermal stratification. This may be due to different environmental conditions between the epilimnion and hypolimnion. For example, in our study, DO was a significant environmental parameter affecting the abundance distribution of anammox bacteria, consistent with a previous study (Dalsgaard et al.2014), since thermal stratification generates an oxygen gradient in the water column and anammox bacterial cell abundance increases with water depth. However, the hzsB gene abundance was distributed homogeneously throughout the water column under mixing conditions. All of environmental parameters were uniform throughout the water column at the breakdown of stratification, and such homogeneous environmental conditions may lead to the uniform distribution of anammox bacteria in the water column. In subtropical stratified reservoirs, water stratification and vertical mixing may be key factors for anammox bacterial distribution and dynamics.
Relationship between anammox bacteria and the cyanobacterial bloom
To the best of our knowledge, this is the first study to compare the anammox bacterial dynamics during and after a cyanobacterial bloom in a lake or reservoir ecosystem. The hzsB gene is a newly effective marker for the investigation of anammox bacterial abundance in different ecosystems (Zhu et al.2017; Wang et al.2017). Our results showed that the cyanobacterial bloom significantly boosted hypolimnelic anammox bacterial hzsB gene abundance. NH4-N was significantly and positively correlated with anammox bacterial abundance in our reservoir, and this is in agreement with previous observations in a freshwater reservoir (Shen et al.2017a). Our initial sampling was launched during the intermediate and later stages of a cyanobacterial bloom event, and therefore some dead and senescent cyanobacterial cells might have been present and eventually sunk to the deep water. Under bottom anoxic conditions, NH4-N can be released into the water through the mineralization of organic matter from decaying cyanobacteria (Rysgaard et al.1993). The bottom NH4-N concentration showed a sharp increase during the bloom period (Supplementary Table S3). It can be speculated that the higher substrate concentration may be favorable to the growth of anammox bacteria. Previous studies have found that there was generally a good correlation between anammox activity and abundance (Hou et al.2015). Anammox bacterial abundance may have the potential to predict the activity of anammox bacteria. Based on stable isotope tracing, we further found that the anammox process roughly accounted for 27.3% of N2 production in the surface sediment during the cyanobacterial bloom. This was slightly higher than that recorded in natural freshwater wetland sediments, where anammox process could contribute to about 20% in the loss of fixed nitrogen (Shen et al.2016). These estimates indicated that the contribution of anammox to N removal may not be negligible in reservoir ecosystems. In addition to DO and NH4-N, NO2-N level can influence anammox bacterial abundance (Sun et al.2013), but in our study, NO3-N instead of NO2-N had a significant effect on anammox bacterial abundance. This finding is consistent with previous observations in a eutrophic freshwater lake (Yoshinaga et al.2011). The degradation of dead cyanobacterial cells can dramatically increase water dissolved organic carbon concentration (Peng et al.2017), thus providing an additional carbon source for heterotrophic denitrifying bacteria. The bottom NO3-N concentration decreased from 0.20 to 0.11 mg L−1 during the bloom period (Supplementary Table S3), with denitrification contributing to about 72.7% of N2 production. Moreover, we detected the presence of anammox activity and high anammox bacterial abundance during the bloom period, though little NO2-N was detected in the bottom waters. This feature suggested that denitrification may be a primary source of nitrite for anammox bacteria in anaerobic bottom waters during bloom period, demonstrating the coupling of anammox and denitrification, which is in line with previous reports (Zhou et al.2014; Smith et al.2015).
Reservoir water quality gradually improved accompanied by the disappearance of the cyanobacterial bloom, in tandem with the synchronous decrease of anammox bacterial abundance. One possibility is that decreased decomposition and mineralization processes can alter environmental conditions, further influencing anammox bacterial abundance. We found that temperature, TP, PO4-P and TN:TP showed significant correlations with anammox bacterial abundance or hzsB/16S rRNA. These four environmental factors are important for controlling the cyanobacterial bloom. For instance, decreasing temperature and phosphorus concentration, and increasing TN:TP ratio would result in a collapse of cyanobacterial biomass (Paerl et al. 2013). Although the exact mechanism for these environmental factors influencing anammox bacteria is still not well understood, these results indirectly confirm that there may be a tight link between anammox bacterial abundance and the cyanobacterial bloom. Last but not least, the breakdown of thermal stratification resulted in more oxic conditions in the water column, and thus limited anammox bacterial growth.
Anammox bacterial community composition and diversity
A distinct community shift was observed in surface waters, in which the dominant taxa changed from unidentified anammox genera to Ca. Brocadia. It is reported that Ca. Brocadia have relatively high tolerance to oxygen and a high growth rate (Oshiki et al.2011). An alternative, or additional, explanation is that Ca. Brocadia harbor diverse metabolic pathways, such as the use of low molecular mass organic substrate (acetate) as an electron donor (Kartal et al.2007). A recent study has shown that heterotrophic decomposition of cyanobacterial biomass can lead to an accumulation of acetate (Bogard et al.2014). Thus, the use of alternative electron donors leads to the better adaptability of Ca. Brocadia than other anammox genera in surface waters. The collapse of a cyanobacterial bloom has been shown to influence the dynamics of dissolved organic carbon in freshwater ecosystems (Ye et al.2011). In this study, organic carbon was the most important factor influencing the anammox bacterial community structure, which has been observed in lake sediments (Yang et al.2017b). It is possible that organic carbon made a direct contribution to heterotrophic denitrification, which in turn supplied nitrite used by the autotrophic anammox bacteria (Trimmer, Nicholls and Deflandre 2003). Environmental changes can affect the microbial activities of anammox bacterial competitors (Oshiki, Satoh and Okabe 2016). Denitrifiers can also become anammox bacterial competitors when substrate availability becomes low. For example, the stronger competition for nitrite induced by lower organic matter between anammox bacteria and denitrifying organisms can result in higher diversity of anammox bacteria (Hu et al.2012). In this study, the diversity of anammox bacteria in the middle and bottom waters gradually increased following the cyanobacterial bloom, and there were more unique OTUs in the non-bloom period than the bloom period. Further, TOC had a significant negative effect on the Simpson index. Therefore, the decline of organic carbon in the non-bloom period might be related to the higher biodiversity of anammox bacteria. Taken together, our results indicated that the occurrence and disappearance of a cyanobacterial bloom may have an impact on anammox bacterial community composition and diversity.
In the present study, three known anammox genera (Ca. Brocadia, Ca. Kuenenia and Ca. Scalindua) were detected, of which Ca. Brocadia dominated the anammox bacterial communities. Both Ca. Brocadia and Ca. Kuenenia are mainly affiliated with freshwater environments (Kartal et al.2006). Recent research showed that both Ca. Brocadia and Ca. Kuenenia were the closest co-occurring groups, which implies that they could share similar habitats (Sonthiphand, Hall and Neufeld 2014). For instance, both Ca. Brocadia and Ca. Kuenenia would prefer NH4-N-rich environments (Oshiki, Satoh and Okabe 2016). Our redundancy analysis results showed that NH4-N was positively associated with Ca. Brocadia and Ca. Kuenenia. In contrast, Ca. Scalindua is commonly associated with marine environments (Schubert et al.2006). It is most likely that anammox bacteria have genus-specific habitats. The response of anammox bacteria to environmental changes may differ within the same genus. For instance, the dominant OTU1 (Ca. Brocadia) and OTU13 (Ca. Kuenenia) were significantly positively related to TOC, but the remaining OTUs affiliated to Ca. Brocadia or Ca. Kuenenia were related to NH4-N and NO3-N. Therefore, anammox bacteria likely have species-specific habitats. Additionally, consistent with previous studies (Li and Gu 2016), three novel groups were detected in our samples, suggesting that unknown anammox events are very common in freshwater systems and are yet to be discovered. Finally, anammox bacterial distribution could be partly attributed to methodological limitations. On the one hand, most of the PCR primers targeting the 16S rRNA genes cannot cover all known anammox bacteria (Amano et al.2007). On the other hand, clone library analysis based on specific primers may lead to some biases (Shen et al.2017b), as only dominant OTUs can be detected. In contrast, high-throughput sequencing using universal primers has high coverage of microbial diversity and may help to detect the anammox species with very low abundance. In future, the application in high-throughput sequencing technologies would substantially boost our understanding of anammox bacterial diversity in reservoir ecosystems.
In conclusion, our multipronged approach provided reliable and integrated information on the abundance, composition and diversity patterns of anammox bacteria during and after a cyanobacterial bloom in a subtropical stratified reservoir. We found that the cyanobacterial bloom contributed to 9-fold and 52-fold increase of bottom anammox bacterial abundance compared with non-bloom stratification and non-bloom mixing periods, respectively. Sequence analysis revealed the co-existence of different genera of anammox bacteria, with the Ca. Brocadia being the dominant genus. Cyanobacterial bloom-related changes in environmental conditions (e.g. NH4-N and TOC) combined with water stratification or mixing significantly influenced the spatiotemporal patterns of the anammox bacterial community. Given that cyanobacterial blooms are likely to be more frequent under predicted future conditions of climate variability and human activity, anammox process should be included in studies of the mechanisms of cyanobacterial bloom formation and disappearance, particularly in terms of carbon–nitrogen cycle coupling in inland ecosystems.
SUPPLEMENTARY DATA
Supplementary data are available at FEMSEC online.
Acknowledgements
We thank Prof. David M. Wilkinson for his comments on this paper. The authors declare no conflicts of interest.
FUNDING
This work was supported by the Science & Technology Basic Resources Investigation Program of China (2017FY100300), the National Natural Science Foundation of China (31370471 and 31500372) and the Natural Science Foundation of Fujian Province, China (2015J05075).
Conflict of Interest. None declared.
