


Abstract
We hypothesized that the greater the intra- or interventricular dyssynchrony (intraD, interD), the more effective cardiac resynchronization therapy (CRT) is. We sought to improve patient selection for CRT by using novel ECG dyssynchrony criteria.
Left ventricular (LV) intraD was estimated by the absolute time difference between the intrinsicoid deflections (ID) in leads aVL and aVF divided by the QRS duration (QRSd): [aVLID − aVFID]/QRSd (%). InterD was estimated from the formula: [V5ID − V1ID]/QRSd (%). Their >25% value indicated electrical dyssynchrony present (ED+) and ≤25% value electrical dyssynchrony absent (ED−) diagnoses. Using the intraD + interD criteria (intra + interDC) together, if at least one of them indicated ED+ diagnosis, a final ED+ diagnosis, if both indicated ED− diagnosis, a final ED− diagnosis was made. Two authors, blinded to CRT response, retrospectively analysed pre-CRT ECGs of 124 patients with known CRT outcome. CRT response was defined as improvement of ≥ 1 NYHA class, being alive and having no hospitalizations for heart failure during 6 months of follow-up. 35/124 (28%) patients were non-responders (NRs), using the traditional criteria (TC) correct diagnosis was made in the remaining 89/124 (72%) responder (R) cases. The test accuracy (TA) of intra + interDC + TC [100/124 (81%), P < 0.001] was superior to that of TC [89/124 (72%)] due to its superior TA [36/43 (84%) vs. 29/43 (67%), respectively, P = 0.0156] in the non-specific intra-ventricular conduction disturbance (NICD) subgroup [43/124 (35%)]. In the left bundle branch block subgroup [70/124 (56%)] there was no between-criteria difference in TA.
The intra + interDC + TC predicts clinical response after CRT more accurately than TC alone, due to greater TA in the NICD subgroup.
What’s new?
We devised two simple, novel surface ECG criteria for quick bedside estimation of inter-ventricular and LV intra-ventricular dyssynchrony (interD and LV intraD).
The new ECG dyssynchrony criteria applied together with the TC for patient selection for CRT could better predict the outcome of CRT than the use of TC alone in patients with NICD pattern.
In these patients the ED − diagnosis established by the new ECG dyssynchrony criteria predicted NR outcome with 100% certainty and the likelihood of NR outcome with an ED + diagnosis was as low as in patients with LBBB pattern
If our preliminary results will be confirmed by larger randomized studies or by retrospective testing of our ECG dyssynchrony criteria in previous studies, the novel ECG dyssynchrony criteria can be used in the future for better selection of patients with NICD pattern, the second largest group of CRT candidates, for CRT.
Introduction
Most recent large randomized studies demonstrated benefits of cardiac resynchronization therapy (CRT) only in patients with left bundle branch block (LBBB) pattern or with QRS duration (QRSd) ≥150 ms, but CRT did not decrease the total mortality and/or non-fatal heart failure events in patients with non-LBBB pattern and a QRSd of 120–149 ms.1–8 Moreover, a subgroup analysis of the EchoCRT trial9 demonstrated that patients with a QRSd <130 ms may be harmed by CRT. Therefore, the current 2016 ESC heart failure guidelines10 consider CRT contra-indicated in patients with a QRSd <130 ms. For these reasons the indication of CRT in patients with non-LBBB pattern and a QRSd of 130–149 ms is questionable according to the current guidelines. A recent meta-analysis of randomized CRT trials using individual, instead of aggregate, patient data has shown that QRSd was the only independent predictor of CRT effect on all-cause mortality and heart failure hospitalizations.11 Especially QRSd >140 ms indicated a high probability of benefit from CRT. After adjusting for QRSd in their analysis, QRS morphology was no longer a determinant of the clinical response to CRT.11
The worse outcome of CRT in patients with non-LBBB pattern than with LBBB pattern might be due to less dyssynchrony manifested in a shorter QRSd and unfavourable patient characteristics for CRT outcome such as more ischemic etiology and predominance of male patients in patients with non-LBBB pattern.1,12–14 Another important reason for worse outcome of CRT in patients with non-LBBB pattern is that the current CRT technique is devised to eliminate dyssynchrony caused by LBBB pattern, but it is not appropriate in patients with pure right bundle branch block (RBBB) pattern (without associated left hemiblock) and may not be appropriate in patients with non-specific intra-ventricular conduction disturbance (NICD) pattern to eliminate dyssynchrony. Thus, contrary to the mainstream view, the main determinant of CRT outcome might not be the QRS morphology but rather the presence (or absence) of significant dyssynchrony and the ability of the applied CRT technique to eliminate it.12
QRS duration, irrespective of QRS morphology and ejection fraction (EF), is a robust and independent marker of mortality and morbidity and CRT response in heart failure patients, but QRSd is only a rough measure of dyssynchrony and correlates poorly with CRT response.11,12 Therefore, a QRSd of ≥150 ms more reliably indicates a significant dyssynchrony than a QRSd of 130–149 ms.
Recent studies supported the view that the presence of significant intra- and/or interD is the main determinant of CRT outcome in patients with non-LBBB pattern. When intraD or interD was revealed by speckle tracking echocardiography or when the left ventricular (LV) electrode was placed at the latest activated or adjacent LV regions, the outcome of CRT evaluated with hard primary endpoints was as beneficial in patients with non-LBBB (either NICD or RBBB) pattern as in patients with LBBB pattern and/or >150 ms QRS width.12,13,15–17
The intraD and interD parameters measured by imaging modalities are based on alteration in the sequence of mechanical contraction of the ventricles. However, the primary determinant of dyssynchrony is the electrical activation of the heart, which determines the sequence of mechanical contraction. Thus, ECG should be able to better or at least as reliably indicate dyssynchrony than imaging modalities.12 To this end, we devised two new surface ECG criteria for the estimation of interD and LV intraD in order to improve patient selection for CRT.
Methods
Patients
We retrospectively analysed de-identified data of 124 consecutive patients who underwent CRT between February 2003 and January 2009 at the Heart and Vascular Center of Semmelweis University, Budapest and had pre-implantation 12-lead ECG as well as all pre-implantation and 6 months follow-up data necessary to determine the response to CRT. The study complies with the Declaration of Helsinki and was approved by the Institutional Committee on Human Research. Response to CRT (clinical responder (R)) was defined as improvement of NYHA class ≥1, being alive and having no hospitalizations for heart failure during 6 months of follow-up as proposed by Packer18 and was used in several studies19–21 to assess CRT response. Patients were selected for CRT based on recommendations in use at the time of the study22 (traditional criteria (TC)), i.e. they should have LV EF ≤35%, QRSd ≥120 ms, NYHA functional class III–IV heart failure refractory to optimal pharmacotherapy and their condition could not have been potentially improved by coronary revascularisation or valve surgery. The selection of a patient for CRT using the TC meant that an expected R diagnosis was made using the TC. Thus, if the patient was a clinical R, the TC made a correct diagnosis, if the patient was a clinical non-responder (NR), the TC made an incorrect diagnosis. Etiology of heart failure was considered ischemic in the presence of significant coronary artery disease (≥50% stenosis in one or more major epicardial coronaries) and/or a history of myocardial infarction or prior revascularisation. A different set of pre-implantation 12-lead ECGs recorded in 68 other patients with known CRT outcome was used to devise the best variant of the new ECG dyssynchrony criteria and their optimal cutoff value from that used to test the already established criteria. Their ECGs and data were not used in the results of this study.
New ECG ventricular dyssynchrony criteria
We developed two new ECG criteria serving as surrogate markers of intraD and interD.
To estimate LV intraD, the absolute value of the difference between the times to onset of intrinsicoid deflections (ID) in leads aVL and aVF, reflecting the electrical potentials of LV lateral and inferior walls, was calculated and divided by QRSd:
[aVLID − aVFID]/QRSd (%)
InterD was estimated by calculating the absolute value of the difference between the times to onset of the ID in leads V5 and V1, reflecting the electrical potentials of the LV and right ventricle (RV), divided by QRSd:
[V5ID − V1ID]/QRSd (%)
The new criteria were applied on the pre-implantation ECG in patients selected for CRT by the TC. If their value was >25%, the patient was diagnosed as electrical dyssynchrony present (ED+), if their value was ≤25%, electrical dyssynchrony absent (ED−) diagnosis was made. When the intraD and interD criteria (intra + interDC) were applied together, a final ED+ diagnosis was made if at least one of them indicated ED+ diagnosis and the patient was considered an expected R, a final ED− diagnosis was made if both indicated ED− diagnosis and the patient was considered an expected NR.12 The first and second authors, blinded to the CRT response, retrospectively and independently analysed 12-lead ECGs recorded at a paper speed of 25 mm/s in 124 patients with known CRT outcome. Initially, applying the intra + interDC together, they disagreed in the diagnosis of 12 patients, but after reevaluation of these cases they could resolve the disagreement by consensus. Data based on the consensus of the two reviewers are presented. Figure 1 demonstrates the practical application of the new ECG dyssynchrony criteria.
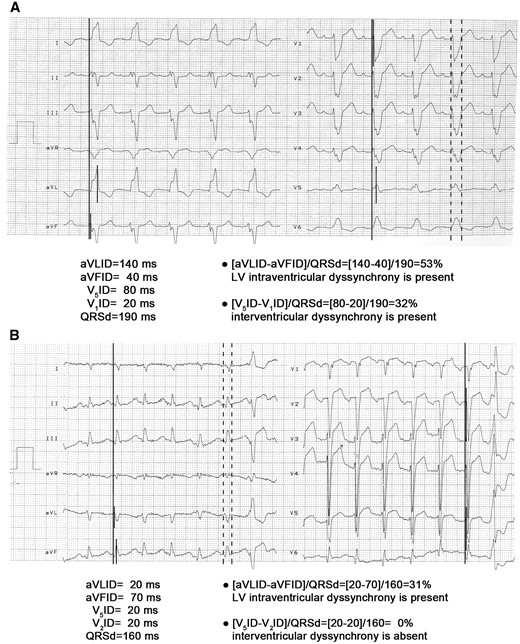
The practical application of the new ECG dyssynchrony criteria. Long vertical continuous lines denote the onset of the QRS complexes and short vertical continuous lines mark the onset of the ID, the time interval between them is time to the onset of the ID. Dashed lines mark the measurement of QRSd. Panel A: An ECG recorded in a patient with LBBB pattern is shown. With the LV intraD criterion an ED+ diagnosis is made, as its value is 53% (i.e. >25%). With the interD criterion also an ED+ diagnosis is established, as its value is 32% (i.e.>25%).When the two new ECG dyssynchrony criteria are applied together, a final ED+ diagnosis is made, if at least one of them indicates ED+ diagnosis. If both indicate ED− diagnosis, a final ED− diagnosis is made. Thus, using the two new ECG dyssynchrony criteria together predicted this patient as an expected R. Panel B: An ECG recorded in a patient with NICD pattern is shown. Since in lead V1 a QS complex is present, therefore we measured V2ID instead of V1ID. With the LV intraD criterion an ED+ diagnosis is made, as its value is 31% (i.e. >25%), with the interD criterion an ED− diagnosis is made, as its value is 0% (i.e. ≤25%). Thus, this patient is an expected R applying the two dyssynchrony criteria together.
Application of the two new intra- and interventricular dyssynchrony ECG criteria
To measure the time to the onset of ID we used the interval from the onset of the QRS to the peak of the R wave. When QS complex was present either in lead aVF or aVL, we used the interval from the QRS onset to S nadir, which should be only negligibly (≤10 ms) longer than the QRS onset to R peak interval. If a QS complex was present in lead V1 or lead V5 we used the V2ID instead of V1ID and the V6ID instead of V5ID. If there were QS complexes both in leads V1 and V2 or both in leads V5 and V6, we used the interval from the QRS onset to S nadir instead of the interval from the onset of the QRS to the peak of the R wave. When there were multiple R waves within the QRS complex we chose the R wave preceding the final QRS downstroke.
The onset of the QRS complex was defined by the earliest ventricular depolarization among the simultaneously recorded (three or six) channels including leads aVL and aVF or leads V1 and V5. We checked the QRSds in all leads, where the onset and end of the QRS complex was clearly visible, and the longest QRSd was chosen for calculation as the QRS width should be equal in all leads.
The rationale behind the new ECG dyssynchrony criteria
The time to the onset of the ID measured in a unipolar lead represents the time elapsing from the onset of the ventricular activation until the electrical impulse reaches the myocardium located right under the exploring unipolar electrode.23 Physiologically the anterior and posterior papillary muscles are activated earliest and synchronously in the LV via the left anterior and posterior fascicles and slightly later other areas of the LV are activated approximately simultaneously (Figure 2 upper panel). The left upper panel of Figure 2 is similar to a parasternal short axis view obtained during echocardiography. The aVL and aVF unipolar leads are located near to the anterior and posterior papillary muscles respectively, thus the onset of ID in these unipolar leads can be used as a surrogate marker of the time elapsing from the onset of the ventricular activation to the electrical activation of the papillary muscles. Since physiologically the papillary muscles are activated synchronously, the difference between aVLID and aVFID should be zero or very close to zero. LV intraD, when at least one LV myocardial region is activated later than during the normal LV myocardial activation sequence, usually results in a delayed activation of one papillary muscle compared with the other. Therefore either aVLID or aVFID will be longer than the other one, and the absolute value of their difference will be ≫0. Thus the [aVLID −aVFID] might be a good marker of any kind of LV intraD irrespective of which type of intra-ventricular conduction disturbance is the underlying cause. In patients with LBBB pattern the RV is activated initially and the LV is activated from the RV through the inter-ventricular septum followed by a slow muscle to muscle conduction in the left side of the septum until the electrical impulse reaches the Purkinje fibres near to the left side of the septum (Figure 2 middle panel). The septal breakthrough site is much closer to the posterior than to the anterior papillary muscle, therefore the lateral and anterior LV free wall myocardium is activated later than the inferior LV myocardium in LBBB, resulting in a significantly longer aVLID than aVFID, thus, the [aVLID −aVFID] will be ≫0.12
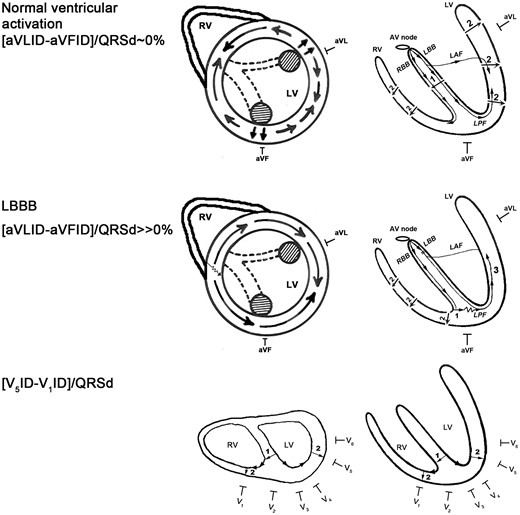
The rationale behind the new ECG dyssynchrony criteria. On the right side of the figure schematic long axis sections of the heart are shown. The upper and middle left panels show schematic short axis sections of the heart similar to the parasternal short axis view at the mid-papillary muscle level obtained by transthoracic echocardiography. The lower left panel shows a schematic horizontal section of the heart. The striped circles represent the anterior and posterior papillary muscles activated via the left anterior and posterior fascicles denoted by dashed lines. The straight line arrows represent normal conduction velocity, the serrated line part of the arrow indicates slowed conduction velocity. LAF, left anterior fascicle; LBB, left bundle branch; LBBB, left bundle branch block; LPF, left posterior fascicle; LV, left ventricle; RBB, right bundle branch; RV, right ventricle. See text for further explanation. (Reproduced with permission from reference 12.)
The lower panel of Figure 2 shows the rationale of the interD ECG criterion. The onset of ID in leads V1 and V5 reflects approximately the time that elapses from the onset of ventricular activation until the right and left ventricles are activated respectively, since the unipolar leads V1 and V5 reflect the electrical activation potentials of RV and LV respectively. The difference between V5ID and V1ID is quite small but not zero during normal ventricular activation (approximately 20 ms), because the normal ID is ≤ 30 ms in leads V1 or V2 and is ≤50 ms in leads V5 or V6.24 Therefore, the interDC should still have a low (≤25%) value during normal ventricular activation and/or in the absence of interD and a > 25% value in the presence of interD, which is associated with an increase in the value of [V5ID − V1ID] to ≫20 ms.12
Definition of intra-ventricular conduction disturbances
Intra-ventricular conduction disturbances were defined according to the 2009 AHA/ACCF/HRS recommendations.25
Among the 124 patients whose data were analysed in this study 70 had LBBB, 43 NICD, 7 RBBB plus left anterior fascicular block, 2 masquerading bundle branch block patterns and 2 had normal QRSd. We analysed the data of two patient subgroups (LBBB and NICD) only, as the small number of other ECG morphologies was inappropriate for statistical analysis.
Statistical analysis
Differences in baseline characteristics between the LBBB and NICD patient subgroups were calculated using the Student's unpaired t test. Gender distribution and etiology in the two patient subgroups were compared by chi square test. True positive and negative, false positive and negative results expressed as percentage of the total number of observations were compared between two methods by constructing 2 × 2 cross tables and then by using the non-parametric McNemar’s test for comparing two related proportions, to determine which method was better. The between-groups comparison of positive predictive values (PPV) of ED+ diagnosis was done using the Z test. A P < 0.05 value was considered statistically significant. All continuous variables are expressed as mean + SD unless otherwise stated. The Kappa statistic was performed to determine inter-observer agreement, which was defined as near complete if κ > 0.8, good if κ = 0.61–0.8, moderate if κ = 0.41–0.6, fair if κ = 0.21–0.4 and poor if κ < 0.2.26 Statistical analysis was performed using GraphPad Prism5 (GraphPad Software Inc., San Diego, CA, USA).
Results
Patient characteristics
There were no significant differences in age, etiology, QRSd, EF and baseline rhythm between the LBBB and NICD subgroups, however the QRSd was longer in the LBBB subgroup in a borderline significant manner (P = 0.0617). There were significantly (P = 0.01) more male patients in the NICD subgroup than in the LBBB subgroup (Table 1).
Most important patient characteristics
| Characteristics | All patients n=124 | LBBB subgroup n=70 | NICD subgroup n=43 |
|---|---|---|---|
| Age (year) | 67.72 ± 9.16 | 68.6 ± 9.5 | 66.9 ± 7.9 |
| Gender (female/male) | 26/98 | 22/48 | 4/39* |
| Etiology (ICM/NICM) | 58/66 | 30/40 | 21/22 |
| QRSd (ms) | 166.15 ± 25.63 | 171 ± 23.45 | 162.2 ± 24.97** |
| LV EF (%) | 27.1 ± 6.6 | 27.6 ± 6.9 | 26.4 ± 6.1 |
| Baseline rhythm | |||
| Sinus rhythm | 97 (78%) | 60 (86%) | 33 (77%) |
| Atrial fibrillation | 25 20%) | 9 (13%) | 9 (21%) |
| Atrial tachycardia | 2 (2%) | 1 (1%) | 1 (2%) |
Significant differences are highlighted by bold numbers.
ICM, ischemic cardiomyopathy; LBBB, LV, left ventricle; NICD; NICM, nonischemic cardiomyopathy.
P = 0.01 vs. LBBB subgroup,
P = 0.0617 vs LBBB subgroup
Test accuracy
As 35/124 (28%) of the patients were NRs and 89/124 (72%) were Rs the test accuracy (TA) of the TC was 72%. Among the 35 NRs 12 patients died, 28 patients were hospitalized for heart failure and 29 patients had unchanged or worse NYHA class during the 6 months follow-up.
During the initial ECG evaluation the two observers obtained similar results: the inter-observer agreement was good [0.792 (0.681–0.903 95%CI)]. In the Results section data based on the consensus of the two reviewers are presented. The TA of the intraD and interD criteria applied together with TC (intra + interDC + TC) was superior to that of TC applied alone in all patients (Table 2). The superior TA of the intra + interDC + TC was due to superior TA achieved in the NICD subgroup. The TA was not improved by the application of intra + interDC + TC compared to that of TC alone in the LBBB subgroup, which responds well to CRT anyway (Table 2).
The diagnostic accuracy of intra + interDC together with TC and TC alone in all patients and in subgroups
| Criteria | Clinical R status correct dg (%) | ||
|---|---|---|---|
| All patients n = 124 | LBBB subgroup n = 70/124 (56%) | NICD subgroup n = 43/124 (35%) | |
| Intra + inter DC + TC | 100/124 (81)*** | 54/70 (77) | 36/43 (84)* |
| TC | 89/124 (72) | 56/70 (80) | 29/43 (67) |
| Criteria | Clinical R status correct dg (%) | ||
|---|---|---|---|
| All patients n = 124 | LBBB subgroup n = 70/124 (56%) | NICD subgroup n = 43/124 (35%) | |
| Intra + inter DC + TC | 100/124 (81)*** | 54/70 (77) | 36/43 (84)* |
| TC | 89/124 (72) | 56/70 (80) | 29/43 (67) |
Significant differences are highlighted by bold numbers.
dg, diagnosis; intra+interDC, intraD and interD criteria; LBBB; NICD; TC.
P < 0.05,
P < 0.01,
P < 0.001 vs. TC alone.
Sensitivity, specificity and predictive values
Table 3 shows the sensitivity, specificity and predictive values for ED+ diagnosis of the different methods. By definition the TC had a sensitivity of 100%, a specificity of 0% and a negative predictive value (NPV) of 0%, because the patient selection for CRT was done using the TC. Therefore, only the PPV of the three methods were comparable by statistical methods. The intra + interDC + TC showed only a trend for a superior PPV to that of TC applied alone (77.9% vs. 71.8% respectively), which was due to the better PPV (which showed only a superior trend as well) in the NICD subgroup (80.6% vs. 67.4% respectively). In the LBBB subgroup there were no between-methods differences in the PPV.
The sensitivity, specificity and predictive values of ED+ diagnosis using the intra + interDC together with TC and TC alone in all patients and in subgroups
| Criterion-subgroup | Sens. (%) | Spec. (%) | PPV (%) | NPV (%) |
|---|---|---|---|---|
| Intra + interDC + TC all patients | 95.7 | 35.9 | 77.9 | 77.8 |
| TC all patients | 100 | 0 | 71.8 | 0 |
| Intra + interDC + TC LBBB | 100 | 14.3 | 82.4 | 100 |
| TC LBBB | 100 | 0 | 80 | 0 |
| Intra + interDC + TC NICD | 100 | 50 | 80.6 | 100 |
| TC NICD | 100 | 0 | 67.4 | 0 |
Intra+interDC, intraD and interD criteria; LBBB; NICD; NPV, negative predictive value; PPV, positive predictive value; Sens., sensitivity; Spec., specificity; TC, The sensitivity of TC was always 100% and the specificity and NPV 0%, because patient selection to CRT was based on the TC.
The sensitivity, specificity, PPV and NPV values for ED+ diagnosis are identical to the specificity, sensitivity, NPV and PPV values for ED− diagnosis respectively. Since the ED+ diagnosis established using the new ECG criteria had a 100% sensitivity and NPV in the NICD subgroup, it follows that the ED− diagnosis by the new ECG criteria had a 100% specificity and PPV, meaning that all patients with NICD pattern diagnosed as expected NR by the new ECG criteria proved to be a NR after 6 months follow-up!
Discussion
Major findings
We have demonstrated that the application of the new ECG interD and LV intraD criteria together with the TC (intra + interDC + TC) was superior to the application of TC alone in the prediction of clinical response to CRT after 6 months follow-up in patients selected for CRT using the TC. This superiority was due to improved TA in the NICD subgroup. In the LBBB subgroup, which responds well to CRT, the intra + interDC + TC predicted similarly the CRT outcome to TC alone.
The most important novel finding of this study is that the new ECG dyssynchrony criteria may have great value in the selection of patients with NICD pattern and a QRSd of 130–149 ms who might benefit from CRT, because according to the current guidelines the indication of CRT is questionable in these patients. Our results showed that the ED− diagnosis obtained by the intra + interDC + TC had a 100% specificity and PPV in the NICD subgroup. Thus, all patients with NICD pattern who were diagnosed as ED− by the intra + interDC + TC proved to be clinical NRs 6 months after CRT. On the other hand when ED+ diagnosis was made in patients with NICD pattern by the application of the intra + interDC + TC the PPV of these patients for ED+ diagnosis was 80.6%, which means that the expected NR rate in these patients is <20%, identical to the expected NR rate in the LBBB subgroup. Thus, the likelihood that a patient with NICD pattern predicted as an expected R with the new ECG dyssynchrony criteria will be a clinical NR after CRT is identical to that of a patient with LBBB pattern. If the value of the new ECG dyssynchrony criteria will be confirmed in future prospective, multicentre studies enrolling a greater number of patients, these ECG criteria can be used to determine which patient with NICD pattern and a QRSd of 130–149 ms will or will not benefit from CRT.
The ventricular activation sequence in patients with NICD pattern
There are no data about the ventricular activation sequence in patients with NICD pattern, except from one ECG mapping study investigating only a small number (n = 15) of patients.19 In these patients the ventricular activation sequence was highly variable, heterogeneous, characteristic activation pattern(s) could not be identified. The only consistent finding was the presence of fewer and smaller lines of slow conduction in the LV compared with LBBB pattern, which is responsible for the less dyssynchrony and shorter QRSd.19 Although the ventricular activation sequence is not known in patients with NICD pattern, the new ECG dyssynchrony criteria might still be able to indicate the presence of significant interD and/or LV intraD in these patients.
Literature data supporting our results
We devised the LV intra-ventricular ECG criterion in 2010.27 A more recent study28 has shown that delayed ID onset in lateral ECG leads predicted LV reverse remodelling after CRT.28 In this study the predictors of CRT response in subjects with LBBB and NICD after multivariate logistic regression analysis were longer preimplantation ID in leads I and aVL, a greater ID in lead I/QRSd ratio and a longer ID in lead I and V1ID difference. Preimplant QRSd was not a significant predictor of CRT response.28 Ploux et al.19 investigated patients with LBBB and NICD pattern selected for CRT by exactly the same criteria as in our study, published very similar results to ours. They used ECG imaging, a promising new non-invasive method developed to provide epicardial electrical activation map by combining body surface mapping with computed tomography. The total right ventricular activation time (RVTAT) was similar in the two patient groups, however the total LV activation time (LVTAT) and the ventricular electrical uncoupling (VEU), calculated as the difference in the mean LVTAT and RVTAT, were longer in the LBBB group. VEU is a measure of both interD and LV intraD, because its duration can be increased both by a delay in the onset of LV activation relative to RV activation determined mainly by the trans-septal activation time and LV intra-ventricular activation delay. A >50 ms cutoff value of VEU predicted clinical CRT response better than QRSd irrespective of the presence of LBBB with 90% sensitivity, 82% specificity, 90% PPV, and 82% NPV. Identical to our results ECG imaging did not enhance the ability to predict clinical response in patients with LBBB pattern, but predicted clinical response in 3/5 (60%) patients and clinical non-response in 9/9 (100%) patients with NICD pattern. Thus, particularly NICD patients could benefit from the determination of VEU. Similarly to our results Gold et al.29 found that electrical dyssynchrony measured by the interval from the onset of the QRS from the surface ECG to the first large peak of the LV electrogram (QLV interval), obtained at the LV stimulation site during CRT, predicted CRT response. Longer QLV was associated with a better CRT response even after adjusting for QRSd and LBBB, and a QLV > 95 ms predicted beneficial CRT response. These results are also consistent with our conclusion that the main determinant of CRT response is the presence or absence of electrical dyssynchrony. Our simple, novel ECG dyssynchrony criteria, which can be applied quickly at the bedside demonstrate the hidden potential still present in the 12-lead surface ECG, as they seem to be able to predict CRT response as well as the certainly more accurate, but much more complicated, still investigational and not widely available ECG imaging and the invasive and not pre-CRT QLV methods.
Limitations
The most important limitation of this study is that it is a single centre, retrospective study conducted in a relatively small number of patients. Our results need to be confirmed in prospective, multicentre studies enrolling a greater number of patients. The short follow-up time is another limitation. Since LV end-systolic volume data were available in only 10% and both pre- and post-CRT LVEF data in 82/124 (66%) patients and EF was measured by various investigators, who might have used different methods, we could not use these echocardiography parameters to determine CRT Rs.
It should be tested whether the new ECG dyssynchrony criteria predict CRT response defined as LV volume response or reduction in total mortality or a composite endpoint of total mortality and hospitalization for heart failure during a longer follow-up period.
Conclusions
We devised novel electrocardiographic LV intraD and interD criteria that improved patient selection for CRT compared with TC alone, particularly in patients with NICD pattern. In these patients the ED− diagnosis predicted NR outcome with 100% certainty and the likelihood of NR outcome with an ED+ diagnosis was as low as in patients with LBBB pattern.
Conflict of interest: none declared.
