


Abstract
To examine pericoronary adipose tissue (PCAT) and periaortic adipose tissue (PAAT) density on coronary computed tomography angiography for assessing arterial inflammation in Takayasu arteritis (TAK) and atherosclerosis.
PCAT and PAAT density was measured in coronary (n = 1016) and aortic (n = 108) segments from 108 subjects [TAK + coronary artery disease (CAD), n = 36; TAK, n = 18; atherosclerotic CAD, n = 32; matched controls, n = 22]. Median PCAT and PAAT densities varied between groups (mPCAT: P < 0.0001; PAAT: P = 0.0002). PCAT density was 7.01 ± standard error of the mean (SEM) 1.78 Hounsfield Unit (HU) higher in coronary segments from TAK + CAD patients than stable CAD patients (P = 0.0002), and 8.20 ± SEM 2.04 HU higher in TAK patients without CAD than controls (P = 0.0001). mPCAT density was correlated with Indian Takayasu Clinical Activity Score (r = 0.43, P = 0.001) and C-reactive protein (r = 0.41, P < 0.0001) and was higher in active vs. inactive TAK (P = 0.002). mPCAT density above −74 HU had 100% sensitivity and 95% specificity for differentiating active TAK from controls [area under the curve = 0.99 (95% confidence interval 0.97–1)]. The association of PCAT density and coronary arterial inflammation measured by 68Ga-DOTATATE positron emission tomography (PET) equated to an increase of 2.44 ± SEM 0.77 HU in PCAT density for each unit increase in 68Ga-DOTATATE maximum tissue-to-blood ratio (P = 0.002). These findings remained in multivariable sensitivity analyses adjusted for potential confounders.
PCAT and PAAT density are higher in TAK than atherosclerotic CAD or controls and are associated with clinical, biochemical, and PET markers of inflammation. Owing to excellent diagnostic accuracy, PCAT density could be useful as a clinical adjunct for assessing disease activity in TAK.
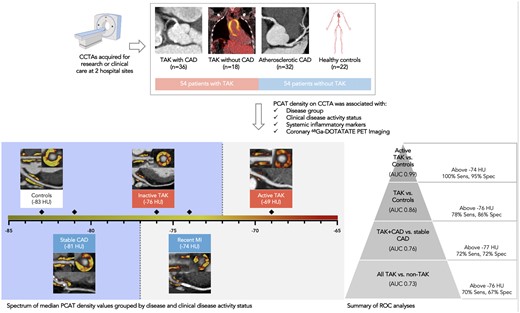
In this observational study, pericoronary adipose tissue (PCAT) density demonstrated good diagnostic accuracy for Takayasu arteritis ± coronary artery disease (CAD) and was associated with clinical markers of inflammation and disease activity. Median PCAT density values for all major epicardial coronary artery segments displayed.
Introduction
Takayasu arteritis (TAK) is a rare large-vessel vasculitis characterized by pan-arterial granulomatous inflammation that typically affects young women, leading to progressive injury of the aorta and its major branches.1 Coronary artery involvement in TAK is well-described, but clinically under-recognized. Ostial lesions, aneurysms, and fibrotic stenoses often go undetected until a late, burnt-out stage in the disease when therapies are less effective. Accelerated atherosclerosis is another common feature in TAK, related to chronic inflammation. Although treatment of coronary arteritis differs from atherosclerosis, conventional imaging modalities are unable to accurately distinguish vasculitic from atherosclerotic processes or quantify disease activity.
Pericoronary adipose tissue (PCAT) density on coronary computed tomography angiography (CCTA) is a promising imaging biomarker for assessing coronary arterial inflammation. Experimental data indicate that inflammation related to arterial injury manifests phenotypic changes in perivascular adipose tissue due to pro-inflammatory cytokine paracrine signalling and its effects on lipolysis and adipogenesis leading to altered adipocyte size and volume.2 These changes in adipocyte size and lipid/water content can be detected in the tissue surrounding the coronary vasculature by CCTA, using fat attenuation index (FAI),3 or another highly reproducible method for quantifying PCAT density derived from semi-automated plaque analysis software.4
In this study, PCAT and periaortic adipose tissue (PAAT) density were compared in patients with TAK ± coronary artery disease (CAD) to patients with atherosclerotic CAD, and matched control subjects. PCAT and PAAT density were also compared with clinical markers of disease activity, and, in a nested sub-analysis, with coronary artery inflammation measured by 68Ga-DOTA-(Tyr3)-octreotate (DOTATATE) positron emission tomography (PET) imaging. 68Ga-DOTATATE is a clinical PET tracer used in oncology imaging, which binds somatostatin receptors. As somatostatin receptor-2 is expressed by activated macrophages, 68Ga-DOTATATE PET has been re-purposed as marker of vascular inflammation in the context of research. Unlike 18F-fluorodeoxyglucose (FDG), 68Ga-DOTATATE exhibits low background myocardial activity allowing clear coronary signal interpretation.5 Ultimately, as periarterial adipose tissue density is associated with inflammation in atherosclerosis, we sought to determine whether PCAT or PAAT density could also be a useful marker of inflammatory disease activity in TAK.
Methods
Study design and participants
In this observational study, CCTAs were identified from consenting participants who underwent imaging as part of prospective research studies [PITA (PET Imaging of giant-cell and Takayasu Arteritis), NCT04071691; RIPPLE (Residual Inflammation and Plaque Progression Long-term Evaluation), NCT04073810; VISION (Vascular Inflammation imaging using Somatostatin receptor positron emissION tomography), NCT02021188] or clinical care at Addenbrooke’s Hospital, Cambridge, UK and Hammersmith Hospital, London, UK from 2014 to 2020. Data from all participants in these multi-modality imaging studies who had contemporaneous high-quality CCTAs performed on a dedicated computed tomography (CT) scanner were included in the present analysis. Participants were included with, (i) TAK and CAD; (ii) TAK and no CAD; (iii) atherosclerotic CAD; and (iv) no TAK or CAD. CAD status was defined by CCTA.
Consecutive control subjects were age-matched with the TAK patients, and also matched for body-mass index and CT tube voltage (kV) with all groups. Similar numbers of male and female control subjects were selected. Due to inherent differences in demographic trends between TAK and atherosclerotic CAD, these groups were not matched using propensity scoring or another method as this would compromise the generalizability of the findings by creating samples no longer representative of the true populations. Participants with chronic renal failure or other contra-indications to CCTA were excluded. Full inclusion and exclusion criteria of the original clinical studies are in the Supplementary material online. Research was conducted with the approval of the local research ethics committee (REC 19/EE/0043; 14/EE/0019), in accordance with the Declaration of Helsinki.
Clinical data
Baseline clinical data were recorded. Independent of this study, TAK patients were graded by an experienced vascular rheumatologist according to the Indian Takayasu Clinical Activity Score (ITAS-CRP). Cardiovascular risk was scored using the U-prevent algorithm (https://u-prevent.com/calculators).
Image acquisition and reconstruction
CCTA imaging
CCTA was performed using a dedicated 64-slice (SOMATOM Definition, Siemens Healthcare) or 2 × 64-slice (Definition Flash, Siemens Healthcare) cardiac scanner from the same vendor, following a standard clinical protocol consistent across both hospitals. Sublingual glyceryl trinitrate (400 µg) ±intravenous metoprolol (5–20 mg) was given provided there was no contraindication. Intravenous contrast (NIOPAM 350, Bracco) was administered with a 0.9% saline flush. Prospective or retrospective CCTA images were acquired during end-inspiration with the patients’ arms raised, tube current (smart mA) and voltage (80–140 kV) adjusted for body size and reconstructed at 0.75-mm slice thickness (kernel B26f).
PET imaging
68Ga-DOTATATE imaging was performed in patients with TAK and patients with recent myocardial infarction (MI) using a PET/magnetic resonance scanner (SIGNA, GE Healthcare), with a target injected tracer activity of 250 MBq and 30-min cardiac image acquisition after a 50-min uptake period. Images were reconstructed from list mode data in eight cardiac bins with time-of-flight iterative reconstruction that included point-spread function modelling, using a two-point DIXON magnetic resonance sequence for attenuation correction.
Patients with atherosclerotic CAD underwent 68Ga-DOTATATE imaging on a PET/CT scanner (Discovery 690, GE Healthcare, USA) as previously described.5 PET/CT images were reconstructed from list mode data in four cardiac bins, using time-of-flight ordered-subset expectation maximization (256 × 256 matrix, 3 iterations, 24 subsets, 2.0-mm Gaussian smoothing) with point-spread function modelling and standard data corrections.
Image analysis
CCTA analysis
Semi-automated vessel segmentation, quantitative plaque analysis, and measurement of PCAT density were performed around epicardial coronary artery segments with diameter ≥2 mm using a validated and reproducible method (Autoplaque version 2.5, Cedars Sinai Medical Centre).4 Poor-quality CCTAs and segments with stent-related artefacts were excluded. PCAT density was determined automatically as the mean attenuation in Hounsfield Unit (HU) of voxels with tissue ranging from −190 up to −30 HU within a predefined volume of interest located in a 3-mm radius of the outer coronary wall. Median PCAT density in each patient was calculated for all coronary segments (mPCATtotal), in proximal segments (mPCATprox), and in proximal right coronary artery segments (mPCATpRCA). PAAT density was measured in a 3 cm segment of the proximal ascending aorta contiguous with the sinotubular junction.
PET analysis
Coronary 68Ga-DOTATATE PET was analysed using cardiac motion-corrected and co-registered PET and CCTA datasets following an established technique (FusionQuant version 1.19.4.4, Cedars Sinai Medical Centre),6 to derive maximum tissue-to-blood ratio (TBRmax) corrected for average blood pool activity in the superior vena cava. Distal right coronary artery segments with nearby high liver uptake were excluded from the analysis.
Statistical analysis
PCAT and PAAT density expressed as median [interquartile range (IQR)] were compared by group using the Kruskal–Wallis test, and with clinical data using Spearman’s rank correlation. Receiver operating characteristic (ROC) analyses were constructed to assess the diagnostic accuracy of PCAT and PAAT density for disease groups and disease activity status. Univariable linear mixed-effects models were employed to account for a hierarchical data structure when comparing observations from multiple coronary segments from the same patient. Patient effects were incorporated as random intercepts in the models. The fixed effects were reported as effect size (also known as slope estimate) ± standard error of the mean (SEM). Potential confounding factors associated with PCAT density (P < 0.1) in univariable linear mixed-effects models were included in multivariable sensitivity analyses to assess the robustness of the main study findings. Normality of the residuals after regression was assessed using the quantile-quantile plot. A two-sided P-value of <0.05 was considered significant. Statistical analyses were performed using R statistical analysis program (Version 4.0.2) and Prism (Version 9.0.2, GraphPad).
Results
Patients
One hundred and eight subjects (54 TAK and 54 non-TAK) were included (TAK + CAD, n = 36; TAK, n = 18; atherosclerotic CAD, n = 32; controls, n = 22; Graphical abstract; Supplementary material online, Figure S1). TAK and control groups were well-matched for age (median 51 vs. 52 years), body mass index (median 27 vs. 27 kg/m2), and kV (median 120 vs. 120; Table 1). TAK patients were predominantly female and younger than atherosclerotic CAD patients, with greater high-sensitivity C-reactive protein concentrations and lower 10-year %cardiovascular risk. In the TAK groups, 28% (15/54) had clinically active disease (ITAS-CRP score ≥ 2), 63% (34/54) had aortic thickening, 39% (21/54) had ostial coronary lesions and one patient had coronary aneurysms (Figure 1). Mean ITAS-CRP score was 1 ± SD 2 in TAK patients, with no difference between TAK groups. There was a median 37 (IQR 20–120) days between blood tests and CCTA. One TAK patient, 14 CAD patients and no control subjects had a recent MI (≤3 months of CCTA).
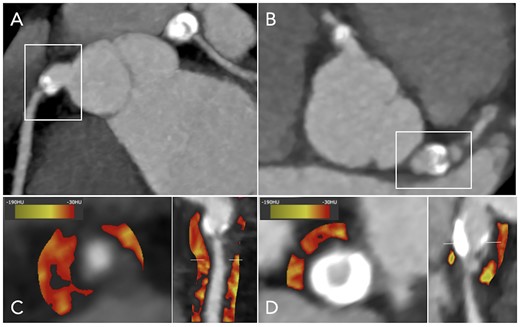
PCAT density in a patient with TAK and bilateral coronary aneurysms. Coronary computed tomography angiography showing calcified aneurysms of the (A) right coronary artery and the (B) left main coronary artery in a 28-year-old woman with TAK, with significant coronary stenoses immediately distal to the aneurysms. PCAT density displayed using colour heatmap is increased around these vessels, as shown in (C and D) cross-section and curved multi-planar views. PCAT, pericoronary adipose tissue; TAK, Takayasu arteritis
Baseline clinical factors
| TAK with CAD | TAK without CAD | Atherosclerotic CAD | Controls | |
|---|---|---|---|---|
| Number of subjects | 36 | 18 | 32 | 22 |
| Age, years, median (IQR) | 53 (43–59) | 42 (33–55) | 65 (59–73) | 52 (42–62) |
| Female, n (%) | 32 (89) | 16 (89) | 6 (19) | 12 (55) |
| Median body mass index, kg/m2, median (IQR) | 27 (23–30) | 28 (23–33) | 29 (26–31) | 27 (23–32) |
| Cardiovascular risk factors, n (%) | ||||
| Hypertension | 20 (56) | 6 (33) | 19 (58) | 8 (36) |
| Hypercholesterolaemia | 25 (70.37) | 1 (6) | 24 (75) | 6 (27) |
| Noninsulin dependent diabetes | 5 (14) | 2 (11) | 5 (16) | 1 (5) |
| Smoking habit (ex or current) | 24 (67) | 10 (56) | 22 (69) | 6 (27) |
| Other medical history, n (%) | ||||
| Stable angina | 4 (11) | 0 | 12 (38) | 0 |
| Myocardial infarction | 3 (8) | 0 | 16 (50) | 0 |
| Percutaneous coronary intervention | 3 (8) | 0 | 16 (50) | 0 |
| Coronary artery bypass grafting surgery | 5 (14) | 0 | 0 | 0 |
| Transient ischaemic attack or ischaemic stroke | 3 (8) | 0 | 4 (13) | 0 |
| Peripheral vascular disease | 0 | 1 (6) | 2 (6) | 0 |
| Current medications, n (%) | ||||
| Statin | 19 (53) | 5 (28) | 28 (87.50) | 0 |
| Anti-hypertensive | 9 (25) | 7 (39) | 27 (84.38) | 0 |
| Corticosteroid | 25 (69) | 15 (8) | 0 | 0 |
| Methotrexate | 4 (11) | 2 (11) | 0 | 0 |
| Azathioprine | 3 (1) | 0 | 0 | 0 |
| Cyclophosphamide | 1 (23) | 0 | 0 | 0 |
| Anti-TNFα | 2 (6) | 0 | 0 | 0 |
| Tocilizumab | 1 (0.3) | 0 | 0 | 0 |
| Median lipid profile, mmol/L (IQR) | ||||
| Total cholesterol | 5.20 (4.00–6.00) | 5.60 (5.10–5.90) | 3.90 (3.25–5.03) | 4.70 (4.40–6.15) |
| Triglycerides | 1.56 (1.10–2.33) | 1.11 (1.07–1.73) | 1.59 (0.98–1.83) | 1.00 (0.86–1.72) |
| HDL cholesterol | 1.39 (1.23–1.62) | 1.60 (1.25–1.81) | 0.98 (0.89–1.18) | 1.56 (1.41–1.83) |
| LDL cholesterol | 2.77 (2.12–3.72) | 3.35 (2.69–3.50) | 2.18 (1.61–3.14) | 2.75 (2.23–3.70) |
| Median high-sensitivity C-reactive protein, mg/L (IQR) | 5.05 (2.85–12.18) | 3.90 (2.10–20.20) | 2.80 (1.50–5.49) | — |
| Median 10-year cardiovascular risk score, % (IQR) | 13 (10–18) | 2 (2–5) | 22 (15–33) | 2.5 (1–7) |
| Median kV (IQR) | 120 (120–120) | 120 (120–120) | 120 (100–140) | 120 (80–120) |
PCAT and PAAT density by group
A total of 1016 coronary segments [median 10 (IQR 9–10) segments per patient] and 108 aortic segments were analysed. PCAT density varied across study groups, with higher mPCATtotal, mPCATprox and PCATpRCA (P < 0.0001 for all) in TAK than atherosclerotic CAD or controls (Figure 2; Supplementary material online, Table S1). mPCATtotal was highly correlated with mPCATprox [r = 0.91 (95% confidence interval, CI 0.86–0.94), P < 0.0001] and mPCATpRCA [r = 0.81 (95% CI 0.73–0.87), P < 0.0001]. PAAT was also highly correlated with PCAT [mPCATtotal: r = 0.66 (95% CI 0.54–0.76); mPCATprox: P = 0.60 (95% CI 0.46–0.71); pPCATpRCA: r = 0.52 (95% CI 0.36–0.65); P < 0.0001 for all] and was increased more in TAK than CAD and controls (P = 0.0002).
![Distribution of PCAT density by disease group. Violin plots showing the distribution [dashed lines: median (interquartile range)] of PCAT density across the four study groups for all coronary segments (mPCATtotal), proximal segments (mPCATprox) proximal right coronary artery segments (PCATpRCA), and PAAT density. CAD, coronary artery disease; HU, Hounsfield Unit; PAAT, periaortic adipose tissue; PCAT, pericoronary adipose tissue; TAK, Takayasu arteritis; ****P < 0.0001; ***P < 0.001.](https://oup.silverchair-cdn.com/oup/backfile/Content_public/Journal/ehjopen/1/2/10.1093_ehjopen_oeab019/4/m_oeab019f2.jpeg?Expires=1716452231&Signature=08nPnLmeUafrIvCt6ZJzIRRWY1oz2mMAlK7t7X8jpTLkEOCTgcFPvONIJFFsbuTAZp3pugECHQZs23ScqC0cJcfUon6DA62lKbfr~fGVcVBKPihjfLFWK~w5GZbF1OYtjH9iXGZhM8D42hT-QRgFsGRshIDJ73KgxIfmRmAlD5I0ZV8cmt9qJTGb-XOA9xiJEnElgNztcJjj479TsEfq1v4YgA57na2PvTVFkNVCnCfvNy4qMT2CsHb7ezPTidZ~RHfaDjA-zgL5frDnwDcv2oN8Rg5GERRsAsVtnCFu3hhF-egvsWM735e9UNbSuMG3FrN2JD~OY15mTYJu9BP-Aw__&Key-Pair-Id=APKAIE5G5CRDK6RD3PGA)
Distribution of PCAT density by disease group. Violin plots showing the distribution [dashed lines: median (interquartile range)] of PCAT density across the four study groups for all coronary segments (mPCATtotal), proximal segments (mPCATprox) proximal right coronary artery segments (PCATpRCA), and PAAT density. CAD, coronary artery disease; HU, Hounsfield Unit; PAAT, periaortic adipose tissue; PCAT, pericoronary adipose tissue; TAK, Takayasu arteritis; ****P < 0.0001; ***P < 0.001.
There was no difference in PCAT density between TAK and TAK + CAD groups. For patients with stable atherosclerotic CAD who did not have a recent MI, PCAT density was higher than controls when assessed using mPCATprox [−74.47 HU (−79.80, −69.70) vs. −80.65 (−86.02, −74.35), P = 0.01]; however, there was only a trend towards significance with PCATpRCA (P = 0.08) and no difference with mPCATtotal.
When comparing individual coronary segments, increased PCAT density was confirmed in TAK + CAD compared to stable atherosclerotic CAD (effect size 7.01 ± SEM 1.78 HU, P = 0.0002) and TAK without CAD compared to controls (effect size 8.20 ± SEM 2.04 HU, P = 0.0001).
Distrubution of PCAT density within the coronary tree
When examining the distribution of PCAT density around individual coronary segments, higher values were observed around proximal, compared to mid or distal vessels in all groups (effect size TAK + CAD: 9.18 ± SEM 0.90 HU, P < 0.0001; TAK: 12.46 ± SEM 1.35 HU, P < 0.0001; CAD: 10.02 ± SEM 1.21 HU, P < 0.0001; control: 4.72 ± SEM 1.11 HU, P < 0.0001). Although PCAT density appeared slightly less varied along the coronary tree in TAK than CAD when visualized graphically (Supplementary material online, Figure S2), there was no statistical difference in variance.
Diagnostic accuracy of PCAT and PAAT for TAK
All mPCAT metrics (mPCATtotal, mPCATprox, mPCATpRCA) and PAAT had good accuracy for differentiating patients with TAK + CAD from stable atherosclerotic CAD, and TAK without CAD from controls on ROC analysis (Figure 3; Supplementary material online, Table S2). mPCATtotal density above −77 HU demonstrated 72% sensitivity and 72% specificity for differentiating patients with TAK + CAD compared to stable atherosclerotic CAD [area under the curve (AUC) = 0.76 (95% CI 0.60–0.88)]. mPCATtotal density above −76 HU demonstrated 78% sensitivity and 86% specificity for TAK without CAD, compared to controls [AUC = 0.86 (95% CI 0.72–0.97)]. For all subjects, mPCATtotal density above −76 HU demonstrated 70% sensitivity and 67% specificity for TAK vs. non-TAK [AUC = 0.73 (95% CI 0.63–0.82)].
![Diagnostic accuracy of PCAT density in TAK. Receiver operating characteristic curves showing the diagnostic accuracy of PCAT density for differentiating (A) patients with TAK and CAD from stable atherosclerotic CAD, and patients with TAK and no CAD from control subjects. (B) Violin plots [dashed lines: median (interquartile range)] showing the distribution of PCAT density in patients with active versus inactive TAK, and recent MI vs. stable atherosclerotic CAD. CAD, coronary artery disease; HU, Hounsfield Unit; MI, myocardial infarction; PCAT, pericoronary adipose tissue; TAK, Takayasu arteritis; ***P < 0.001; **P < 0.01.](https://oup.silverchair-cdn.com/oup/backfile/Content_public/Journal/ehjopen/1/2/10.1093_ehjopen_oeab019/4/m_oeab019f3.jpeg?Expires=1716452231&Signature=utR3V08a~9cRYidSuAn1PdTO22LRpYuOgAI5FdgGZcGC7tZETmi9WfNoxTI1ByaE1hgwzitnUMel62bdzUxcG1qEOYABU5UKISVKdgSs0YIshnetu5nH7XwqiD2gl~1oC6s1FbiS0Yg7YXrSRuqg-ADLMnSMzRat53aGmvHqc-u-JUR0IWif0nxoXXXZsyWWTQn3sextj2evIKvbIJGQRepZ-odlYdt0SxUdqDsxZXF~VKb3mJFmPsTp0XBpSzL~L7HCwCU4k5hYi6paDEDN~Fcm5zO210Oj2lvOpD5UOeTLdJ~3XJpdMO2WI13R-1QW5z68Hch7hM2YS6Ip0LzUKw__&Key-Pair-Id=APKAIE5G5CRDK6RD3PGA)
Diagnostic accuracy of PCAT density in TAK. Receiver operating characteristic curves showing the diagnostic accuracy of PCAT density for differentiating (A) patients with TAK and CAD from stable atherosclerotic CAD, and patients with TAK and no CAD from control subjects. (B) Violin plots [dashed lines: median (interquartile range)] showing the distribution of PCAT density in patients with active versus inactive TAK, and recent MI vs. stable atherosclerotic CAD. CAD, coronary artery disease; HU, Hounsfield Unit; MI, myocardial infarction; PCAT, pericoronary adipose tissue; TAK, Takayasu arteritis; ***P < 0.001; **P < 0.01.
Clinical markers of disease activity
mPCATtotal demonstrated the strongest correlations with clinical markers of disease severity, compared to mPCATprox, mPCATpRCA and PAAT (Figure 4; Supplementary material online, Table S3) and was correlated with ITAS-CRP score (r = 0.43, P = 0.001) in TAK patients, and C-reactive protein concentration (r = 0.41, P < 0.0001) and erythrocyte sedimentation rate (r = 0.41, P = 0.002) in all patients. PAAT had the strongest associations with total white cell count (r = 0.25, P = 0.01) and neutrophil count (r = 0.29, P = 0.003). There were no correlations identified between PCAT or PAAT density and lipid profile, body mass index, 10-year %cardiovascular risk, or %plaque burden.
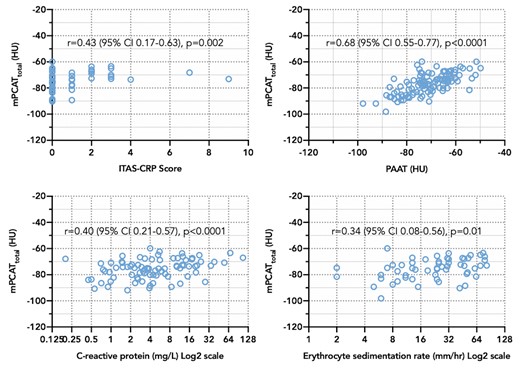
PCAT density vs. PAAT density and clinical markers of disease activity. Scatter plots showing Spearman’s correlations between median PCAT density and PAAT density, and clinical markers of disease activity. HU, Hounsfield Unit; PAAT, periaortic adipose tissue; PCAT, pericoronary adipose tissue; TAK, Takayasu arteritis.
Disease activity status
PCAT density was higher in active than inactive TAK (mPCATtotal: P = 0.0002; mPCATprox: P = 0.004; mPCATpRCA: P = 0.0002; PAAT: P = ns; Figure 3; Supplementary material online, Table S4). PCAT density was also higher in CAD patients with recent MI than stable disease (mPCATtotal: P = 0.008; mPCATprox: P = 0.002; mPCATpRCA: P = ns; PAAT: P = ns). All mPCAT metrics had good accuracy for differentiating active from inactive TAK and recent MI from stable CAD (Supplementary material online, Table S2). mPCATtotal density above −74 HU had 100% sensitivity and 95% specificity for active TAK compared to controls [AUC = 0.99 (95% CI 0.97–1)].
The univariable linear mixed-effects model confirmed higher PCAT density in coronary segments from active TAK patients than inactive (effect size 5.78 ± SEM 1.92 HU, P = 0.004), and from CAD patients with recent MI than stable disease (effect size 6.83 ± SEM 2.02 HU, P = 0.002). The association between PCAT density and TAK disease activity status remained in patients with aortic thickening (effect size 6.37 ± SEM 2.32 HU, P = 0.01) and ostial involvement (effect size 8.20 ± SEM 2.54 HU, P = 0.004).
In the only TAK patient with recent MI, PCAT density surrounding the culprit coronary segment on CCTA performed within one day of symptoms (prior to stenting), was increased (Figure 5). However, in the 13 CAD patients with recent MI [MI to CCTA interval: median 19 (IQR 15–29) days; 12 of 13 culprit vessels stented], PCAT density was similar surrounding culprit and non-culprit segments.
![PCAT density and 68Ga-DOTATATE PET/MRI in a patient with TAK and MI. Images from a 63-year-old woman with Takayasu arteritis and coronary artery disease. At initial presentation with stable angina (A, C) coronary computed tomography angiography showed aortic thickening (asterisks) and a proximal LAD artery stenosis (arrow), which was managed medically. (B) 3D reconstruction of the proximal LAD artery showing the outer vessel wall (brown), lumen (blue), lipid (orange), and calcified (yellow) plaque components. (D) PCAT density displayed by colour heatmap around the proximal LAD. Four years later, the same patient presented with a non-ST-segment elevation myocardial infarction [high-sensitivity Troponin I 329 ng/L (normal range <41)]. (E) 68Ga-DOTATATE PET/MRI showed focal tracer uptake relating to the LAD lesion (arrow), subsequently identified by (F) angiography as the culprit artery (arrow). (H) Average PCAT density measured around the culprit LAD lesion prior to invasive angiography and percutaneous stenting was increased. Atherosclerotic coronary plaque rupture with thrombosis (asterisk) was also confirmed by (G) intravascular optical coherence tomography imaging before coronary stenting. LAD, left anterior descending; MRI, magnetic resonance imaging; PCAT, pericoronary adipose tissue; PET, positron emission tomography.](https://oup.silverchair-cdn.com/oup/backfile/Content_public/Journal/ehjopen/1/2/10.1093_ehjopen_oeab019/4/m_oeab019f5.jpeg?Expires=1716452231&Signature=DCIp19tt~D3nVbaRbOEDRnPPndzZgtCGzRPRxybOd6G14eeW7P3u6dUa~axzvdPIt1elDNmEHz9uL7M19F9cbO4fJ8h2GM7hEzShCOl5DN6xfQAMpGu4am52pfLzhuRxXErXYhHEPUJu8nfFALhcex2MbmF3UF5N0lMrGEgLiPRnKMu6Gq9CBzHbDos6ynt8O8RD1f-sgxHdQSG-AfIlbyXGKK9rx8tY33Uy5aevhhUCAJUsqucmEPF3i6BF8b0XwWaLYRs9euCbLrOVW5E32oilg6UQ6oeIHX5lVQ9Qa2pVAF2W4UWfn2sCJxtBC2QWiGPXggY3Zs9egJz5w4pntg__&Key-Pair-Id=APKAIE5G5CRDK6RD3PGA)
PCAT density and 68Ga-DOTATATE PET/MRI in a patient with TAK and MI. Images from a 63-year-old woman with Takayasu arteritis and coronary artery disease. At initial presentation with stable angina (A, C) coronary computed tomography angiography showed aortic thickening (asterisks) and a proximal LAD artery stenosis (arrow), which was managed medically. (B) 3D reconstruction of the proximal LAD artery showing the outer vessel wall (brown), lumen (blue), lipid (orange), and calcified (yellow) plaque components. (D) PCAT density displayed by colour heatmap around the proximal LAD. Four years later, the same patient presented with a non-ST-segment elevation myocardial infarction [high-sensitivity Troponin I 329 ng/L (normal range <41)]. (E) 68Ga-DOTATATE PET/MRI showed focal tracer uptake relating to the LAD lesion (arrow), subsequently identified by (F) angiography as the culprit artery (arrow). (H) Average PCAT density measured around the culprit LAD lesion prior to invasive angiography and percutaneous stenting was increased. Atherosclerotic coronary plaque rupture with thrombosis (asterisk) was also confirmed by (G) intravascular optical coherence tomography imaging before coronary stenting. LAD, left anterior descending; MRI, magnetic resonance imaging; PCAT, pericoronary adipose tissue; PET, positron emission tomography.
PET imaging of arterial inflammation
Coronary 68Ga-DOTATATE PET scans were analysed in three TAK patients and 29 CAD patients [CCTA to PET scan interval: median 8 (IQR 0–31) days]. PCAT density was moderately correlated with 68Ga-DOTATATE TBRmax in coronary segments from CAD patients (Figure 6). In a pooled analysis of all 32 patients with 68Ga-DOTATATE imaging performed using a linear mixed-effect model, there was a positive association between PCAT density and coronary 68Ga-DOTATATE uptake, which equated to an increase of 2.44 ± SEM 0.77 HU for each unit increase in TBRmax (P = 0.002). A similar relationship between PCAT density and 68Ga-DOTATATE uptake occurred in the CAD group alone (effect size 2.35 ± SEM 0.77 HU, P = 0.003). The relationship between 68Ga-DOTATATE TBRmax and PCAT density was quantitatively similar regardless of whether PET/CT or PET/MR was used to acquire the data.
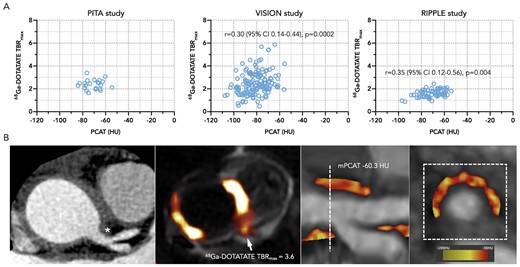
PCAT density compared to coronary 68Ga-DOTATATE PET. (A) Scatter plots showing Spearman’s correlation for PCAT density and 68Ga-DOTATATE uptake in coronary segments from patients with TAK and CAD (n = 3) from the PITA study and atherosclerotic CAD (n = 28) from the VISION and RIPPLE studies. (B) Representative coronary computed tomography angiography image from a patient with active TAK and arterial thickening adjacent to the left main coronary ostium (asterisks) with no luminal impingement, demonstrating increased 68Ga-DOTATATE uptake on PET/MRI (arrow), and corresponding increased PCAT density. HU, Hounsfield Unit; MRI, magnetic resonance imaging; PCAT, pericoronary adipose tissue; PET, positron emission tomography; TAK, Takayasu arteritis; TBRmax, maximum tissue-to-blood ratio.
Multivariable regression analyses
Of the potential confounding factors tested, age, anatomical location of the coronary segment, current steroid use, recent MI, and kV demonstrated P < 0.1 in the univariable linear mixed-effects analysis (full list of variables in Supplementary material online, Table S5). These factors were included in the multivariable analyses to assess the robustness of the main study findings. Of note, gender, body mass index and statin use were not found to be factors. After adjusting for confounders, higher PCAT density was confirmed in TAK + CAD vs. stable CAD (effect size 6.53 ± SEM 2.13 HU, P = 0.003) and TAK vs. controls (effect size 7.88 ± SEM 2.39 HU, P = 0.001). The associations between PCAT density and active TAK (effect size 4.16 ± SEM 1.90 HU, P = 0.03) and 68Ga-DOTATATE (effect size 2.56 ± SEM 0.71 HU, P = 0.0004) also remained.
Discussion
We found that PCAT and PAAT density on CCTA are higher in patients with TAK than in atherosclerotic CAD or control subjects, independent of potential patient-level confounding factors. PCAT density was more closely linked with markers of clinical disease activity status in TAK than PAAT and was also associated with coronary inflammation measured by 68Ga-DOTATATE PET. This is the first study to investigate PCAT or PAAT density in TAK patients, or to compare PCAT density with arterial 68Ga-DOTATATE uptake in any disease group.
Use of PCAT density for risk-prediction in CAD
Our findings are supportive of previous landmark studies that have established PCAT density as a promising imaging biomarker for the assessment of coronary arterial inflammation in atherosclerosis. These studies have demonstrated that pericoronary FAI provides incremental improvement for major adverse cardiac event prediction above clinical risk factors and conventional CCTA measures,7 as well as high-risk plaque CT feaures,8 and that specific radiomic features indicative of adverse PCAT remodelling are also useful.9 Other studies have shown an association with PCAT density and the progression of CCTA-quantified plaque burden,10 and an ability to differentiate culprit from non-culprit lesions.11
Indeed, PCAT density could be an important adjunct test for risk-stratification in patients undergoing CCTA for investigation of CAD in routine clinical care. The prognostic benefit of measuring PCAT density could be even greater in patients with systemic inflammatory conditions that are known to associate with accelerated coronary atherosclerosis, such as psoriasis, systemic lupus erythematosus, and rheumatoid arthritis. One study found that pericoronary FAI was increased in patients with moderate-to-severe treatment-naïve psoriasis, and modifiable by biologic therapy.12
Emerging role of CCTA in TAK
CCTA is increasingly used as a first-line investigation for coronary involvement in TAK; however, published literature on this topic is limited. Prior studies have reported CAD in 44% to 53% of TAK patients undergoing CCTA, including atherosclerotic-type lesions, ostial stenoses and aneurysms.13,14 Whether PCAT density could help identify TAK patients with sub-clinical coronary involvement before the development of these complications is unknown. As a first step towards understanding the relationship between coronary arterial inflammation and PCAT density in TAK, we compared PCAT density in patients with TAK (with and without CAD) to a typical population of patients with atherosclerotic CAD, as well as matched control subjects with no TAK or CAD. We also investigated PAAT density in these patients, due to the nature of the disease as a large vessel vasculitis.
Increased PCAT and PAAT density in TAK
We found that PCAT density was 7 HU greater in coronary segments from patients with TAK and CAD than stable atherosclerotic CAD and 8 HU greater in TAK patients without CAD than control subjects. PAAT density was similarly varied between groups and was highly correlated with PCAT density (r = 0.67, P < 0.0001). As there is no established method for assessing PCAT density in patients with TAK, we explored different metrics (mPCATtotal, mPCATprox, mPCATpRCA) and found the results to be largely consistent. By analysing all epicardial coronary arteries with diameter ≥2 mm, we were able to better understand how arteritis affects the distribution of PCAT density along the whole coronary tree and found these values in TAK and CAD to be similarly distributed from proximal to distal vessels.
Diagnostic utility in TAK
An ability to differentiate vasculitic from atherosclerotic coronary lesions in patients with TAK by non-invasive imaging is an unmet clinical need. In this study, PCAT density had good diagnostic accuracy for differentiating TAK patients with CAD from stable atherosclerotic CAD (AUC 0.76) and TAK patients without CAD from control subjects (AUC 0.86). Thus, in certain clinical scenarios increased PCAT density could be a sensitive and specific marker of coronary arteritis, as opposed to stable atherosclerosis, in TAK patients with coronary lesions.
A novel marker of disease activity in TAK?
PCAT density was increased more in TAK patients with active than inactive disease, and was correlated with ITAS-CRP score, as well as systemic markers of inflammation indicating that this novel imaging biomarker could potentially provide clinically relevant information about the inflammatory status of patients with TAK. Moreover, PCAT density above −74 HU demonstrated an impressive 100% sensitivity and 95% specificity for differentiating patients with active TAK from control subjects (AUC 0.99). The associations of PCAT density with clinical disease activity status in TAK remained after adjustment for potential patient-level confounding factors and was also independent of the presence or absence of aortic thickening and ostial lesions. Thus, PCAT density on CCTA could potentially offer a means of detecting persistent arteritis despite treatment, which may not be readily apparent by conventional imaging or blood tests.
While PAAT density was not higher in patients with active versus inactive TAK, the majority of TAK patients were receiving long-term immunosuppression for disease in remission at the time of CCTA, and most patients with active disease were treated with corticosteroids. PAAT was also only measured in the proximal ascending aorta, and not all active TAK patients would be expected to have vasculitis involving the ascending aorta.
Consistency of CAD findings with other studies
Although mPCATtotal demonstrated the best diagnostic accuracy for TAK, previous studies performed in CAD patients have measured PCAT density in only the proximal 40 mm of the major coronary arteries, or the proximal right coronary artery. Overall, our findings in CAD patients are consistent with previous studies when comparing similar methodology.
For example, mPCATprox in CAD patients without recent MI was −75 HU, which is similar to the proximal pericoronary FAI values reported in the two cohorts of the CRISP-CT study (−75 HU and −77 HU),7 as well as another study that observed mean PCAT density surrounding high-grade coronary stenoses of −76 HU.11 Although there was no difference between PCAT density in patients with stable CAD who did not have a recent MI compared with control subjects in our study using mPCATtotal, there was a difference using mPCATprox.
Further corroboration of our findings in CAD patients is provided by a study that showed higher PCAT density in 60 patients who underwent CCTA within 48 h of an acute MI, than stable CAD patients and matched controls, as well as a lack of association with plaque burden; both of these observations were replicated in our study.15 Moreover, the repeatability of the same validated method employed in our study was demonstrated in a posthoc analysis of 50 consecutive patients who underwent CCTA for investigation of suspected CAD in SCOT-HEART, which showed intra- and interobserver interclass-coefficients of 0.999 and 0.998, with mean absolute differences for these measurements of 0.05 and 0.13, respectively.4
Associations with PET imaging
18F-FDG is often included in the diagnostic work-up of patients with TAK, and has been extensively studied in the context of vasculitis and atherosclerosis.16 However, arterial 18F-FDG uptake is also observed in a high proportion of patients with clinically inactive TAK, where it may represent vessel wall remodelling, atherosclerosis, or another process besides inflammation.17 Moreover, coronary 18F-FDG imaging is precluded in up to 50% of patients in research studies despite dietary modification, because of avid myocardial muscle uptake.16 68Ga-DOTATATE is an alternative PET tracer that may provide a more accurate readout of arterial inflammation than 18F-FDG, with lower physiological myocardial signal.5 Initial data in large vessel vasculitis are encouraging.18 However, an ability to measure coronary arterial, or indeed periaortic, inflammation from CCTA alone, without the use of PET, would be a great advantage in this disease group.
Very few studies have compared PCAT density with PET imaging. In the initial publication that validated FAI as a marker of coronary arterial inflammation, FAI was correlated with 18F-FDG uptake in subcutaneous adipose tissue, but this finding was not apparent in epicardial adipose tissue surrounding the right coronary artery.3 It is possible that myocardial signal contamination was a confounding factor in that study. In another report, pericoronary 18F-FDG uptake on PET imaging was found to be related to degree of angiographic coronary artery stenosis in the adjacent artery.19 PCAT density has also been shown to co-localize with areas of focal microcalcification in high-risk atherosclerotic plaques detected by 18F-sodium fluoride PET.20 In our study, we observed a moderate association between PCAT density and coronary artery inflammation detected by 68Ga-DOTATATE PET.
Study limitations
As an initial observational study aimed to investigate the use of a novel imaging approach in a rare disease group, we acknowledge several factors that could limit the generalizability of our findings to wider patient populations. These limitations include demographical differences between TAK and atherosclerotic CAD patient groups, and the possibility of additional confounding factors not accounted for by the matched control group and statistical models. However, despite these differences, the fact that younger, predominately female TAK patients without traditional cardiovascular risk factors had higher PCAT density than a typical older patient with established atherosclerotic disease remains an important finding. In the PET imaging sub-analysis, although only 3 of the 32 patients who underwent 68Ga-DOTATATE imaging had TAK, this was a completely novel exploratory endpoint aimed to compare PCAT density with PET imaging across a range of cardiovascular disease patients; and was not intended to inform specifically about its association in TAK. The impact of technical limitations of coronary PET imaging, including the physical properties of the radioligand, uncorrected motion artefacts and partial volume errors also cannot be discounted.
Conclusion
Here we show that PCAT and PAAT density on CCTA are higher in TAK patients than atherosclerotic CAD or control subjects and are associated with clinical, biochemical, and PET imaging markers of inflammation. As a readily accessible measurement on CCTA, with impressive diagnostic accuracy for active disease, PCAT density could be a useful clinical adjunct for patients with TAK as well as atherosclerosis. This approach could offer a means to detect early coronary involvement in TAK, before structural arterial injury manifests; to differentiate active coronary arteritis from stable atherosclerosis; or to identify persistent arteritis despite conventional therapy. Future studies are needed to investigate PCAT and PAAT density as novel imaging biomarkers for risk-stratification of patients with TAK and/or CAD who may benefit from existing or newly emerging anti-inflammatory therapies.
Lead author biography

Jason M. Tarkin is a Wellcome Clinical Research Career Development Fellow and Honorary Consultant Cardiologist at the University of Cambridge, with a cardiac imaging sub-specialty. He is an elected member of the British Society of Cardiovascular Imaging Committee. He was awarded summa cum laude with honors in Biology from the University of New Hampshire in 2003, Distinction in Medicine from St George’s, University of London in 2008, and a PhD from the University of Cambridge in 2016. He was the recipient of the 2016 AHA Melvin Judkin’s Young Investigator Award and the 2018 ACC William W. Parmley Young Author Achievement Award.
Supplementary material
Supplementary material is available at European Heart Journal Open online.
Funding
J.M.T. is supported by the Wellcome Trust (211100/Z/18/Z; 104492/Z/14/Z), the British Heart Foundation (BHF) and the NIHR Imperial Biomedical Research Centre (BRC). C.W. is supported by the NIHR. R.M. is supported by the NIHR Cambridge BRC. A.C., M.R.D., D.N., and M.R.B. are supported by the BHF. J.E.P. is supported by a United Kingdom Research and Innovation Fellowship at Health Data Research UK (MR/S004068/2). D.D. is supported by NIH/NHLBI grants (R01HL148787). P.S. is supported by NIH/NHLBI (R01HL135557). Z.A.F. is supported by NIH/NHLBI (R01HL135878). J.C.M. acknowledges support from the NIHR Imperial BRC. J.H.F.R. is part-supported by the NIHR Cambridge BRC, the BHF, the Higher Education Funding Council for England, the Engineering and Physical Sciences Research Council, and the Wellcome Trust. This work was additionally supported by the Cancer Research UK Cambridge Centre (A25177) and the Cambridge BHF Centre of Research Excellence (18/1/34212).
Conflict of interest: none declared.
Data availability
The data underlying this article will be shared on reasonable request to the corresponding author after the primary studies related to this data have been published.

Comments