


In this study, a solid-phase extraction (SPE)–high performance liquid chromatography (HPLC)–ultra violet (UV) method was developed for the determination of rivaroxaban (RIV), an oral anticoagulant drug, in human plasma samples. The concentration of RIV in plasma samples was increased 7.5 times and the interference coming from matrix components was avoided by using SPE. The extracted samples of RIV were analyzed by using an HPLC–UV method. RIV was approved in 2008 and many studies have been published in recent years in order to investigate its pharmacokinetic profile in various groups. In light of this information, it is clear that the RIV pharmacokinetic profile should be investigated in further studies; the HPLC–UV method presented in this study might be an easy method to apply, as it is a cheap and rapid alternative to HPLC–MS-MS for this purpose. A Phenomenex Luna 5-µm C18 100 Å LC column (250 × 4.6 mm) was used for the separation of RIV and prednisolone (internal standard). The total analysis time was <6 min. The method was validated according to the FDA guidelines and can be proposed for pharmacokinetic studies of RIV.
Introduction
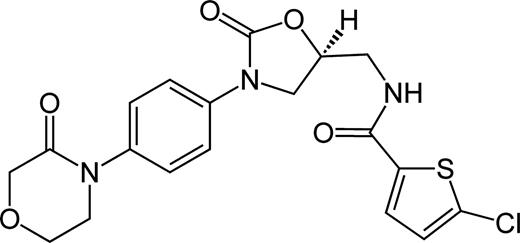
The chemical structure of RIV.
According to the literature, the pharmacokinetic profile of RIV in healthy subjects has been established and demonstrated a favorable safety and tolerability profile. The bioavailability of a 10-mg dose of RIV is high (80–100%), and RIV is rapidly absorbed, reaching a maximal plasma concentration (Cmax) within 2–4 h after oral administration (5). In the literature, it has been reported that high performance liquid chromatography coupled with tandem mass spectrometry (HPLC–MS-MS) can be used for the determination of RIV in human plasma for pharmacokinetic studies (6, 7). Although HPLC–MS-MS is a good technique with the advantages of better sensitivity and selectivity in comparison with other analytical techniques, HPLC with UV detection is a simple, rapid and low cost alternative that can be used in pharmacokinetic studies (8–10). HPLC–UV methods for the determination of RIV in pharmaceutical dosage forms and the investigation of RIV degradation in stability studies have been reported in the last year (11–14). These methods could not be adapted directly with pharmacokinetic studies since using HPLC–UV on biological materials requires pre-cleanup procedures on samples to avoid the undesired interference coming from matrix components. In addition, the sensitivity of the HPLC–UV method must be improved to cover the RIV plasma half-life of 5–9 h in healthy subjects (15). Therefore, solid-phase extraction (SPE) could be used to improve the sensitivity for the specific determination of RIV in plasma samples. SPE can concentrate and purify samples for analysis, and it can be used to isolate analytes of interest from a wide variety of matrices, including urine, blood, water, beverages, soil and animal tissue (16).
In this study, an SPE–HPLC–UV method for the determination of RIV in human plasma was developed and validated according to the FDA guidelines (17). The developed method is proposed for further pharmacokinetic studies of RIV. Since the stability of RIV standard solutions has already been reported under various conditions (13, 14, 18), the stability of RIV in human plasma samples for short- and long-term periods was the focus of this study. This is the only report using the SPE procedure and HPLC–UV for the determination of RIV in biological samples to date.
Experimental
Chemicals and reagents
The RIV working standard was supplied from the National Public Health Agency (Ankara, Turkey). The internal standard (IS) was prednisolone, purchased from Sigma-Aldrich (St Louis, USA). Acetonitrile and methanol were of analytical grade and purchased from Merck (Darmstadt, Germany). Acetic acid and boric acid were purchased from Sigma-Aldrich. All the solutions were prepared in Milli-Q water obtained from a BarnsteadNanopure™ system from Thermo Scientific.
Solutions
Preparation of standard solutions
The standard stock solutions of RIV (1,000 µg mL−1) and the IS (1,000 µg mL−1) were prepared in an acetonitrile : water (80 : 20 v/v) mixture. The standard solutions of RIV (10 and 1 µg mL−1) and the IS (20 µg mL−1) were prepared by diluting the standard stock solutions in the acetonitrile : water (80 : 20 v/v) mixture.
Preparation of borate buffer (pH 9.0, 0.2 M) solution
Boric acid (3.1 g) was weighed and dissolved in 200 mL of water. The pH was adjusted to 9.0 by adding 0.2 M NaOH and the volume was made up to 250 mL by adding water.
Preparation of plasma samples for analysis (SPE procedure)
Blank human plasma samples (pooled human plasma in K2 EDTA) were purchased from EMR chromatography, Turkey. The standard solutions of RIV (10 and 1 µg mL−1) and the IS (20 µg mL−1) were spiked in the designated amounts into blank human plasma samples to obtain 1.5 mL solutions containing 0.01, 0.02, 0.05, 0.2, 0.5, 1.0, 2.0 and 4.0 µg mL−1 of RIV and 2.0 µg mL−1 of the IS. These solutions were vortexed for at least 2 min and borate buffer (pH 9.0, 0.2 M) was used to make up the volume to 3 mL. The final mixture was vortexed for another 2 min. Samples were extracted by with the Phenomenex Strata-X 33-µm polymeric reversed phase (30 mg/3 mL). Then, 3 mL of methanol, 3 mL of water and 3 mL of 0.2 M borate buffer (pH 9.0) were used as the solvents passed through the column in the conditioning step. The buffered plasma samples were added after conditioning and then the columns were completely drained. After the draining process, 3 mL of borate buffer (pH 9.0, 0.2 M), followed by 3 mL of methanol : water (50 : 50, v/v), was used for independent removal of the interference coming from matrix components. Microcentrifuge tubes were then positioned for collection of the samples. One milliliter of a methanol : glacial acetic acid (99 : 1, v/v) solution was added to each column as the eluent solvent of RIV. A stream of nitrogen at ambient temperature dried the eluents and 200 µL of the mobile phase was added to each dried sample before analysis. The mobile phase consisted of acetonitrile : water (55 : 45, v/v). Thus, RIV in 1,500 µL of plasma samples was concentrated by dissolving into 200 µL of the mobile phase. The interference coming from matrix components was discarded.
Chromatographic conditions
The LC system consisted of an SpectraSYSTEM P2000 gradient pump, an SpectraSYSTEM SCM 1000 degasser, an automatic sample and an SpectraSYSTEM UV2000 detector (Thermo Separation Products, USA). The detector was set at 249 nm and peak areas were integrated automatically by an online computer equipped with the ChromQuest software. Separations were carried on a Phenomenex Luna 5-µm C18 100 Å LC Column (250 × 4.6 mm). The flow rate was 1.0 mL min−1 while using isocratic elution with an acetonitrile : water (55 : 45 v/v) mixture. Injection volume was 30 μL, and UV detection was performed at 249 nm.
Analytical method validation
The developed method was validated according to the FDA guidelines, and the calibration curves, sensitivity, precision, accuracy and selectivity of the method were evaluated (17).
Calibration curve
The calibration curves of RIV were constructed under the optimum conditions and the linearity of the method was determined by performing injections at eight different concentration levels (0.01, 0.02, 0.05, 0.2, 0.5, 1.0, 2.0 and 4.0 µg mL−1) over 6 different days. The peak area ratios of RIV to the IS were plotted against the corresponding nominal concentrations of RIV to obtain calibration graphs. The standard deviations of the slope and intercepts were calculated along with the average regression coefficient.
Sensitivity (limit of detection and lower limit of quantification)
The sensitivity of the analytical method was evaluated by determining the limit of detection (LOD) and the lower limit of quantification (LLOQ). Signal-to-noise ratios of 3 : 1 and 10 : 1 were taken as the LOD and LLOQ, respectively (19).
Accuracy and precision
Three different concentrations of RIV (0.05, 0.5 and 2.0 µg mL−1) within the linear range were analyzed on 3 consecutive days (interday studies) and three times on the same day (intraday studies). Injections were performed twice. The relative standard deviation (RSD) and the bias of intra- and interday studies were calculated using regression equations.
Recovery
The recovery of the developed method was investigated for three different concentration levels. Standard solutions containing RIV and the IS were injected and their peak area ratios were compared with those recovered from plasma samples. For this purpose, the concentration factor (7.5×) after SPE was considered and three different concentrations of RIV in plasma samples (0.05, 0.5 and 2.0 µg mL−1) within the linear range were analyzed. The peak area ratios were compared with standard solutions of RIV samples (0.375, 3.75 and 15.0 µg mL−1). This procedure was repeated three times for each of the three concentrations.
Selectivity
The selectivity of an assay is a measure of the extent to which the method can determine a particular compound in the analyzed matrix without interference from matrix components. Therefore, the chromatograms obtained from standard solutions, spiked plasma solutions and blank plasma solutions were compared. The interference peaks coming from matrix components were tracked to show if they interfered with the peaks of RIV and IS.
Stability studies in human plasma samples
Stability of RIV in plasma samples was performed in the short term after being kept at room temperature (6 h) and 4°C (7 days) and in the long term after being kept at −20°C (1-month period). The stability of RIV through freeze and thaw cycles was also evaluated. For this reason, three sets of three different concentrations of RIV (0.05, 0.5 and 2.0 µg mL−1) spiked in plasma were prepared in triplicate. The first set was kept at room temperature for 24 h and the second set was kept at 4°C for 7 days. The third set was kept at −20°C for 1 month. The samples were protected from day light and analyzed at the end of the designated periods. The freeze–thaw cycle stability was investigated using RIV spiked plasma samples that were thawed and defrosted three times and then analyzed. The peak area ratios of the stability samples were compared with freshly prepared samples, and the stability of RIV spiked plasma samples was evaluated over the short and long term. The autosampler stability was also investigated for 12 h.
Results
System suitability results
A suitability test was applied to the chromatograms taken under the optimum conditions to check various parameters such as column efficiency (theoretical plate number, N), tailing factor and capacity factor (k′). The results are given in Table I and compared with the required values (20).
System Suitability Parameters for the Proposed Method (n = 6)
| Found | Requirements | |
|---|---|---|
| Injection repeatability (RSD of tr) | 0.80% | <1.00% |
| Capacity factor (k′) | 1.80 | 1.00 < k′ < 10.00 |
| Efficiency (N) | 9.445 | >2.000 |
| Tailing factor | 1.22 | <1.50 |
| Found | Requirements | |
|---|---|---|
| Injection repeatability (RSD of tr) | 0.80% | <1.00% |
| Capacity factor (k′) | 1.80 | 1.00 < k′ < 10.00 |
| Efficiency (N) | 9.445 | >2.000 |
| Tailing factor | 1.22 | <1.50 |
Analytical method validation results
The developed method was validated according to the FDA guidelines (17, 21) as described in the section ‘Analytical method validation’. Table II presents the calibration curve and sensitivity of the developed method, and Table III presents the accuracy and precision of the developed method.
Linearity of the Developed Method (n = 6)
| Regression equationa | y = 0.8494x + 0.0696 |
| Standard error of intercept | 0.0210 |
| Standard error of slope | 0.0082 |
| Regression coefficient (R2) | 0.9993 |
| Linearity range (µg mL−1) | 0.01–4.00 |
| Number of data points | 8 |
| LOD (µg mL−1) | 0.005 |
| LLOQ (µg mL−1) | 0.01 |
| Regression equationa | y = 0.8494x + 0.0696 |
| Standard error of intercept | 0.0210 |
| Standard error of slope | 0.0082 |
| Regression coefficient (R2) | 0.9993 |
| Linearity range (µg mL−1) | 0.01–4.00 |
| Number of data points | 8 |
| LOD (µg mL−1) | 0.005 |
| LLOQ (µg mL−1) | 0.01 |
LLOQ: lower limit of quantification; LOD: limit of detection.
aBased on six calibration curves where y is the peak area ratio and x is concentration of RIV as µg mL−1.
Accuracy and Precision of the Developed Method (n = 3)
| Added (µg mL−1) | Founda (µg mL−1) | Precision, RSD% | Accuracyb, Bias% | |
|---|---|---|---|---|
| RIV | Intraday | |||
| 0.05 | 0.06 ± 0.00 | 2.77 | 14.5 | |
| 0.50 | 0.52 ± 0.01 | 4.70 | 3.95 | |
| 2.00 | 2.00 ± 0.04 | 3.05 | −0.22 | |
| Interday | ||||
| 0.05 | 0.05 ± 0.00 | 3.42 | 5.7 | |
| 0.50 | 0.53 ± 0.01 | 4.42 | 5.1 | |
| 2.00 | 2.18 ± 0.13 | 10.2 | 8.9 | |
RSD: relative standard deviation.
aMean ± standard error (n = 3).
b[(Found − Added)/Added] × 100.
Recovery of the SPE procedure was investigated as described in the section ‘Recovery’ and the results were found to be satisfactory. The recovery of RIV samples in plasma was found to be 95.45, 97.69 and 93.26% for 0.05, 0.5 and 2.0 µg mL−1, respectively. It was concluded that the SPE procedure was independent of the concentration of RIV.
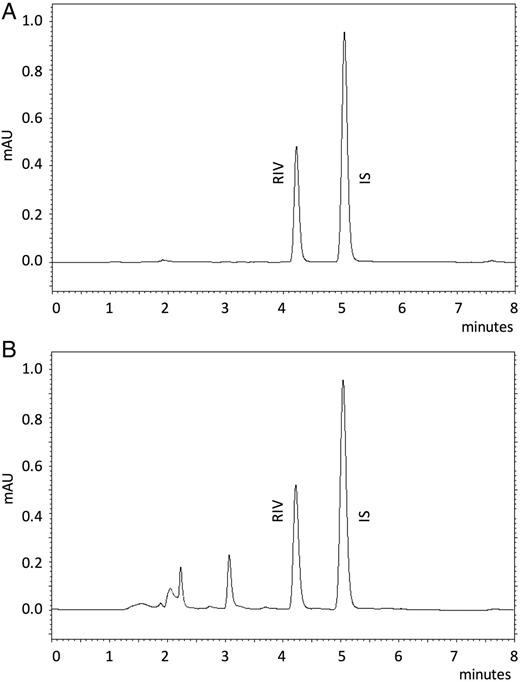
![Chromatograms taken under the optimum conditions [column: Phenomenex Luna 5 µm C18 100 Å LC column (250 × 4.6 mm), flow rate: 1.0 mL min−1, mobile phase: acetonitrile : water (55 : 45 v/v), injection volume: 30 μL, UV detection: 249 nm]. (A) Overlaid chromatograms of RIV spiked in plasma samples (0.02, 0.05, 0.20, 0.50, 1.00, 2.00 and 4.00 µg mL−1) and (B) RIV spiked into plasma as 0.01 µg mL−1 (LLOQ).](https://oup.silverchair-cdn.com/oup/backfile/Content_public/Journal/chromsci/54/2/10.1093_chromsci_bmv135/2/m_bmv13502.jpeg?Expires=1716380771&Signature=oZ9c2kuiho8abA45oODJloxZRD4i1lMXZf1-p37n9alqgPuY0o5cHECe3ICHfxjTOUunsqjUYNUQuXqh3NZ3J~5Wp9ouGfFpG2lrAzZXJ9nYAutC~vfP6afqkYZetBH87NK2qAb9jyJMiYMscrBD3rLi98SmDmtUS-fxH~KpI~39FMXw1IIa0M~blM9X6AwnU~LU1wko9jOyKJF8juw7nms8q7WkPj9R1z9~Zi7VMKkfrmsng6oo9sEZBK3c7EvSaPePkEndo2kbIBe3L~c9uVTnUrUaGyxOv1yImOTvI1WAMDu~jxOUj1rOReukZEtHvDZ1JzcTnPOAsHLDdTpCGA__&Key-Pair-Id=APKAIE5G5CRDK6RD3PGA)
Chromatograms taken under the optimum conditions [column: Phenomenex Luna 5 µm C18 100 Å LC column (250 × 4.6 mm), flow rate: 1.0 mL min−1, mobile phase: acetonitrile : water (55 : 45 v/v), injection volume: 30 μL, UV detection: 249 nm]. (A) Overlaid chromatograms of RIV spiked in plasma samples (0.02, 0.05, 0.20, 0.50, 1.00, 2.00 and 4.00 µg mL−1) and (B) RIV spiked into plasma as 0.01 µg mL−1 (LLOQ).
Chromatograms taken under the optimum conditions. (A) RIV standard solution (3.75 µg mL−1) and (B) RIV spiked into plasma as 0.5 µg mL−1.
Stability of RIV in human plasma samples
The stability of RIV was investigated in the short term [room temperature (6 h), 4°C (7 days)] and long term [−20°C (1 month)]. The freeze–thaw cycle and autosampler stability were also investigated, as described in the section ‘Stability studies in human plasma samples’. The stability of RIV in human plasma samples in the short and long term is summarized in Table IV. As can be seen, RIV was stable under various conditions, in which it was protected from light and kept in plasma samples before analyzed. Freeze–thaw cycle testing was performed to understand if RIV in plasma samples would remain stable under rapid temperature changes that might occur during sample preparation processes. According to our experimental results, RIV was found to be stable since the percentage of RIV in samples was found to be between 95.56 and 104.23% after three freeze–thaw cycles. The autosampler stability was also investigated at room temperature for 12 h, and it was found that the extracted RIV samples were stable in the mobile phase during the operation process.
Short- and Long-Term Stability of RIV in Human Plasma Samples
| Concentration (µg mL−1) | Short term | Long term | |
|---|---|---|---|
| Room temperature (6 h) | 4°C (7 days) | −20°C (1 month) | |
| 0.02 | 107% | 107% | 107% |
| 0.05 | 99% | 95% | 95% |
| 0.50 | 98% | 97% | 96% |
| Concentration (µg mL−1) | Short term | Long term | |
|---|---|---|---|
| Room temperature (6 h) | 4°C (7 days) | −20°C (1 month) | |
| 0.02 | 107% | 107% | 107% |
| 0.05 | 99% | 95% | 95% |
| 0.50 | 98% | 97% | 96% |
Discussion
A drug must cross several semipermeable cell membranes, which are biologic barriers that selectively inhibit the passage of drug molecules before they reach the systemic circulation. Pharmacokinetics is dedicated to the determination of the fate of substances, including drugs, administered externally to a living organism. The pharmacokinetic profile of RIV has already been shown in previous studies (5, 6). RIV was approved in 2008 (22), and many studies have been published by various groups in recent years that have investigated its pharmacokinetic profile (23–26). Some drug–drug interaction studies have also been reported (27). The RIV pharmacokinetic profile should be investigated with further studies, and HPLC–UV might be an easy method to apply, as it is a cheap and rapid alternative for this purpose. Since human plasma contains dissolved proteins, glucose, clotting factors, electrolytes and hormones, an initial extraction process for RIV must be applied before HPLC–UV detection. SPE is a technique used to achieve concentrated samples, with the removal of unwanted molecules and/or the sample matrix from the sample (28). In the present study, SPE was successfully applied for the determination of RIV in human plasma samples; RIV was concentrated 7.5 times, while the interference coming from matrix components was being discarded. RIV is a basic molecule with a pKa of −1.6 and can be dissolved in organic solvents (29). These features of RIV allowed it to be separated from human plasma matrix components during SPE by using an aqueous basic solution [borate buffer (pH 9.0, 0.2 M)] for rinsing and an acidic solution [methanol : glacial acetic acid (99 : 1, v/v)] for elution. For this, 3 mL SPE tubes were used in order to work with 1.5 mL of human plasma samples [see the section ‘Preparation of plasma samples for analysis (SPE procedure)’]. HPLC separations were carried out as described in the section ‘Chromatographic conditions’. The target range of detection and quantification of RIV in plasma samples was between 0.01 and 4.0 µg mL−1; this was achieved by coupling SPE with HPLC–UV. This is the first reported SPE method for the extraction of RIV from human plasma samples and the use of an HPLC–UV method for further pharmacokinetic studies of RIV. The SPE procedure developed in this study increased the RIV concentration in samples by 7.5 times and coupling SPE with HPLC–UV allowed for RIV concentrations to be screened in plasma for at least 12 h. The developed and validated SPE–HPLC–UV method in this study provides the advantages of using HPLC–UV, which is a simple, low cost and frequently used technique in comparison with LC–MS. Thus, it could be proposed as a reliable alternative to LC–MS methods for further pharmacokinetic studies of RIV. The procedure can be easily adapted to be used on liver perfusion and intestinal permeability studies in animal models (30–33).
Conflict of interest statement. None declared.
