


Abstract
Alarm pheromones are widely used in the animal kingdom. Notably, there are 26 published studies (N = 1652) highlighting a human capacity to communicate fear, stress, and anxiety via body odor from one person (66% males) to another (69% females). The question is whether the findings of this literature reflect a true effect, and what the average effect size is. These questions were answered by combining traditional meta-analysis with novel meta-analytical tools, p-curve analysis and p-uniform—techniques that could indicate whether findings are likely to reflect a true effect based on the distribution of P-values. A traditional random-effects meta-analysis yielded a small-to-moderate effect size (Hedges’ g: 0.36, 95% CI: 0.31–0.41), p-curve analysis showed evidence diagnostic of a true effect (ps < 0.0001), and there was no evidence for publication bias. This meta-analysis did not assess the internal validity of the current studies; yet, the combined results illustrate the statistical robustness of a field in human olfaction dealing with the human capacity to communicate certain emotions (fear, stress, anxiety) via body odor.
Introduction
Social communication has been marked as one of the main functions of human olfaction (Stevenson 2010); yet, stating that “pheromones” are the medium for human olfactory communication has remained controversial (Doty 2010). Even though pheromones have been identified, synthesized, and shown to repeatedly trigger genetically predetermined prototypical behavior in many other species (Wyatt 2014, 2015), the quest for human pheromones has yielded “facts, fallacies, fears, and frustrations” (Wysocki and Preti 2004). In this contribution, novel and traditional meta-analytical tools are combined to statistically separate fallacy (selective reporting) from fact (evidential value) when it comes to research examining the human capacity to communicate fear, stress, and anxiety via body odor.
Following the original insect-based definition (Karlson and Lüscher 1959), pheromones are typically believed to be single molecules inducing learning- and context-independent responses after detection by a specialized (vomeronasal) organ (VNO), which is vestigial in humans (Boehm and Gasser 1993; Boehm et al. 1994; Trotier et al. 2000). However, certain mammals use pheromones that consist of multiple molecules (Wyatt 2014), mice can detect pheromones with their main olfactory epithelium (Wang et al. 2006), and even insects display olfactory plasticity by using experience and context to adjust their innate pheromone-based mating strategies (Keleman et al. 2012). When traditional pheromone definitions are updated in the light of these recent insights (de Groot et al. 2017), human pheromones are far more likely to exist.
Irrespective of whether pheromones (or chemosignals) mediate human olfactory communication, research has shown that humans can pick up a multifarious range of social information from another person’s body odor. Body odor can convey, inter alia, a person’s identity (Penn et al. 2007), gender (Doty et al. 1978), age (Haze et al. 2001; Yamazaki et al. 2010; Mitro et al. 2012; Sorokowska et al. 2012), next to transient states, namely sickness (Olsson et al. 2014; Regenbogen et al. 2017), and emotions (Prehn et al. 2006; Mujica-Parodi et al. 2009; Zhou and Chen 2009; de Groot et al. 2012).
Within the chemically communicable class of transient states broadly defined as emotions, researchers have examined the olfactory transfer of happiness (Chen and Haviland-Jones 2000; Zhou and Chen 2009; de Groot et al. 2015a), disgust (de Groot et al. 2012), competition (Adolph et al. 2010), aggression (Mutic et al. 2016), and anger (Hatcher 2016). However, the current meta-analysis will focus on feeling states that garnered sufficient attention from emotion chemosignaling researchers to warrant a meta-analysis, namely fear, stress, and anxiety. Notably, fear, stress, and anxiety may share a common mechanism, namely activation of the fast (fight/flight) stress response system (de Groot et al. 2015b, also see Ackerl et al. 2002). The fight/flight system releases adrenalin, which activates the apocrine sweat glands in the armpit region (Harker 2013) allegedly responsible for chemosignal production. A product of the slow stress system, cortisol, was not found to be related to apocrine sweat production (Ackerl et al. 2002; Harker 2013).
The fear/stress/anxiety chemosignaling literature gradually expanded since 2000 and currently includes 26 published studies (N = 1652). Each study was characterized by a “sender” and “receiver” phase. First, sweat was sampled from the armpit region of mostly male senders (66%) that were induced to be fearful, stressed, or anxious (collectively referred to as fear from now on, for ease of communication), with exercise and/or neutral sweat serving as control conditions. Next, a group of mostly (69%) female receivers were manually (opening a vial) or mechanically (olfactometer) exposed to the different olfactory stimuli (double-blind). Olfactory communication of fear was inferred from receivers’ successful odor discrimination and identification (Chen and Haviland-Jones 2000), startle reflexes (Prehn et al. 2006), fear-specific brain activity (Mujica-Parodi et al. 2009), and emotional facial expressions (de Groot et al. 2012). The similarities between these studies pave the ground for a timely meta-analytical assessment, which is a necessary step to guide the investment of further resources into this field of human olfactory communication.
One problem with traditional meta-analysis, however, is that effect size estimates can be inflated due to publication bias—the “preference” to publish studies with P-values <0.05 (Borenstein et al. 2009; Simonsohn et al. 2014a). Publication bias may lead to selective reporting of analyses that work and leaving out those that failed (“p hacking”), a questionable research practice that greatly increases the false positive rate (Simmons et al. 2011, 2012; Simonsohn et al. 2014a). Hence, despite scientists’ belief to the contrary (Ioannidis 2008), the number of studies with P <0.05 cannot be safely counted as evidence for a true effect (Borenstein et al. 2009); research findings with P <0.05 may have populated the published literature despite the null hypothesis being true.
A novel way to test for (the consequences of) publication bias is p-curve analysis (Simonsohn et al. 2014a, 2014b). This technique capitalizes on the distribution (hence, not the number) of statistically significant P-values, which indicates whether research findings reflect (i) no effect (flat p-curve), (ii) a true effect (right-skewed p-curve), or (iii) selective reporting (left-skewed p-curve) (Simonsohn et al. 2014a) (Figure 1). A flat p-curve means that each P-value <0.05 is equally likely to be observed (false positive)—this is likely when a studied effect does not exist. However, a significantly right-skewed p-curve (more Ps < 0.025 than >0.025) is indicative of a true effect (Cumming 2008)—this is true regardless of the sample size and effect size (Simonsohn et al. 2014a) A research field is likely to contain evidential value when selective reporting can be ruled out as explanation of the findings (Simonsohn et al. 2014a). Selective reporting would be indicated by a left-skewed p-curve, because researchers actively “pursuing significance” would typically stop right below 0.05 (Simonsohn et al. 2014a) as it takes 9 times as many analyses to “hack” P below 0.01 (Simonsohn et al. 2015). In sum, the shape of the p-curve of a set of research findings can be diagnostic of a null effect, a true effect, or selective reporting.
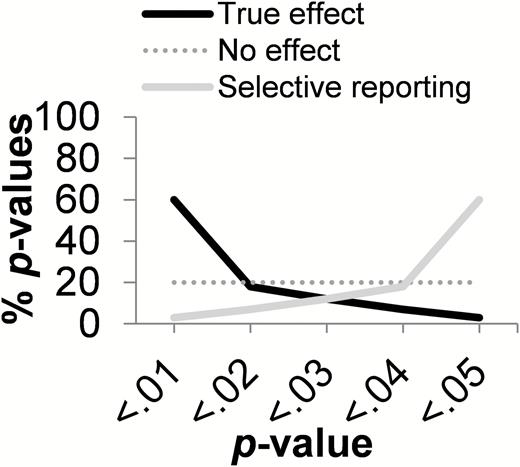
Possible outcomes of p-curve analysis. When the observed distribution of P-values matches the right-skewed black line, this is diagnostic of a true effect. When the flat dark gray line is matched, this is diagnostic of a nonexistent effect (false positive). When the left-skewed light gray line is matched, this is diagnostic of questionable research practices (p-hacking).
Because selective reporting can bias effect size estimates, meta-analytical experts have argued that checking for selective reporting should be the first step in conducting a meta-analysis (Van Aert et al. 2016). Following recent guidelines (Van Aert et al. 2016), p-curve analysis will be used to test for evidence of p-hacking (Step 1). If this hurdle (no evidence of p-hacking) is passed, Step 2 involves conducting a traditional meta-analysis and p-curve analysis or p-uniform—a simultaneously developed tool also using the significant P-value distribution to assess the evidential value of a research field (Van Assen et al. 2015; Van Aert et al. 2016). The added value of p-uniform is that it encompasses a relatively powerful test of publication bias, which dichotomous outcome (Step 3) determines whether the effect size estimate of p-uniform (publication bias: yes) or that of traditional meta-analysis (publication bias: no) has to be interpreted (Van Aert et al. 2016).
To summarize, the present research combines traditional meta-analysis with 2 novel meta-analytical techniques, p-curve analysis and p-uniform, to answer (i) whether the fear chemosignaling literature is characterized by a pattern of p-values diagnostic of selective reporting, a null effect, or evidential value; and (ii) whether the effect size is larger than 0.
Materials and methods
Meta-analytical method
Search strategy
In March 2017, a literature search was conducted using the Web-of-Science database with [CHEMOSIGNALS and FEAR] or [SMELL and FEAR] or [CHEMOSENSORY and ANXIETY] or [CHEMOSIGNALS and STRESS] or [HUMAN and OLFACTORY and COMMUNICATION] as basic topic search terms, revealing 29 candidate articles. One extra article (Hatcher 2016) was encountered after a descendancy search, which entailed tracking down all articles in Web-of-Science that had cited a pioneering fear chemosignaling article (Chen and Haviland-Jones 2000). A further ancestry search entailed browsing the reference lists of 2 recent reviews on fear chemosignaling (Lübke and Pause 2015; de Groot et al. 2017), but neither this approach, nor a careful screening of the reference lists of the initially retrieved 30 articles revealed more studies.
Inclusion criteria
Studies were included if they would meet the following criteria. First, studies needed to have a fear/stress/anxiety body odor sampling condition. Researchers sampled “fear odor” while participants watched horror videos or went skydiving, “anxiety odor” while participants anticipated an academic examination, or “stress odor” while participants performed the Trier social stress task (TSST). Second, control body odors had to originate from the same participants and were obtained during a neutral state and/or exercise. Body odor had to be sampled from the armpit region on absorbent material. Before presentation to receivers, all material was frozen; this did not affect the hedonic quality of the olfactory stimulus (Lenochova et al. 2009).
The typical receiver study had to be double-blind. Receivers had to be normosmic, nonsmoking, healthy, and could not be diagnosed with a psychological disorder. Typically, receivers were exposed to both the fear odor and to one (or multiple) control odor(s). Online measurements of behavior, such as functional magnetic resonance imaging (fMRI) and facial electromyography (EMG) had to be recorded, or affective/cognitive/perceptual/behavioral tasks needed to assess whether a receiver emulated the state of the sender. The response was a typical single assessment of an already present capability to emulate the sender’s emotion.
Based on our criteria, we did not include a study that focused on individuals with panic disorder and that considered a typical control body odor condition (sport sweat) stress-related (Wintermann et al. 2013). Another not included study examined fear- and disgust-related body odor detection capabilities of congenitally blind individuals (Iversen et al. 2015); this study had a sample of healthy controls, but the odor discrimination and odor detection tasks contained either too few body odor control conditions (none) or too many (3) to provide a comparable effect size. A third study was not included as it focused on individual differences in chemosignal detection capabilities that emerged over repeated trials during an experiment (Haviland-Jones et al. 2016), whereas our focus was on a pre-existing capability. A fourth study was not part of this meta-analysis as it focused on the general detection of emotional cues (fear, happy, and sexual arousal) from partners versus opposite sex strangers (Zhou and Chen 2011).
Study sample
The final pool included 26 studies (Nunique = 1652) published from 2000 to 2017 (Table 1). Nunique is reported, as sweat samples were reused in a few studies, or the same “receivers” provided data reported in different papers. Participants were typically highly educated, nonsmoking, healthy, normosmic, heterosexual, Caucasian, and between 18 and 35 years of age. Whereas senders were mostly males (394 vs. 204 females), receivers were mostly females (728 vs. 326 males); this mixed gender dyad is arguably the most “effective” one, since males have larger apocrine sweat glands (Doty 1981) allegedly responsible for chemosignal production, and females are generally better smellers (Brand and Millot 2001) and more sensitive to emotional signals (Brody and Hall 2000).
List of fear/stress/anxiety chemosignaling studies
| Authors publication | Year | Induction | S-M | S-F | R-M | R-F | Odor control condition | Presentation | Main outcome | |
|---|---|---|---|---|---|---|---|---|---|---|
| 1 | Chen and Haviland-Jonespc | 2000 | Video | 11 | 14 | 37 | 40 | Unused pads | Glass bottles | Identification |
| 2 | Ackerl et al.pc, rme | 2002 | Video | 42 | 41 | Neutral BO | Plastic bottles | Odor rating | ||
| 3 | Pause et al.pc, rme | 2004 | Academic exam | 12 | 8 | 8 | Sport BO | Olfactometer | Priming | |
| 4 | Prehn et al.pc, rme | 2006 | Academic exam | 12* | 4 | 3 | Sport BO, unused pads | Olfactometer | Startle reflex | |
| 5 | Chen et al.pc | 2006 | Video | 4 | 3 | 50 | Unused pads, neut. BO | Taped under nose | Cognitive task | |
| 6 | Zhou and Chenpc, rme | 2009 | Video | 8 | 48 | Unused pads | Taped under nose | Perception task | ||
| pc | Video | 16 | “ | Perception task | ||||||
| 7 | Pause et al.pc, rme | 2009 | Academic exam | 28 | 21 | 16 | 16 | Sport BO, unused pads | Olfactometer | Startle reflex |
| 8 | Prehn-Kristensen et al.pc | 2009 | Academic exam | 28* | 21* | 14 | 14 | Sport BO | Olfactometer | fMRI |
| 9 | Mujica-Parodi et al.pc | 2009 | Tandem skydive | 40 | 8 | 8 | Sport BO | Olfactometer | fMRI | |
| pc | 20 | 20 | 8 | 8 | “ | fMRI | ||||
| pc | 32 | 32 | 9 | 5 | “ | Perception task | ||||
| 10 | Pause et al.pc,rme | 2010 | Academic exam | 28* | 21* | 16 | 12 | Sport BO | Olfactometer | EEG |
| pc | 8 | 8 | “ | EEG | ||||||
| 11 | Haegler et al.pc,rme | 2010 | High rope course | 21 | 14 | 16 | Sport BO, unused pads | Taped under nose | Risk game | |
| 12 | Albrecht et al.pc,rme | 2011 | High rope course | 13 | 20 | Sport BO | Taped under nose | Self-report | ||
| 13 | Zernecke et al.pc,rme | 2011 | High rope course | 21* | 15 | Sport BO, unused pads | Taped under nose | Face rating | ||
| 14 | Rubin et al.pc | 2012 | Skydive | 64 | 6 | 8 | Sport BO | Olfactometer | EEG | |
| 15 | de Groot et al.pc,rme | 2012 | Video | 10 | 36 | Unused pads | Polypropene jars | EMG | ||
| 16 | Adolph et al.pc,rme | 2013 | Academic exam | 20 | 40 | Sport BO, unused pads | Olfactometer | Startle reflex | ||
| pc | 36 | “ | EEG | |||||||
| 17 | Radulescu and Mujica-Parodipc | 2013 | Skydive | 20* | 20* | 8* | 8* | Sport BO | Olfactometer | fMRI |
| 18 | Dalton et al.pc,rme | 2013 | Trier soc. stress | 44 | 48 | 72 | Sport BO, “treated” BO | Glass bottles | Ratings person | |
| 19 | de Groot et al.pc,rme | 2014a | Video | 13 | 13 | 26 | 26 | Neutral BO | Polypropene jars | EMG |
| 20 | de Groot et al.pc,rme | 2014b | Video | 8 | 30 | Neutral BO | Polypropene jars | EMG | ||
| 21 | de Groot et al.pc,rme | 2015a | Video | 9 | 35 | Neutral BO | Polypropene jars | EMG | ||
| 22 | de Groot et al.pc,rme | 2015b | Trier soc. stress | 8 | 31 | Neutral BO | Polypropene jars | EMG | ||
| 23 | Wudarczyk et al.pc | 2015 | Academic exam | 10 | 14 | 10 | Sport BO | Olfactometer | fMRI | |
| 24 | Wudarczyk et al.pc,rme | 2016 | Academic exam | 10* | 14* | 10* | Sport BO | Olfactometer | fMRI | |
| 25 | Hatcher (dissertation)pc,rme | 2016 | Video | 35 | 15 | 75 | 81 | Eccrine sweat (back) | Glass bottles | Self-report |
| 26 | Lübke et al.pc,rme | 2017 | Academic exam | 28 | 10 | Sport BO, unused pads | Olfactometer | Startle reflex | ||
| Total unique, N = 1652 | 394 | 204 | 326 | 728 |
pc, Data subjected to p-curve analysis; rme, data subjected to random-effects meta-analysis; S, sender; R, receiver; M, male; F, female; BO, body odor. The asterisk denotes participants were tested in an earlier study.
Meta-analysis
Step 1: Checking for evidence of selective reporting
Because effect size estimates may be biased in any direction due to selective reporting (p-hacking), the first step was to check for evidence of selective reporting in the fear chemosignaling literature with p-curve analysis (Van Aert et al. 2016), a technique developed by Simonsohn and colleagues (2014a, 2014b, 2015). Because significant (P < 0.05) results are more likely to be published than nonsignificant (P ≥ 0.05) ones (Simonsohn et al. 2014a, 2014b), selective reporting primarily operates through statistical significance (Fanelli 2012). Notably, a left-skewed distribution of statistically significant P-values is telling of selective reporting: High percentages of P-values between 0.025 and 0.05 (vs. <0.025) signify that analyses failing to produce P <0.05 remained in the file-drawer, whereas analyses that worked appeared in the published literature. Hence, a left-skewed p-curve will be diagnostic of selective reporting (Figure 1).
Searching for unpublished manuscripts is good practice in traditional meta-analysis (Borenstein et al. 2009; Rothstein and Hopewell 2009); yet, it is not required for p-curve analysis (Simonsohn et al. 2014a). For p-curve analysis, the sample size (or degrees of freedom) and the F-, t-, or z-values of the published studies are needed to make a diagnostic statement about selective reporting. With only 5 P-values, p-curve analysis will have higher statistical power than the individual studies (Simonsohn et al. 2014a). The current p-curve analysis included 30 P-values (26 studies, 30 experiments). There were insufficient data from one study (Radulescu and Mujica-Parodi 2013); yet, because this study used the same sample as Mujica-Parodi et al. (2009), the total number of unique participants was not affected.
We followed open science reporting guidelines (Simonsohn et al. 2015) by including all p-curved results in a p-curve disclosure table (Supplementary Material S1). The disclosure table lists the specific hypothesis for each experiment, the study design, the effect of interest (main effect, interaction), and the actual statistic that was subjected to p-curve analysis. The disclosure table also contains the rationale for (consistently) including or excluding a study result. To name one, P-values had to be statistically independent. Since evidence for fear chemosignaling was typically inferred from co-dependent measures, secondary and tertiary p-curves (robustness checks) were conducted. The prespecified selection rules were as follows. Whenever there were 2 equally relevant P-values, the P-value reported first (vs. second) was subjected to primary (vs. secondary) p-curve analysis (Lakens 2014; Simonsohn et al. 2014b). In case of 3 or more P-values, the first (vs. highest) P-value was conservatively selected for primary (vs. secondary) analysis. A tertiary robustness check was performed on what researchers labeled “secondary analyses,” as these secondary analyses are often alternative yet relatively more imprecise tests of the same hypothesis. All 3 p-curves were calculated with an online tool (http://www.p-curve.com/app4).
The pattern of P-values mirrored a true effect if either the half p-curve (P < 0.025) was significantly right skewed, or if both the half and full p-curve (P < 0.05) were significantly right skewed [dropping Ps between 0.025 and 0.05 would reduce the statistical power of the p-curve analysis to detect evidential value (Simonsohn et al. 2014a, 2015)]. In either scenario, the findings were unlikely to be the result of selective reporting. Ruling out selective reporting as a likely explanation for a set of findings is the only objective of testing for evidential value (Simonsohn et al. 2014a). Similarly, evidential value was interpreted as inadequate if p-curves were flatter than one would expect when power is 33% (Simonsohn et al. 2015).
Step 2: Conducting the meta-analysis
Before computing an average effect size, the “comparison of interest” had to be identified for each study (Supplementary Material S2). This comparison of interest was selected based on (i) the measure that was most consistently reported across studies, (ii) the control condition that was most comparable across studies, and (iii) the most relevant of 2 (or more) hypothesis tests.
Next, we followed general recommendations (Cumming 2012; Lakens 2013) by calculating for each comparison of interest the effect size Cohen’s drm—a relatively conservative effect size estimate for repeated measures designs (Cohen 1988):
In this equation, M = mean, SD = standard deviation, subscript t = target odor (fear), subscript c = control odor (sport/neutral), and r reflects the correlation between repeated measures (Cohen 1988). The correlation r was also required for calculating the variance of the effect size, Vd (equation 4.28 in Borenstein et al. 2009). Since rs were never reported, all corresponding authors were approached by email with the request to provide these (and other missing) data for the comparison of interest. When Ms and SDs could not be retrieved, there was insufficient information to calculate an effect size (25% of total N). When only rs were missing and these could not be retrieved from the authors (21% of total N), 2 effect sizes were calculated (sensitivity analysis) based on the lowest (r = 0.08) and the highest known correlation (r = 0.93). In the majority of cases, however, the authors were capable of providing all the relevant information (N = 899).
Concerning Cohen’s d, a value of 0.2 was considered “small,” 0.5 “medium,” and 0.8 “large” (Cohen 1988). Because Cohen’s d and its variance (Vd) are positively biased, both were multiplied with correction factor J (equations 4.22 and 4.23 in Borenstein et al. 2009) to obtain effect size Hedges’ g and variance Vg. The standard error (SEg) of Hedges’ g is simply the square root of the variance Vg (Borenstein et al. 2009).
Both p-uniform analysis and traditional (fixed and random-effects) meta-analysis were then conducted using version 3.3.2 of R—a free software environment for statistical computing (downloadable from: https://www.r-project.org). Before running the analyses with the R script (Supplementary Material S3), the packages puniform, meta, and metafor had to be installed.
After installation of these packages, the p-uniform function digested our effect sizes Hedges’ g and variance Vg to produce its own effect size estimate, a traditional fixed-effect model effect size estimate, a test for publication bias, and a test for heterogeneity (Van Assen et al. 2015; Van Aert et al. 2016). The latter is a test of excess variance; the test is significant when the weighted sum of squares (Q) is substantially larger than the degrees of freedom (Borenstein et al. 2009).
The same heterogeneity test was provided by the meta-package (Schwarzer et al. 2015) via the metagen-function, which also produced the traditional random-effects model. When significant (α = 0.10) heterogeneity was encountered, the source of the heterogeneity was identified by (i) visual inspection of nonoverlapping 95% SEg of the included studies, and by (ii) inspecting whether studies fell outside the 95% CI boundaries of the Galbraith plot, a scatter plot of standardized effect size estimates against inverse standard error (provided by the package “metafor”) (Galbraith 1988). The identified studies were then removed, after which the heterogeneity analysis was rerun (and the Galbraith plot reproduced) to verify whether heterogeneity no longer posed a problem. The meta-package was then used to create 2 forest plots (as stated before, for reasons of sensitivity analysis) on the final data. The forest plot displayed the Hedges’ g effect size for each study (±2 SEg), and how each study related to the average effect size across studies plus CI.
Notably, we reported only the random-effects meta-analysis in this manuscript, for the following reason. We have assumed that the included studies have sufficient in common that a meta-analysis is sensible, but there is no reason to assume that studies are identical enough to produce the same effect size in all studies, as assumed by the fixed-effects model (Borenstein et al. 2009); in our case, the random-effects model would calculate a more suitable average effect size, based on a distribution of true effect sizes (Borenstein et al. 2009).
Step 3: Checking for publication bias
Three approaches were taken to identify publication bias. First, all corresponding authors of the published fear chemosignaling literature were asked by email whether they failed to publish any studies, because P was >0.05. Second, a left skewed p-curve could indicate the presence of publication bias. Third, we performed a direct test of publication bias, in line with the third recommendation of Van Aert et al. (2016). The popular trim-and-fill procedure is discouraged, as it often produces inaccurate results (Simonsohn et al. 2014a; Stanley and Doucouliagos 2014; Van Assen et al. 2015). Instead we used p-uniform’s publication bias test, which has higher statistical power than traditional publication bias tests (Van Assen et al. 2015) that are usually plagued by low power (Borenstein et al. 2009).
If there was evidence for publication bias, p-uniform’s effect size estimate was interpreted, whereas in case of no evidence for publication bias, the traditional random-effects model effect size was interpreted (Van Aert et al. 2016). For ease of reporting, we first mentioned (the absence of) evidence for publication bias, and only then reported the results from the adequate meta-analytical model.
Results
P-curve analysis: Selective reporting versus evidential value
The first question to answer was whether the fear chemosignaling literature revealed a significant right-skewed pattern of p-values diagnostic of the evidential value of that set of findings, automatically ruling out selective reporting as likely explanation of the published findings. Second, the evidential value was interpreted as inadequate if at least the full p-curve was flatter than the expected p-curve if studies were powered 33% (Simonsohn et al. 2014a). Our primary p-curve analysis included the focal analyses of the fear chemosignaling studies (N = 1652), whereas second and third p-curves (robustness checks) assessed evidential value based on relatively weaker tests of the same hypothesis.
All p-curves were significantly right-skewed (Figure 2), namely the primary analysis (half p-curve, Z = −7.08, P < 0.0001; full p-curve, Z = −7.31, P < 0.0001), the secondary analysis (half p-curve, Z = −5.06, P < 0.0001; full p-curve, Z = −4.30, P < 0.0001), and the tertiary analysis (half p-curve, Z = −6.57, P < 0.0001; full p-curve, Z = −7.46, P < 0.0001). Hence, the distribution of p-values from the focal analyses and relatively weaker tests of the fear chemosignaling hypothesis reflected a pattern diagnostic of a true effect, excluding selective reporting as likely explanation of these findings. Furthermore, evidential value for this set of findings was not inadequate, as was indicated by the full p-curves not being flatter than expected for 33% powered studies (primary: Z = 3.60, P > 0.99; secondary: Z = 0.97, P = 0.83; tertiary: Z = 3.69, P > 0.99).
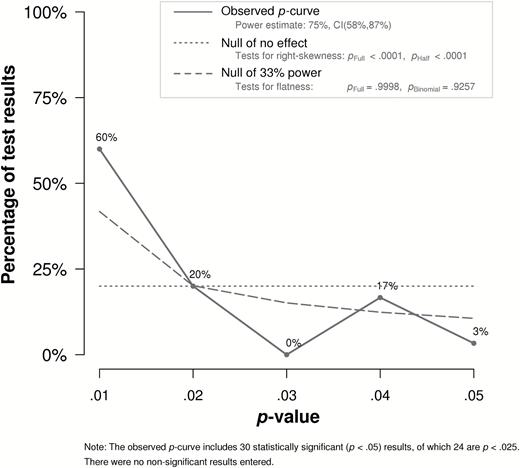
The distribution of P-values from focal analyses in the published fear chemosignaling literature was significantly right-skewed, diagnostic of a true effect. Hence, the pattern of P-values from this set of findings was unlikely to have emerged from selective reporting.
In sum, p-curve analysis ruled out selective reporting as likely driver of the significant effects observed in the published fear chemosignaling literature. The pattern of P-values was not diagnostic of inadequate evidence, but rather it mirrored the expected right-skewed distribution of P-values that is observed when an effect is true.
Even though p-curves may show a pattern reflective of a true effect for a given set of findings, this does not mean the effect size is larger than negligible (Cohen 1994; Simonsohn et al. 2014a). The next step was to determine the average effect size of the fear chemosignaling literature.
Self-report, p-curve, and p-uniform: Publication bias
As adequate effect size estimates depend on the presence or absence of evidence for publication bias, the assessment of publication bias is reported first. Our 3-pronged approach started by asking the corresponding authors of the published fear chemosignaling articles whether they had file-drawered research because of P > 0.05; yet, none of them declared to have done so. We retrieved and included a Master’s research on fear chemosignaling (N = 41) that was conducted in our own lab, which was not published even though P < 0.05 (Vink 2015). Second, p-curve analysis had already substantiated that the published fear chemosignaling findings were unlikely to have been driven by the selective reporting of analyses that “worked” versus those that failed. Third, a recently recommended and relatively powerful direct test of publication bias belonging to p-uniform (Van Aert et al. 2016) was conducted, and this test was not significant—neither before (rlow: P = 0.439; rhigh: P = 0.751), nor after the exclusion of heterogeneous studies (rlow: P = 0.146; rhigh: P = 0.291).
In sum, there was no evidence of publication bias, one of the greatest threats to the validity of meta-analyses (Rothstein et al. 2005; Van Assen et al. 2015). As a consequence (see Van Aert et al. 2016, for a rationale), we used a random-effects model to estimate the average true effect size underlying human fear chemosignaling.
Random-effects meta-analysis: Average true effect size
A traditional random-effects meta-analytical model was computed to verify whether the average fear chemosignaling effect size was larger than negligible. The random-effects model was based on a representative (N = 1240) subset of findings from the fear chemosignaling literature, limited by the amount of reported information for reliable effect size calculation (see Materials and methods, for details). Even though the average sample was not large (N = 35, range = 7–156), multiple small-N studies could yield an unbiased and precise effect size estimate (Van Assen et al. 2014; Schönbrodt 2015). For the purpose of sensitivity analysis, 2 effect sizes were calculated, one that was based on the lowest known correlation between repeated measures (rrm) (N = 899) in cases where rrm was unknown (N = 341), whereas the second was computed for the same studies after imputing the highest known rrm.
According to random-effects meta-analysis, the average unbiased true effect size for fear chemosignaling was small-to-moderate, with the low correlation-estimate, g = 0.36, 95% CI = [0.27–0.46], Q(20) = 29.03, P = 0.087, showing only a small difference in terms of effect size from the high-correlation-estimate, g = 0.34, 95% CI = [0.26–0.42], Q(20) = 45.09, P = 0.001. One caveat was substantial heterogeneity (I2 > 25%) that was encountered in both cases (rlow: I2 = 31.1%; rhigh: I2 = 55.6%). Visual inspection of the forest plot and Galbraith plot (Supplementary Material S3) indicated 2 studies (Haegler et al. 2010; de Groot et al. 2015b) as potential sources of significant heterogeneity. Both studies had to be removed, as removing only Haegler et al. (2010) kept substantial heterogeneity, rlow: Q(19) = 28.35, P = 0.077, I2 = 31.5%; rhigh: Q(19) = 27.75, P = 0.088, I2 = 33%; and removing only de Groot et al. (2015b) did not reduce heterogeneity either for rhigh, Q(19) = 38.15, P = 0.006, I2 = 50.2%. After removal of these 2 studies, the heterogeneity test was no longer significant: rlow, Q(18) = 16.48, P = 0.559, I2 = 0.0%; rhigh, Q(18) = 18.52, P = 0.422, I2 = 2.8%. The average unbiased effect size estimate for the nonheterogeneous sample was again small-to-moderate, rlow: Hedges’ g = 0.40, 95% CI = [0.32–0.48]; rhigh: Hedges’ g = 0.36, 95% CI = [0.31–0.41] (Figure 3). In sum, the traditional random-effects model meta-analysis showed unequivocally and with 95% certainty that the average true effect size of the fear chemosignaling literature is larger than negligible, namely small-to-moderate.
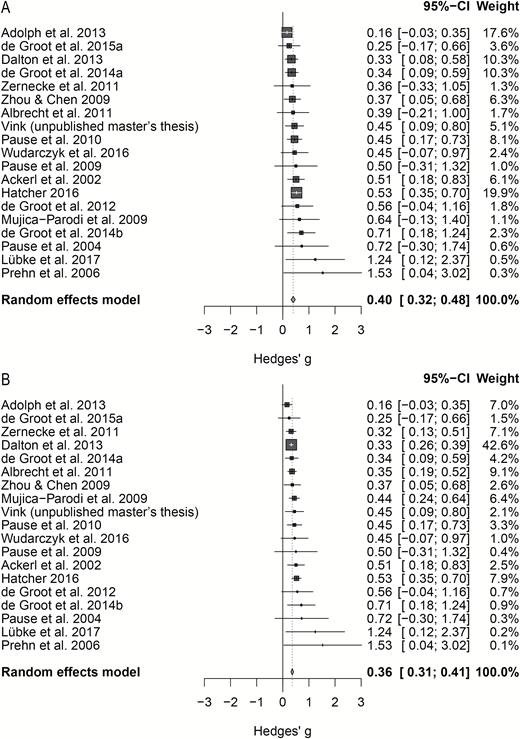
Forest plot showing unbiased effect sizes (Hedges’ g) for each fear chemosignaling study and the average of this literature. Study labels are depicted left, whereas actual effect sizes, 95% CIs, and study weights are on the right side. Sensitivity analysis, based on imputation of the lowest and highest known correlation if the actual correlation could not be retraced: (A) effect size estimate based on rlow; (B) effect size estimate based on rhigh.
Discussion
Here, traditional meta-analysis was complemented with novel meta-analytical techniques, p-curve and p-uniform, to answer to two timely and important questions, namely whether (i) fear chemosignaling research is characterized by a pattern of P-values diagnostic of selective reporting, a null effect, or a true effect; and (ii) accounting for publication bias, whether the average effect size is larger than 0. P-curve analysis indicated there was no evidence supporting selective reporting; rather, the distribution of P-values in the fear chemosignaling literature mimicked the expected P-value distribution when there is a true effect. Robustness tests corroborated these conclusions analyzing the highest P-values of “primary” measures and P-values from relatively weaker “secondary” measures. Notably, 3 different sources, namely authors’ reports, p-curve analysis, and p-uniform, did not reveal evidence for publication bias. As a consequence, a traditional random-effects meta-analysis was used to estimate whether the average effect size was larger than negligible.
First, significant heterogeneity was dealt with by removing 2 studies based on visual inspection of plots, before interpreting the effect size estimate of the random-effects model. The more conservative of the 2 unbiased Hedges’ g effect sizes yielded 0.36, 95% CI [0.31–0.41]. In sum, we followed the recent recommendation (Van Assen et al. 2015; Van Aert et al. 2016) of combining regular meta-analysis with p-curve analysis and p-uniform, novel tools that assess evidential value based on the distribution of P-values. These different meta-analytical techniques converged and unequivocally showed the statistical robustness and small-to-moderate impact of the human fear chemosignaling literature.
Even though p-curve analysis assesses whether findings are more likely to reflect evidential value than selective reporting, this does not imply that the average effect size is more than trivial. One example is p-curve analysis being used (Gildersleeve et al. 2014a) to test the evidential value of odor-based mate choices shifting with the menstrual cycle (Gangestad et al. 2005). Whereas p-curve analysis showed patterns diagnostic of evidence (Gildersleeve et al. 2014a), traditional meta-analyses yielded a negligible effect size (Wood et al. 2014) (see Harris et al. 2014; Wood and Carden 2014, for a discussion], or at best a very small (g < 0.2) effect (Gildersleeve et al. 2014b). Hence, p-curves are best combined with (traditional) effect size estimates to decide if a literature reports on a true and meaningful effect, and the human chemosignaling of fear was shown to be such a field.
The small-to-moderate impact of human fear chemosignaling may be hard to reconcile with persistent, yet erroneous, views of an inferior human sense of smell (see Le Guérer 2002; McGann 2017, for a historical overview). One of the reasons for the lack of confidence in our smell abilities may be the difficulty we have naming smells (Olofsson and Gottfried 2015). In a similar vein, the majority of participants in fear chemosignaling studies were not capable of naming the stimulus source; yet, olfactory stimuli were recently argued to exert stronger effects when subtle and unnamable (Smeets and Dijksterhuis 2014). Under these circumstances, conscious top-down regulation of the initial stimulus-driven effects may be less likely to occur (Li et al. 2007). Hence, the implicit effect of human olfactory communication by means of emotion-related chemosignals is not automatically reflected in tiny effect sizes; rather, their impact is small-to-moderate.
The current research is obviously not without limitations. These limitations revolve around the nonidentification of potential moderators influencing the average effect size, the accuracy of the meta-analysis, and the insensitivity of this meta-analysis to address the validity of the theory.
First, a low number of studies with unique features made it impossible to statistically assess with sufficient power potential moderators of the fear chemosignaling effect. Nevertheless, 2 studies were identified as likely causes of heterogeneity. One low effect size study (de Groot et al. 2015b) differed from similar studies (de Groot et al. 2012, 2014a, 2014b, 2015b) in the body odor sampling procedure being 3 times shorter, and the fear manipulation not involving horror videos—sweat was sampled only during the anticipation phase of an adapted Trier Social Stress Test. The other source of heterogeneity (Haegler et al. 2010) may be related to the measure of fear (making more risky decisions), since the same donor material was used in another study not causing heterogeneity (Zernecke et al. 2011). With a greater number of studies, one could also assess whether higher effect sizes are obtained in studies using male donors and female receivers (Rubin et al. 2012; de Groot et al. 2014a), in studies using threat-sensitive participants, such as socially anxious individuals (Pause et al. 2009, 2010), and in studies using objective online measures of affect (fMRI and facial EMG) and startle reflexes versus subjective ratings—these may interrupt the implicit influence of the body odor (also see Lundström and Olsson 2010; Parma et al. 2017, for meta-perspectives on effective chemosignaling).
Second, the accuracy of p-curve analysis obviously depends on the study results that were entered. Following the guidelines of Simonsohn et al. (2014a), we publicly shared our p-curve disclosure table—others may attempt to replicate our finding that a small-to-moderate true effect is more likely to underlie the present set of findings than a p-hacked nonexistent one. Although the current p-curve analysis yielded a pattern diagnostic of a true effect, this does not mean that each individual fear chemosignaling study contributed to the reflection of evidence. To avoid being confronted with a lack of evidence in the face of a true effect, researchers could use the current effect size estimates to properly power their prospective experiments. To counteract p-hacking, researchers are advised to preregister their statistical analyses.
Whereas the present meta-analyses statistically assessed the evidential value and impact of the chemosignaling findings, the validity of the theory, research design, and measurement instruments were left unquestioned. To illustrate, p-curve analysis could indicate evidential value for a hypothesis framed as “humans can communicate fear via their body odor”; however, in the absence of adequate measurement instruments and body odor control conditions, one cannot infer with certainty that “fear” was communicated. According to some researchers, no emotion measure (from subjective experience to actual behavior) can distinguish between fear and other negative emotions, such as anger (Mauss and Robinson 2009). However, others have shown that experiencing (vs. perceiving) fear was related to aversive avoidance motivation, whereas experiencing anger was associated with appetitive approach motivation (Carver and Harmon-Jones 2009). Theoretical reviews could in this case complement meta-analyses by integrating recent emotion theories to establish whether the chemosignaling of fear is a viable construct.
In sum, this meta-analysis is only one of 3 pillars facilitating knowledge accumulation. Whereas theoretical reviews could additionally identify important moderators of the fear chemosignaling effect and address the validity of the theory, well-powered preregistered replication studies on fear chemosignaling could circumvent possible selective reporting.
Conclusion
The first research on the olfactory communication of emotions in humans was published at the turn of the century (Chen and Haviland-Jones 2000); now, almost 2000 participants found their way into a fear chemosignaling study. These instances made for an important snapshot assessment of the evidential value of research examining the chemosignaling of fear, stress, and anxiety. Novel meta-analytical techniques (p-curve and p-uniform) and regular meta-analysis converged by showing no evidence for publication bias, false positives, or selective reporting. Rather, patterns indicative of evidential value were revealed, and the average effect size was small-to-moderate. Fear chemosignaling was thus found more likely to be a “fact” than a “fallacy,” and researchers should have no “fears” or “frustrations” (Wysocki and Preti 2004) when taking the necessary steps to further advance this research topic by delving more deeply into the foundations of this human capacity.
Supplementary Material
Supplementary data are available at Chemical Senses online.
Funding
This work was supported by a Research Talent Grant from the Netherlands Organization for Scientific Research (NWO) [406-11-078/MaGW to J.G.].
Acknowledgments
The first author [J.G.] performed the literature search, conducted the meta-analyses, and wrote the article; the second author [M.A.M.S.] reviewed meta-analytical decisions and helped to improve the article. We thank meta-analysis experts Robbie van Aert and Marcel van Assen for their help in making meta-analytical decisions, and Van Assen in particular for his extremely valuable feedback on an earlier version of our manuscript. Gün Semin is thanked for his contributions to work that is part of this meta-analysis. We also thank Denise Chen, Karl Grammer, Katrin Lübke, Bettina Pause (and her group), Olga Wudarczyk, and Wen Zhou, who generously invested time and effort to provide us with their data. The authors’ own work is part of this meta-analysis. Data collection and analysis was performed based on the recommendations of independent statisticians.
References
References marked with an asterisk are studies included in the meta-analysis.
* Ackerl K, Atzmueller M, Grammer K.
* Adolph D, Meister L, Pause BM.
* de Groot JHB, Semin GR, Smeets MAM.
* de Groot JHB, Semin GR, Smeets MAM.
* de Groot JHB, Smeets MAM, Rowson MJ, Bulsing PJ, Blonk CG, Wilkinson JE, Semin GR.
* de Groot JHB, Smeets MAM, Semin GR.
* Hatcher LC.
* Vink SM.
* Wudarczyk OA, Kohn N, Bergs R, Gur RE, Turetsky B, Schneider F, Habel U.
* Zernecke R, Haegler K, Kleemann AM, Albrecht J, Frank T, Linn J, Brückmann H, Wiesmann M.
