


Abstract
Brain magnetic resonance imaging is an important tool in the diagnosis and monitoring of multiple sclerosis patients. However, magnetic resonance imaging alone provides limited information for predicting an individual patient’s disability progression. In part, this is because magnetic resonance imaging lacks sensitivity and specificity for detecting chronic diffuse and multi-focal inflammation mediated by activated microglia/macrophages. The aim of this study was to test for an association between 18 kDa translocator protein brain positron emission tomography signal, which arises largely from microglial activation, and measures of subsequent disease progression in multiple sclerosis patients. Twenty-one patients with multiple sclerosis (seven with secondary progressive disease and 14 with a relapsing remitting disease course) underwent T1- and T2-weighted and magnetization transfer magnetic resonance imaging at baseline and after 1 year. Positron emission tomography scanning with the translocator protein radioligand 11C-PBR28 was performed at baseline. Brain tissue and lesion volumes were segmented from the T1- and T2-weighted magnetic resonance imaging and relative 11C-PBR28 uptake in the normal-appearing white matter was estimated as a distribution volume ratio with respect to a caudate pseudo-reference region. Normal-appearing white matter distribution volume ratio at baseline was correlated with enlarging T2-hyperintense lesion volumes over the subsequent year (ρ = 0.59, P = 0.01). A post hoc analysis showed that this association reflected behaviour in the subgroup of relapsing remitting patients (ρ = 0.74, P = 0.008). By contrast, in the subgroup of secondary progressive patients, microglial activation at baseline was correlated with later progression of brain atrophy (ρ = 0.86, P = 0.04). A regression model including the baseline normal-appearing white matter distribution volume ratio, T2 lesion volume and normal-appearing white matter magnetization transfer ratio for all of the patients combined explained over 90% of the variance in enlarging lesion volume over the subsequent 1 year. Glial activation in white matter assessed by translocator protein PET significantly improves predictions of white matter lesion enlargement in relapsing remitting patients and is associated with greater brain atrophy in secondary progressive disease over a period of short term follow-up.
Introduction
Multiple sclerosis is a chronic inflammatory, demyelinating and neurodegenerative disease of the CNS leading to progressive neuroaxonal loss and subsequent brain atrophy. Clinically, multiple sclerosis typically presents as acute neurological episodes (relapses) with complete or partial recovery [relapsing remitting multiple sclerosis (RRMS)] with a later stage of progression of disability [secondary progressive multiple sclerosis (SPMS)]. Inflammatory demyelinating white (and grey) matter lesions are characteristic of the disease. White matter lesions are visualized on conventional MRI by focal hyperintensity on T2-weighted imaging and, when acute, often by gadolinium-contrast enhancement on T1-weighted imaging. White matter lesions detected by MRI are routinely used to aid diagnosis and monitor disease. Combination of the number of new and enlarging T2 lesions with annualized brain atrophy rate predicts a large proportion of the variance in short term disability progression for RRMS (Sormani et al., 2011, 2014; Popescu et al., 2013). These conventional MRI measures are commonly used as early phase clinical trial outcomes (Filippi et al., 1995; Lee et al., 1998). We hypothesize that imaging measures of activation of microglia, the innate immune cells of the CNS, could predict an additional component of the variance in future disease progression with both RRMS and SPMS.
Histopathologically different types of white matter lesions have been identified (Lucchinetti et al., 2004). Acute lesions or those showing peripheral innate immune activation associated with demyelination (so called ‘slowly expanding’ lesions) may be those most likely to enlarge over time (Prineas et al., 2001; Lucchinetti et al., 2004; Filippi et al., 2012). The latter appear to be characteristic of progressive forms of multiple sclerosis. Activated microglial nodules in the white matter that can be found in association with demyelinating and damaged axons may precede the appearance of new lesions (Seewann et al., 2009; Singh et al., 2013). Direct tests and clinical applications of these findings is limited, however, as conventional MRI lacks sensitivity and specificity for detecting the diffuse extra-lesional innate immune inflammation in the white matter evident from post-mortem neuropathology (Filippi et al., 2012); radiologically, these areas appear as normal-appearing white matter (NAWM) on conventional MRI (Allen et al., 2001). A challenge for imaging in multiple sclerosis thus has been to develop more sensitive and specific measures to better reconcile assessments of histopathology made post-mortem with imaging measures in vivo. Magnetization transfer imaging, for example, enhances the contrast between white matter water molecules associated with macromolecules and free water. This increases sensitivity for detection of demyelination and neuroaxonal loss (Schmierer et al., 2004; Vrenken et al., 2006; Moll et al., 2011).
Our understanding of the in vivo evolution of innate inflammatory pathology in multiple sclerosis brain remains limited, however. This aspect of the immune response has mainly been studied only cross-sectionally post-mortem. The 18 kDa mitochondrial translocator protein (TSPO) can be highly expressed in activated microglia and astrocytes (Cosenza-Nashat et al., 2009). In multiple sclerosis, currently available imaging-pathological correlations suggest that increased radioligand uptake relatively specifically reflects microglial activation (Matthews and Datta, 2015; Datta et al., 2016). PET radioligands specific for TSPO have been used to study the distribution and relative magnitude of microglial activation. Clinical TSPO PET studies reported higher uptake in grey matter and white matter (NAWM and white matter lesions) in multiple sclerosis than in healthy volunteers, although the relationship of TSPO uptake across brain regions within individual multiple sclerosis brains was not reported in these studies (Politis et al., 2012; Colasanti et al., 2014; Herranz et al., 2016). These findings in vivo were obtained using both the first generation and the higher affinity second generation TSPO radioligands.
Increases in lesion load and brain atrophy are strongly correlated with disease progression and worse clinical outcomes (Sormani et al., 2014). Here we investigated whether in vivo glial activation assessed using 11C-PBR28 TSPO PET imaging could be used to predict T2 lesion volume change and brain atrophy over the subsequent 1 year and therefore enhance precision in identifying patients at higher risk of worsening disease. We explored whether adding magnetization transfer imaging of NAWM as a measure of demyelination could further add additional predictive power.
Materials and methods
Patients
The study was approved by the West Bromley Research Ethics Committee (Ref No. 14/LO/0445) and the UK Administration of Radioactive Substances Advisory Committee. All patients gave written informed consent in accordance with the Declaration of Helsinki.
Patients with a diagnosis of multiple sclerosis according to the revised McDonald criteria (2010) (Polman et al., 2011), with EDSS (Expanded Disability Status Scale) up to 7.0 and either a relapsing remitting or a secondary progressive disease course were studied (Table 1). Usual care of the patients was not interrupted during the period of this observational study and many of the patients were on disease-modifying treatments (Table 1), but none of the patients had been treated with steroids or experienced a clinical relapse within 3 months of their scans. Patients who were claustrophobic, had metal implants or fragments in their bodies or who had received radiation above background exceeding 10 mSv in the previous 3 years or women who were pregnant or breastfeeding were not eligible to participate, although none of those screened met these exclusion criteria and were therefore not excluded.
Clinical demographics of individual multiple sclerosis patients
| Patient | Gender | Age, years | MS subtype | Disease duration, years | Baseline EDSS | Follow-up EDSS | EDSS change | Relapses | DMT treatment at follow-up (changes from baseline are noted) |
|---|---|---|---|---|---|---|---|---|---|
| A1 | F | 22 | RRMS | 16 | 3.0 | 3.5 | 0.5 | 3 | Fingolimod |
| A2 | M | 38 | RRMS | 10 | 6.0 | 6.5 | 0.5 | 0 | Alemtuzimab |
| A3 | F | 42 | RRMS | 13 | 1.0 | 1.0 | 0 | 0 | Nataluzimab |
| A4 | F | 50 | RRMS | 9 | 2.5 | 2.0 | −0.5 | 1 | None |
| A5 | M | 59 | SPMS | 23 | 6.0 | 6.0 | 0 | 0 | None |
| A6 | M | 36 | RRMS | 6 | 1.0 | 1.0 | 0 | 1 | Dimethyl fumarate |
| A7 | F | 57 | RRMS | 18 | 1.0 | 1.0 | 0 | 1 | Fingolimod |
| A8 | M | 48 | RRMS | 12 | 7.0 | 7.0 | 0 | 0 | Nataluzimab |
| A9 | M | 53 | RRMS | 14 | 5.0 | Nataluzimab | |||
| A10 | M | 43 | SPMS | 13 | 5.0 | 5.0 | 0 | 0 | None |
| A11 | F | 29 | RRMS | 1 | 1.0 | 1.0 | 0 | 0 | None (interferon-β was discontinued 6 months before follow-up) |
| A12 | F | 51 | RRMS | 8 | 6.5 | 6.5 | 0 | 1 | Nataluzimab |
| A13 | F | 62 | SPMS | 24 | 6.0 | 6.0 | 0 | 0 | None |
| A14 | M | 56 | SPMS | 17 | 7.0 | 7.0 | 0 | 0 | None |
| A15 | F | 52 | RRMS | 6 | 2.0 | 1.5 | −0.5 | 0 | Alemtuzimab |
| A16 | F | 45 | RRMS | 28 | 4.0 | 4.0 | 0 | 0 | Alemtuzimab |
| A17 | F | 66 | SPMS | 17 | 6.5 | 7.5 | 1 | 0 | None |
| A18 | F | 53 | RRMS | 16 | 3.0 | 3.0 | 0 | 0 | None |
| A19 | F | 30 | RRMS | 6 | 4.0 | 5.5 | 1.5 | 1 | None (nataluzimab was discontinued 9 months before follow-up visit) |
| A20 | M | 36 | SPMS | 10 | 7.0 | 7.0 | 0 | 0 | None |
| A21 | M | 47 | SPMS | 11 | 7.0 | 8.0 | 1 | 0 | None |
| A22 | M | 39 | RRMS | 10 | 4.0 | Alemtuzimab | |||
| A23 | F | 45 | RRMS | 14 | 6.5 | Fingolimod | |||
| A24 | F | 64 | RRMS | 22 | 2.5 | 3.0 | 0.5 | 0 | Nataluzimab |
Relapses and EDSS change refer to the time between baseline and 1-year follow-up visits. Disease duration is the time between the manifestation of patient’s first symptoms and the date of MRI examination. The baseline characteristics of these patients have been described in a recent report (Datta et al., 2017). DMT = disease modifying treatment; F = female; M = male; MS = multiple sclerosis. Three patients (bold) were assessed only at the baseline, as described earlier (Datta et al., 2017) and were not included in the longitudinal follow-up of the cohort that is described in this report.
MRI scanning was performed at baseline and after 1 year and a PET scan was done at baseline only. The same scanner, MRI parameters, and clinical assessment protocols were employed for all participants and longitudinal comparisons.
EDSS and neurological assessment
The clinical history and physical examination, including assessment of EDSS, was completed by the same investigator (G.D.) on every patient at the screening visit and after 1 year at the time of follow-up MRI scanning. The first study visit, at which all the baseline scans were performed, took place within 6 weeks of the screening visit. None of the patients experienced clinical events between their screening and baseline scanning visits.
TSPO genotyping
TSPO genotype was assessed using a TaqMan based polymerase chain reaction (Applied Biosystems® QuantStudioTM 7) assay specific for the rs6971 polymorphism in the TSPO gene, as previously described (Owen et al., 2012). Participants having genotypes associated with low affinity binding were excluded, as they show negligible displaceable binding (Owen et al., 2012). For the baseline scans, there were 13 high affinity binders and 11 medium affinity binders.
MRI scanning
MRI scans were performed on a Siemens 3 T Trio scanner (Siemens Healthcare) equipped with a 32-channel phased-array head coil. Volumetric T1-weighted MPRAGE images were acquired for all patients using a 1 mm isotropic resolution 3D SPACE sequence (repetition time = 2300 ms, echo time = 2.98 ms, inversion time = 9.00 ms with 256 × 240 × 160 mm field of view), before and 5 min after intravenous gadolinium-chelate administration (0.2 ml/kg gadoteric acid, Dotarem®) (Jack et al., 2008). Volumetric T2-weighted FLAIR (fluid attenuated inversion recovery) images were acquired using a 1 mm isotropic resolution 3D SPACE sequence with a 250 × 250 × 160 mm field of view, echo time = 395 ms, repetition time = 5 s, inversion time = 1800 ms, turbo factor of 141, 256 × 256 × 160 matrix, and parallel imaging factor of 2.
PET scanning
PET scanning (Discovery RX PET/CT scanner) was performed with a transaxial resolution of 5.0 mm, and a radial resolution of 5.1 mm. PET data were reconstructed using filtered back projection including corrections for attenuation and scatter (based on a low-dose CT acquisition). The dynamic data were binned into 26 frames (durations of 8 × 15 s, 3 × 1 min, 5 × 2 min, 5 × 5 min, 5 × 10 min). 11C-PBR28 was injected as an intravenous bolus over ∼ 20 s at the start of a 90-min dynamic PET acquisition. Injected activities for 11C-PBR28 ranged from 223.8 to 379.6 MBq (335.1 ± 30.9 MBq, n = 24). Injected mass for different patients ranged from 1.48 to 8.91 μg (3.35 ± 1.96 μg).
Radioligand synthesis
Radiosynthesis and quality control was performed on site according to the method of Briard et al. (2008) with modification, as previously described, obtaining radiochemical purities of >95% (Briard et al., 2008).
MRI image and PET kinetic analyses
T2 FLAIR images were rigidly registered to T1 using FLIRT (FMRIB Software Library v5.0). White matter lesions were manually segmented on the registered T2 image using Jim software (Xinapse Systems v7). The white matter lesion mask was used for lesion filling the baseline and follow-up T1 images before segmentation into white matter, grey matter, cerebral cortex and CSF using the FSL tools FAST and FIRST (FMRIB Software Library v5.0) (Battaglini et al., 2012). Normalized brain volumes were calculated using SIENAX (Smith et al., 2002). For measurement of longitudinal changes in brain volumes, the MSmetrix method was used (Jain et al., 2015; Smeets et al., 2016). In brief, the baseline and follow-up T1 images were bias corrected, lesion filled, and skull stripped, followed by linear and a non-linear registration from baseline to follow-up and vice versa. Voxel-wise differences in volume from the non-linear registration were integrated over the whole brain and grey matter volumes to calculate the changes in volume over 1 year, as previously described (Smeets et al., 2016).
T2 hyperintense white matter lesions were segmented semi-automatically using a previously validated method (Jain et al., 2015). Subtraction of the lesion masks from the MRI scans acquired at baseline from that acquired after 1 year for each patient allowed new or enlarging lesion volumes to be determined. For this, a mask of NAWM was created by subtracting a white matter lesion mask dilated by 6 mm around its edges in 3D from the FAST segmentation of the total white matter and then eroding the resulting mask further by 3 mm (Lee et al., 1998).
The T1 image, NAWM mask and white matter lesion mask and dynamic PET images were used as inputs to the MIAKAT software package (www.miakat.org) for kinetic analysis of PET data. Using this software, PET images were corrected for patient motion using a frame-by-frame realignment algorithm and rigid registered to MNI (Montreal Neurological Institute) 2 mm space using SPM5 (Wellcome Trust Centre for Neuroimaging, http://www.fil.ion.ucl.ac.uk/spm) with a mutual information cost function. The Clinical Imaging Centre Neuroanatomical Atlas (Tziortzi et al., 2011) was non-linearly deformed into the individual’s space, via mapping of T1-weighted MRI data, to obtain a personalized anatomical parcellation of the brain. This parcellation was used to generate time–activity curves for regions of interest, including the thalamus, caudate, NAWM, white matter lesions and (voxel-wise) for whole brain.
In this graph, DVR is the regression slope and the intercept is int′.
Statistical analyses
Statistical analyses were performed using SPSS software (IBM, SPSS v22). For correlational analyses, the Spearman’s correlation coefficient (ρ) was calculated, unless otherwise stated. Descriptive statistics were reported as median and range, unless otherwise stated.
The proportional increase in volume from baseline T2 lesion volume was <10% for almost all patients with enlarging T2 lesions, so we considered a 5% increase in volume of enlarging T2 lesions as a significant outcome change in constructing a receiver operating characteristic (ROC) with white matter DVR as the discriminant.
Hierarchical linear regression was used to assess separately whole brain atrophy rate, overall T2 lesion volume change and enlarging T2 lesion volume. We evaluated four different 3-level hierarchical linear regression models:
Dependent variable of whole brain atrophy rate (% between baseline and follow-up scan) with EDSS, age and gender as covariates (level 1) and independent variables as NAWM DVR controlling for TSPO binding status (level 2) followed by baseline T2 lesion volume (level 3).
Dependent variable of overall T2 lesion volume change (ml between baseline and follow-up scan) with three levels as above.
Dependent variable of enlarging T2 lesion volume change (ml between baseline and follow-up scan) with three levels as above.
Dependent variable of enlarging T2 lesion volume change (ml between baseline and follow-up scan) with NAWM DVR controlling for TSPO binding status (level 1), NAWM MTR (level 2) and baseline T2 lesion volume (level 3).
For all models, the coefficient of determination (R2) was reported for level 1. For each level thereafter (levels 2 and 3), the contribution of the next level independent of other levels for explaining variance in the dependent variable was reported as R2 change values. Where correlations were directly assessed and for post hoc analyses, a correction was made for multiple comparisons (Bonferroni method). A P-value of <0.05 was considered significant for all statistical tests. ROC plots were used to assess the accuracy of classifications using the models.
Results
Twenty-four multiple sclerosis patients initially underwent 11C-PBR28 PET scanning and MRI at baseline (17 RRMS and seven SPMS). Clinical characteristics of the participants are summarized in Table 1. 11C-PBR28 PET imaging characteristics of their white matter and of individual lesions are described relative to white matter of matched, healthy volunteers in a recent paper (Datta et al., 2017). Illustrative images are shown in Fig. 1. One patient from this group was lost to follow-up (Patient A23), one withdrew consent (Patient A9) and one declined scanning because of discomfort from side effects of treatment with alemtuzimab (Patient A22). Twenty-one patients had a follow-up MRI ∼1 year (median 12 months, range 11–14 months) after the baseline scanning. Of the 21 patients included in the longitudinal analysis (eight males; median age 48 years, range 22–66 years), seven had a diagnosis of SPMS and 14 of RRMS. The median baseline EDSS was 4.0 (range, 1.0–7.0) and median disease duration was 13 years (range, 1–28 years). Seven patients had a relapse between their baseline and follow-up scans (median 0 relapses/year, range 0–1 relapses/year). The EDSS at follow-up did not change in 16 of the 21 patients (EDSS change: median 0.0, mean 0.2, range 0.0–2.0).
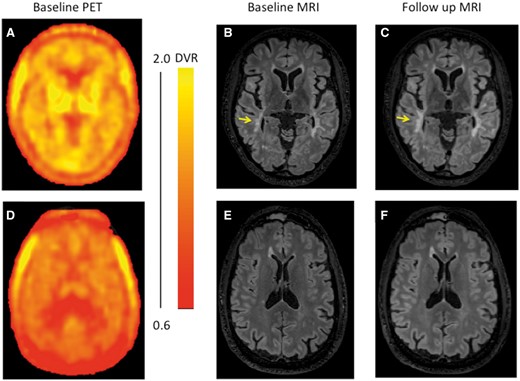
Illustrative PET and MRI images. Illustrative parametric brain PET 11C-PBR28 DVR images at baseline (A and D) from two patients with associated T2 FLAIR images at baseline (B and E) and after ∼1 year (C and F). The top panels (A–C) are from a patient (EDSS 4.0) with high average NAWM DVR (1.35) (Patient A19 in Table 1). The yellow arrowhead highlights a lesion that enlarged over the observation interval. The bottom panels (D–F) include images from a patient (EDSS 6.0) with low average NAWM DVR (0.88) for whom no enlarging T2 lesions were found between the baseline (E) and follow-up (F) MRI scans (Patient A5 in Table 1). The colour bar to the right of the PET images shows the dynamic range of DVR in the images (A and D).
11C-PBR28 distribution volume ratio measures predict subsequent radiological progression of disease
Baseline TSPO PET DVR measures from T2 hyperintense lesions, the NAWM and grey matter and changes in T2 lesions and whole brain or grey matter volume over 1 year were assessed for each patient. The baseline NAWM DVR and the MRI volume measures at baseline and longitudinally are summarized in Table 2. NAWM and white matter lesion DVR were positively correlated with enlarging T2 lesion volume (ρ = 0.59, P = 0.01; ρ = 0.64, P = 0.004, respectively) over the subsequent 1 year. A post hoc analysis suggested that this relationship was specific for the subgroup of patients with RRMS, who showed strong relationships between both baseline NAWM and white matter lesion DVR and enlarging T2 lesion volumes (ρ = 0.74, P = 0.008; ρ = 0.64, P = 10−3, respectively) (Fig. 2A). By contrast, we did not find the associations between either the enlarging T2 lesion volume and NAWM DVR (ρ = −0.05, P = 0.91) or white matter lesion DVR (ρ = −0.41, P = 0.36) in the subgroup of SPMS patients. However, correlations were observed in the SPMS patients between white matter lesion DVR and both subsequent changes in whole brain (ρ = 0.86, P = 0.04) and grey matter (ρ = 0.96, P = 5 × 10⁻⁴) volumes (Fig. 2B). A trend towards correlation between NAWM DVR and whole brain volume change over the subsequent 1 year was also found in the SPMS patients (ρ = 0.71, P = 0.07) as part of this post hoc exploratory analysis, although it did not reach statistical significance. A similar analysis for the RRMS group did not identify associations between DVR and either whole brain or grey matter volume changes.
MRI brain volume characteristics of individual multiple sclerosis patients
| Patient | 11C-PBR28 NAWM DVR | Baseline WBV (cm3) | Follow-up WBV (cm3) | WBV change (%) | Baseline GMV (cm3) | Follow-up GMV (cm3) | GMV change (%) | Baseline T2 WML volume (ml) | T2 WML volume change (ml) | Enlarging T2 WML volume change (ml) |
|---|---|---|---|---|---|---|---|---|---|---|
| A1 | 0.80 | 1505 | 1493 | −0.85 | 910 | 906 | −1.2 | 4.6 | −0.1 | 0.2 |
| A2 | 0.81 | 1529 | 1537 | 0.56 | 901 | 902 | 0.71 | 1.5 | 0.0 | 0.2 |
| A3 | 0.82 | 1544 | 1531 | −0.3 | 926 | 915 | −0.14 | 5.4 | −0.1 | 0.1 |
| A4 | 0.87 | 1489 | 1485 | 0.16 | 917 | 907 | −0.19 | 2.2 | −0.1 | 0.1 |
| A5 | 0.88 | 1422 | 1407 | −0.16 | 842 | 831 | −0.5 | 6.2 | −0.3 | 0.3 |
| A6 | 0.94 | 1500 | 1505 | 0.5 | 940 | 937 | 0.72 | 6.1 | −0.2 | 0.1 |
| A7 | 0.97 | 1467 | 1465 | −0.52 | 898 | 894 | −0.6 | 2.0 | −0.1 | 0.0 |
| A8 | 1.03 | 1408 | 1410 | 0.57 | 865 | 859 | 0.38 | 14.9 | 0.2 | 0.3 |
| A9 | 1.07 | 1403 | 838 | 23.4 | ||||||
| A10 | 1.07 | 1448 | 1433 | 0.11 | 849 | 839 | 0.13 | 9.8 | −0.3 | 0.4 |
| A11 | 1.08 | 1524 | 1513 | −0.13 | 922 | 914 | −0.18 | 8.2 | −0.9 | 0.5 |
| A12 | 1.09 | 1399 | 1412 | −0.78 | 871 | 878 | −1.21 | 4.7 | −0.4 | 0.1 |
| A13 | 1.11 | 1388 | 1390 | −0.21 | 832 | 830 | 0.09 | 8.0 | −0.2 | 0.6 |
| A14 | 1.12 | 1395 | 1392 | 0.21 | 862 | 850 | 0.19 | 5.8 | −0.2 | 0.2 |
| A15 | 1.16 | 1477 | 1478 | 0.21 | 859 | 856 | −0.05 | 13.8 | −1.2 | 0.7 |
| A16 | 1.20 | 1424 | 1417 | −0.12 | 873 | 866 | 0.11 | 29.5 | −1.9 | 2.8 |
| A17 | 1.29 | 1390 | 1372 | 0.02 | 820 | 805 | −0.28 | 36.7 | 2.2 | 2.3 |
| A18 | 1.32 | 1431 | 1426 | −0.5 | 899 | 888 | −0.8 | 15.4 | −0.7 | 0.8 |
| A19 | 1.35 | 1383 | 1366 | −1.39 | 843 | 838 | −0.68 | 26.7 | 0.6 | 1.6 |
| A20 | 1.38 | 1337 | 1370 | 1.45 | 838 | 860 | 2.44 | 20.6 | −0.6 | 0.1 |
| A21 | 1.51 | 1341 | 1343 | 0.5 | 803 | 821 | 1.88 | 8.3 | 0.2 | 0.4 |
| A22 | 1.67 | 1361 | 842 | 38.1 | ||||||
| A23 | 1.68 | 1440 | 903 | 2.3 | ||||||
| A24 | 1.85 | 1251 | 1246 | −0.61 | 790 | 789 | −0.52 | 36.6 | 0.5 | 3.4 |
GMV = grey matter volume (normalized); T2 WML = T2-weighted white matter lesions; WBV = whole brain volume (normalized). Three patients (bold) were assessed only at the baseline, as described earlier (Datta et al., 2017) and were not included in the longitudinal follow-up of the cohort that is described in this report.
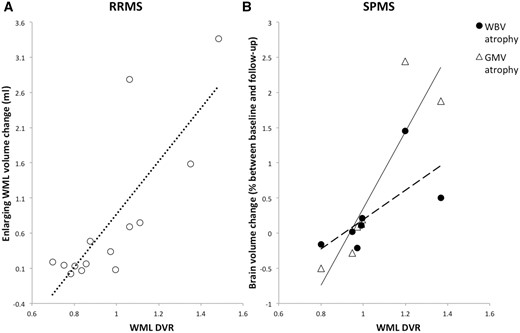
Disease progression measures and baseline radioligand DVR in lesions. Plots of T2 white matter lesions (WML) 11C-PBR28 DVR against (A) enlarging T2 white matter lesion volume change in patients with RRMS and (B) either normalized whole brain volume (WBV) atrophy rate or grey matter volume (GMV) atrophy rate in SPMS. The dotted line (A) is the best fit line for the RRMS patients (Spearman’s ρ = 0.64, P = 10−3). The unbroken regression line is for GMV atrophy (ρ = 0.96, P = 5 × 10⁻⁴) and the dashed line is for whole brain volume atrophy (ρ = 0.86, P = 0.04) in SPMS patients (B).
NAWM and white matter lesion DVR at baseline were not associated with total T2 lesion volume changes (the mean of contributions from both enlarging and shrinking lesions) between baseline and follow-up (Spearman’s ρ = −0.08, P = 0.75 and ρ = −0.01, P = 0.95, respectively), nor were there significant associations between DVR and the total T2 lesion volume change in either the RRMS or SPMS subgroups. We also did not find evidence for associations between NAWM and white matter lesion DVR at baseline and subsequent changes in whole brain (ρ = −0.006; ρ = 0.98; ρ = 0.08; ρ = 0.74, respectively) or total grey matter (ρ = 0.07; ρ = 0.78; ρ = 0.15; ρ = 0.51, respectively) volumes for the group of multiple sclerosis patients as a whole.
Stratifying patients for enlarging T2 lesion activity using baseline NAWM 11C-PBR28 distribution volume ratio
We explored whether differences in NAWM DVR at baseline could be used to stratify patients at higher risk of enlarging T2 lesion volumes over the subsequent year. We estimated the optimal NAWM DVR discriminating higher and lower risk of enlarging T2 lesion volume by constructing a ROC curve with NAWM DVR as the test variable. The discriminant value of baseline NAWM DVR that best discriminated between patients with an enlarging, rather than a decreasing or stable, T2 lesion volume was determined: NAWM DVR cut-off of 1.10 maximized specificity (67%) and sensitivity (67%) for discriminating a >5% increase. With this discriminant, there was an approximately 30% greater relative increase in enlarging T2 hyperintense volumes in the higher (median 4.8 ml, range 1.1–10.6 ml) than in the lower (median 6.8 ml, range 0.7–9.6 ml) NAWM DVR subgroup (P = 0.04, Mann-Whitney test) (Fig. 3).
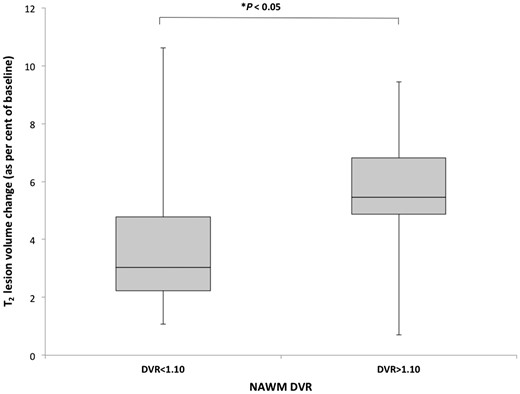
T2 lesion volume change and baseline NAWM DVR. Boxplot of the enlarging T2 white matter lesion volume over 1 year of follow-up of the multiple sclerosis patients stratified by low (<1.10) and high (>1.10) 11C-PBR28 DVR in the NAWM at baseline (P = 0.04).
Multivariate models predicting subsequent changes in MRI measures of disease progression
We explored models predicting future disease activity based on demographic, clinical and MRI data, as well as PET measures at baseline. We initially modelled the whole brain volume change between the baseline and follow-up MRI scans as a function of EDSS, age and gender (R2 = 0.48, P = 0.01). Neither the baseline NAWM DVR (controlling for TSPO binding status) nor the baseline T2 lesion volume improved the main model (R2 change = 0.09, P = 0.26 and R2 change < 0.01, P = 0.97, respectively). Overall T2 lesion volume change was not predicted by either the main model with variables EDSS, age, gender (P = 0.68) or any of the subsequent levels of the hierarchical model described in the ‘Materials and methods’ section (R2 change = 0.02, P = 0.87).
We then explored models of the enlarging T2 lesion volume. EDSS, age and gender alone did not predict future enlarging T2 lesion volume well (R2 = 0.33, P = 0.14). Including the baseline NAWM DVR added significant explanatory power to the model (R2 change = 0.37, P = 0.004). A hierarchical regression model with the first level as NAWM DVR accounted for ∼ 50% of the variance in enlarging T2 lesion volumes (R2 = 0.46, P = 0.001). We additionally explored inclusion of the baseline T2 lesion volume (R2 change = 0.30, P = 5 × 10⁻⁶) and NAWM MTR (R2 change = 0.12, P = 0.04) and found that it improved the model prediction.
Correlations between baseline 11C-PBR28 distribution volume ratio and MRI measures of disease burden
To place these longitudinal observations in context, we tested for correlations between the 11C-PBR28 DVR and MRI measures of disease burden at baseline, extending our previous observations (Datta et al., 2017). Both NAWM and white matter lesion DVR were positively correlated with the baseline T2 lesion volume (ρ = 0.49, P = 0.03 and ρ = 0.63, P = 0.002, respectively). The baseline NAWM MTR was negatively correlated with NAWM DVR (ρ = −0.69, P = 8 × 10⁻⁴). NAWM and white matter lesion DVR were negatively correlated with baseline whole brain volume (ρ = −0.81, P = 4 × 10⁻⁵ and ρ = −0.74, P = 4 × 10⁻⁴, respectively). NAWM DVR was correlated with baseline normalized grey matter volume (ρ = −0.56, P = 0.02) (Fig. 4), but we did not find a statistically significant association between white matter lesion DVR and grey matter volume at baseline (ρ = −0.49, P = 0.08).
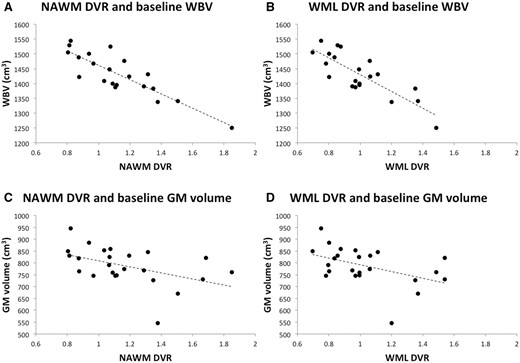
Baseline brain volumes and white matter white matter DVR. At baseline, the white matter 11C-PBR28 DVRs are correlated with MRI whole brain and grey matter volumes. (A) NAWM DVR against baseline whole brain volume (WBV) (Spearman’s ρ = −0.81, P = 4 × 10⁻⁵). (B) White matter lesions (WML) DVR against baseline whole brain volume (ρ = −0.74, P = 4 × 10⁻⁴). (C) NAWM DVR against baseline grey matter (GM) volume (ρ = −0.56, P = 0.02). (D) White matter lesion DVR against baseline grey matter volume (ρ = −0.42, P = 0.08).
We also tested for relationships between 11C-PBR28 DVR inflammatory measures across tissue compartments in the PET scan conducted at baseline. NAWM DVR was correlated strongly with the mean DVR of T2 white matter lesions (Spearman’s ρ = 0.92, P = 3 × 10⁻¹⁰) and the mean cortical (ρ = 0.93, P = 1 × 10⁻¹⁰) and thalamic (ρ = 0.79, P = 1 × 10⁻⁵) DVR (Fig. 5).
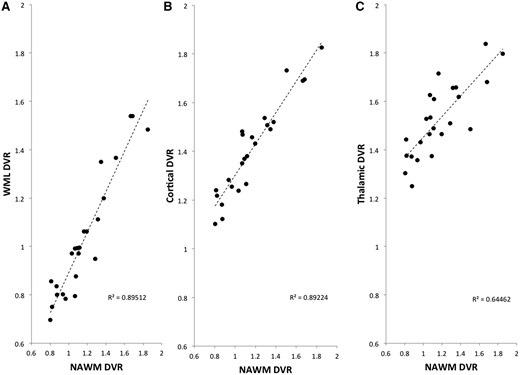
Correlations in radioligand DVR across brain tissues. Plots of NAWM 11C-PBR28 DVR against (A) T2 white matter lesion (WML) DVR (Spearman’s ρ = 0.92, P = 10−10), (B) cortical DVR (ρ = 0.93, P = 4 × 10⁻¹¹) and (C) thalamic DVR (ρ = 0.79, P = 4 × 10⁻⁶).
Discussion
We investigated in vivo glial activation in the white matter of multiple sclerosis patients using the second generation TSPO ligand, 11C-PBR28, and its relationship to subsequent changes in MRI over 1 year. We found that the 11C-PBR28 DVR in NAWM was highly correlated with DVR in T2 white matter lesions, whole cortex and the thalamus. NAWM and white matter lesion DVR were correlated with T2 lesion volume and whole brain volume at baseline. Enlarging T2 lesions and brain atrophy rates have prognostic significance for development of disability progression in multiple sclerosis (Sormani et al., 2014). We found that the white matter 11C-PBR28 DVR at baseline was correlated with the subsequent enlarging T2 lesion volume. A model including baseline NAWM DVR and NAWM MTR significantly improved prediction of future disease activity (enlarging T2 lesion volume) over the subsequent year relative to that estimated using only clinical and conventional MRI measures.
We found that patients with a higher level of glial activation in the NAWM had increased microglial activation in white matter lesions and grey matter volumes. While post-mortem studies have found only a weak correlation between white matter and grey matter lesion volumes, these studies have not addressed the innate immune activation accompanying them (Calabrese et al., 2015). They also have not included consideration of the potentially extensive, dynamically evolving meningeal inflammation (Lucchinetti et al., 2011; Popescu and Lucchinetti, 2012; Absinta et al., 2015). Previous in vivo TSPO PET studies have found evidence for diffuse glial activation in grey and white matter of multiple sclerosis patients, relative to healthy controls (Filippi et al., 2012; Politis et al., 2012; Colasanti et al., 2014; Rissanen et al., 2014; Giannetti et al., 2015; Datta et al., 2016, 2017). Common genetic and environmental factors may contribute to the expression of brain inflammation throughout the brain and, through this, to disease progression (Zivadinov et al., 2009; Mowry et al., 2012; Gourraud et al., 2013). The strong correlations in innate immune activation across brain tissue compartments defined by TSPO radioligand binding suggest that it may be most useful to consider CNS-wide immune activation for understanding individual differences in disease severity or progression, rather than that in any single tissue compartment (either white or grey matter).
We found correlations between baseline whole brain volume and T2 lesion load with both the 11C-PBR28 DVR in NAWM and in white matter T2 lesions. A previous TSPO PET study reported correlations of NAWM TSPO ligand binding with baseline brain volume measures in SPMS (Versijpt et al., 2005). This and related associations identified in cross-sectional studies have been interpreted to suggest that the diffuse microglial activation either contributes causally or reflects a response to neuroaxonal loss. With a longitudinal design, we were able to investigate the associations between microglial activation and measures of inflammatory activity and neuroaxonal loss more directly. We found that a measure of higher levels of microglial activation was associated with a greater volume of subsequently enlarging lesions in the RRMS subgroup. By contrast, in the subgroup of patients with SPMS, microglial activation was associated not with enlarging T2 hyperintense lesions in the white matter, but with greater subsequent brain atrophy. A limitation of our study is that it was not powered to assess the multivariate hierarchical regression models separately for subgroups of RRMS and SPMS patients. These associations also suggest that innate immune activation contributes to future inflammatory neurodegeneration, but do not rule out the possibility that the association is a ‘response’ to neurodegeneration, rather than a ‘cause’. To test this confidently, longitudinal assessment of responses to an intervention that selectively modulates the diffuse microglial activation is needed.
Nonetheless, there is evidence that some or all of the microglial activation measured here is contributing to neurodegeneration. Activated nodules of microglia have been detected in extra-lesional white matter both in association with demyelinating axons and in the absence of myelin loss (van Horssen et al., 2012; Singh et al., 2013). Preclinical studies support a role for microglial activation being pro-inflammatory in multiple sclerosis and contributing to neurodegeneration (Duffy et al., 2014). Previous work suggested that white matter MTR, as a sensitive in vivo marker of neurodegeneration (combined neuro-axonal loss and demyelination), predicts future disease progression (Agosta et al., 2006). We found that 11C-PBR28 NAWM DVR was negatively correlated with NAWM MTR. We had observed this also in a previous study using another second generation TSPO ligand (18F-PBR111), which showed higher TSPO binding in the NAWM with lower MTR (Colasanti et al., 2014).
Short-term disability progression is predicted well by a combination of the whole brain atrophy rate and the numbers of new and enlarging T2 lesions over 6–12 months (Popescu et al., 2013; Sormani et al., 2014). Here we constructed a model for prediction of future disease activity based on NAWM DVR, NAWM MTR and T2 lesion volumes measured at a single time point. This model explained over 90% of the variance in enlarging lesion volumes over the subsequent 1 year. This is consistent with the hypothesized association between diffuse innate immune activation in white matter and new T2 lesions and histopathological interpretations of white matter lesions having prominent microglial activation at their edges as enlarging lesions (Lucchinetti et al., 2004; Filippi et al., 2012).
There are limitations to our study. First, feasibility limited the number of patients. Our study also included a mixed population of multiple sclerosis patients (many of who were receiving disease modifying treatments) with a follow-up of ∼1 year. The group of RRMS patients was heterogenous (EDSS from 1 to 7 and disease duration from 1 to 28 years). With the smaller population size and short duration of follow-up, we did not detect any new T2 lesions, there were few relapses and little overall EDSS change across the group. This is not uncommon with relatively short follow-up periods for patients on treatment (Goldman et al., 2010). We did not attempt to directly assess relationships between microglial activation and the appearance of new lesions in the grey matter, as 3-T MRI appears relatively insensitive to cortical lesions (Geurts et al., 2005; Klaver et al., 2013). This question may be better addressed in the future using ultra-high MRI (Klaver et al., 2013). We also did not compare the longitudinal changes in brain volumes between patients with multiple sclerosis and well-matched healthy volunteers, although it is well established that regional and global brain atrophy rates are greater in patients with multiple sclerosis than healthy people (Barkhof et al., 2009). A future study including healthy volunteers or an appropriate healthy, historical comparator group would enhance the clinical meaningful of observations by testing directly whether increased microglial activation is associated with rates of brain atrophy in patients that are significantly greater than in a matched healthy control group. Finally, our conclusions regarding differential responses in the subgroups with RRMS and SPMS were based on post hoc analyses. TSPO PET studies including larger numbers of progressive multiple sclerosis patients and patients of longer duration are needed. Further analysis focusing on individual lesional 11C-PBR28 DVR and MTR could provide insights into how microglial activation relates to future changes in the balance of remyelination and demyelination within individual lesion volumes.
Available neuropathology and a recent combined magnetic resonance spectroscopic and TSPO PET study suggest that microglial activation likely makes the dominant contribution to the higher TSPO PET signal in people with multiple sclerosis (Matthews and Datta, 2015; Datta et al., 2016). Our results demonstrate strong correlations between the diffuse glial activation measured by TSPO PET in white and grey matter, despite the lack of a strong association between focal lesional activity in white and grey matter (Bo et al., 2007). While we cannot be confident of the mechanisms mediating the relationships observed, our results provide evidence that the microglial activation assessed by TSPO is meaningful clinically. Our study suggests that greater activation in the NAWM is a marker of greater risk of subsequent enlarging lesions in RRMS patients and, in patients with SPMS, greater future brain atrophy. Both of these imaging neuropathological changes are associated with disability progression.
Abbreviations
- DVR
distribution volume ratio
- EDSS
Expanded Disability Status Scale
- MTR
magnetization transfer ratio
- NAWM
normal appearing white matter
- RRMS
relapsing remitting multiple sclerosis
- SPMS
secondary progressive multiple sclerosis
Acknowledgements
We would like to thank ICOMETRIX for performing the longitudinal analyses of MRI brain volume and white matter lesion changes.
Funding
G.D. is grateful for support as a fellow through the Imperial Wellcome-GlaxoSmithKline Clinical Fellowship Training Scheme. P.M.M. acknowledges generous personal support from Edmond J Safra Foundation and Lily Safra and research funding through the Imperial Biomedical Research Centre, an NIHR Senior Investigator Award and the Medical Research Council. O.C. is supported by the National Institute for Health Research (NIHR) University College London Hospitals (UCLH) Biomedical Research Centre (BRC). We gratefully acknowledge the Wellcome Trust and GlaxoSmithKline for funding for this study provided through the Translational Medicine Training PhD Fellowship Grant.

