


Abstract
Variants in the AUTS2 gene are associated with a broad spectrum of neurological conditions characterized by intellectual disability, microcephaly, and congenital brain malformations. Here, we use a human cerebral organoid model to investigate the pathophysiology of a heterozygous de novo missense AUTS2 variant identified in a patient with multiple neurological impairments including primary microcephaly and profound intellectual disability.
Proband cerebral organoids exhibit reduced growth, deficits in neural progenitor cell (NPC) proliferation and disrupted NPC polarity within ventricular zone-like regions compared to control cerebral organoids. We used CRISPR-Cas9-mediated gene editing to correct this variant and demonstrate rescue of impaired organoid growth and NPC proliferative deficits. Single-cell RNA sequencing revealed a marked reduction of G1/S transition gene expression and alterations in WNT-β-catenin signalling within proband NPCs, uncovering a novel role for AUTS2 in NPCs during human cortical development.
Collectively, these results underscore the value of cerebral organoids to investigate molecular mechanisms underlying AUTS2 syndrome.
Introduction
The autism susceptibility candidate 2 (AUTS2) gene was first identified and found disrupted as a result of a balanced translocation event (t7; 20)1 in a pair of monozygotic twins with autism spectrum disorder (ASD). Subsequent clinical reports suggest pathological AUTS2 variants are more closely associated with intellectual disability rather than directly contributing to classical features associated with ASD. AUTS2 is a highly conserved gene that spans 1.2 Mb on chromosome 7q11.22 and is composed of 19 coding exons with a predicted full-length protein of 1259 amino acids (Fig. 1E). Biochemical studies have shown that AUTS2, in association with casein kinase 2 (CK2), form a polycomb repressive complex 1 (PRC1-AUTS2) that activates rather than represses transcription through recruitment of p300.2 There are several reported isoforms of AUTS2, including full-length and various C-terminal isoforms, that are expressed throughout brain development.3,4 Previous studies have shown deletions within the C-terminus isoform spanning exons 9–19 are associated with a severe neurocognitive phenotype.3,5 Other studies have demonstrated several C-terminal isoforms, which are expressed at internal transcriptional start sites in exons 6 and 9, have critical roles during neuronal differentiation.3,4,6
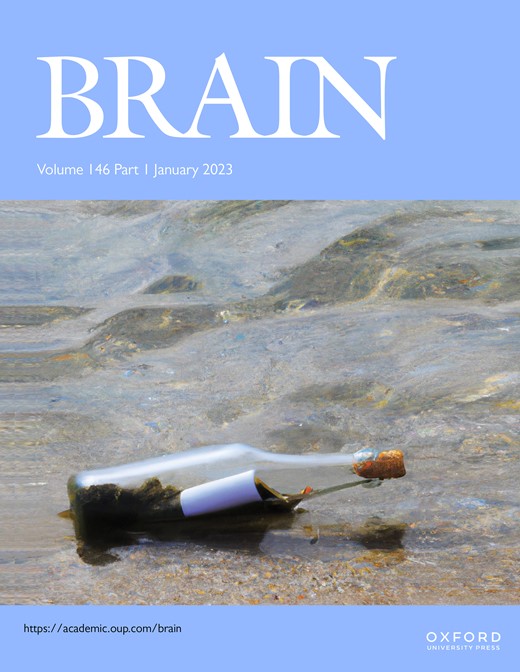
Identification of a de novo AUTS2 variant within a conserved histidine-rich domain. (A) Family pedigree. Circle: female; square: male; filled: affected. (B and C) MRI of affected individual showing reduced cortical area, ventriculomegaly (asterisk) and cerebellar atrophy (arrow). MRI images are arranged in sagittal and coronal planes, respectively. Scale bar = 2 cm. (D) Sanger-based DNA sequence chromatogram of the c.1600A>C AUTS2 variant in exon 9 in the affected patient and absent in her unaffected, healthy parents. (E) AUTS2 genomic organization showing disease-causing variants, key domains and exon structure of the AUTS2 gene. Pathogenic and likely pathogenic variants from the ClinVar database as of January 2021 are represented by circles and shaded according to variant classes. Proline-rich domains (PR1/PR2; containing nonsense and frameshift variants) and histidine-rich domains (H1/H2; containing predominately missense variants) were obtained from UniProt (entry Q8WXX7). The curated AUTS2 protein family domain from PFAM is denoted as AUTS2). Exon locations and numbering in the bottom panel reflect the canonical full-length transcript (NM_015570.4). (F) AUTS2 amino acid conservation within the H1 domain and spanning position 534 across multiple species. Arrow represents the AUTS2 T534P alteration in the affected patient.
AUTS2 variants are associated with a broad spectrum of clinical features, including low birth weight, feeding difficulties, intellectual disability, microcephaly, seizures, brain malformations and mild dysmorphic craniofacial features that are collectively known as AUTS2 syndrome.5AUTS2 variants are additionally associated with a host of other neurological conditions such as addiction disorders,7,8 epilepsy,9 schizophrenia,10,11 attention deficit hyperactivity disorder12 and dyslexia.13 The diverse disease manifestations of AUTS2 variants within the brain underscore the importance of elucidating its role in neurodevelopment.
Animal studies have demonstrated a putative role for AUTS2 in transcriptional activation, RNA metabolism14 and cytoskeletal regulation within the CNS.2,6Auts2 knockdown zebrafish models exhibit overall stunted growth compared to controls, with notable reductions in the forebrain, midbrain and cerebellum.3,15 Various rodent models of AUTS2 disruption show reductions in the cerebellum4,6,16 and dentate gyrus.14,17 However, these rodent models do not display a microcephalic phenotype, which has hampered our understanding of molecular mechanisms that cause human microcephaly in AUTS2 syndrome. The emergence of human-based model systems of the developing brain such as cerebral organoids (COs) has refined our understanding of the mechanisms controlling human cortical development. In particular, these model systems have revealed human-specific diversity in progenitor quiescence, architecture and subtypes that recapitulate morphological features of the developing human foetal cortex.18–21 Several studies modelling primary microcephaly using COs arising from variants in CDK5RAP2,22WDR6223 and NARS124 have uncovered important insights into disease mechanisms.25 Cumulatively, these reports show cellular deficits in cell cycle progression and cilia formation in apical neural progenitor cells (NPCs) concomitant with reduced cortical expansion in COs.22–24,26,27
Here we describe a human CO model to investigate the pathophysiology of a heterozygous de novo missense AUTS2T534P variant identified in a patient with several neurological impairments, including primary microcephaly and profound intellectual disability. Because the majority of all reported pathogenic/likely pathogenic missense variants cluster near our patient’s variant, we envisioned a CO model of the AUTS2T534P variant would allow us to explore disease mechanisms underlying AUTS2 syndrome. Our results demonstrate AUTS2T534P COs show an impaired growth trajectory compared to controls, which recapitulates the patient’s microcephaly and thus provides a novel model to investigate causal disease mechanisms. Further investigation of proband COs using immunofluorescence techniques revealed reduced NPC proliferation and irregular apical NPC polarity in neural rosettes. To validate whether the proband’s CO phenotypes are causal to the AUTS2T534P variant, we used CRISPR-Cas9 homology-directed repair to restore the wild-type sequence (c.1600C>A) and demonstrate phenotypic rescue of impaired organoid growth and proliferative deficits in NPCs compared to proband COs. Single-cell RNA sequencing (scRNA-seq) of proband COs showed an under-representation of progenitors enriched in expression of G1/S transition genes as well as dysregulated gene expression signatures associated with WNT-β-catenin signalling, which were rescued in gene-corrected (GC) control COs. Collectively, these results demonstrate a novel role for AUTS2 during early human cortical development within NPCs and emphasize the value of COs to uncover pathogenic mechanisms underlying AUTS2 syndrome.
Materials and methods
Subjects
The proband and both of her parents were enrolled as part of an Institutional Review Board (IRB) approved study (IRB:11-00215: Rare Diseases/Genome Sequencing) within the Steve and Cindy Rasmussen Institute for Genomic Medicine at Nationwide Children’s Hospital. Informed consent was provided for all study participants. Genomic analysis was performed on DNA isolated from either peripheral blood (proband and mother) or saliva (father).
Whole-genome sequencing and analysis
Whole-genome sequencing (WGS) was performed for the trio and induced pluripotent stem cell (iPSC) lines generated in this study (Supplementary Tables 1, 3 and 4) using an Illumina HiSeq4000 instrument according to manufacturer's protocols. Reads were mapped to the GRCh37 reference sequence, and secondary data analysis was performed using Churchill,28 which implements the GATK ‘best practices’ workflow for alignment, variant discovery and genotyping. Variants were called in all family members using GATK 4.0.5.1, and the resulting VCF file was annotated with genes, transcripts, function classes, damaging scores and population allele frequencies using an in-house pipeline built around the SNPeff annotation tool.29 Our general approach to variant annotation and prioritization has been previously described.30 After removing common variants (minor allele frequencies > 0.01 in the gnomAD v.2.1.1 database), we selected for further analysis all splice site, frameshift and nonsense variants, as well as missense variants predicted to be damaging by sorting intolerant from tolerant (score < 0.05), PolyPhen (score > 0.453), genomic evolutionary rate profiling (score > 2.0) or combined annotation dependent depletion (Phred score > 15). Because of the severe presentation and lack of a significant family history, we prioritized candidate de novo mutations consistent with dominant inheritance, but recessive and X-linked models were also considered. Genome-wide analyses of iPSCs were performed in three pairwise analyses: proband iPSCs versus proband blood, proband gene-corrected iPSCs versus proband blood and parental iPSCs versus parental blood. Somatic single nucleotide variants and indels were called using MuTect2 (PMID: 23396013); variants that passed all MuTect filters were visually reviewed in all BAM files using Integrative Genomics Viewer (IGV) (PMID: 21221095). We required at least four high-quality variant-supporting reads (with both strands represented) and >10× coverage in all samples to pass a variant. Review-passed variants were annotated with population allele frequency data and gene transcript information using VarHouse as described above. Only non-synonymous coding variants and splice region variants were reported. Somatic copy number variants (CNVs) were called using VarScan (PMIDs: 22300766 and 25553206) v2.4.4 with parameters: –min-coverage 10 –min-segment-size 500 –max-segment-size 1000. Log2 value thresholds of >0.40 for gains <−0.40 for losses were applied, and all calls were visually reviewed via R plotting. Only CNVs with num.mark > 30 that overlapped at least one protein-coding exon were reported.
Cerebral organoid culture
IPSC cell line generation and quality control testing
Peripheral blood mononuclear cells (PBMCs) were reprogrammed to human iPSCs (hiPSCs) using the CytoTune-iPS 2.0 Sendai Reprogramming Kit (ThermoFisher) according to manufacturer’s instructions. All hiPSC lines used in this assay were rigorously tested for pluripotency markers, tested negative for mycoplasma, underwent WGS and underwent short tandem repeat (STR) profiling analysis (LabCorp) to authenticate purity of cell lines. In addition, all hiPSC lines were tested for live alkaline phosphatase activity using the Alkaline Phosphatase Live Stain kit (Thermofisher) according to manufacturer’s instructions.
MTT assay
Cell viability between different iPSC lines was tested by employing the MTT Assay (ATCC 30-1010K) following the manufacturer’s instructions. Briefly, 25 × 103, 50 × 103, 75 × 103 and 100 × 103 cells were seeded per well in a 96-well plate along and left to adhere for 24 h. After incubation, 10 μl MTT [3-(4,5-dimethyl thiazol-2-yl)-2,5-diphenyl tetrazolium bromide] reagent was added per well, including negative control wells containing only cell media. The plates were incubated for 2 h at 37°C. After confirming appearance of purple precipitate, 100 μl of the Detergent Reagent was added per well and left overnight in the dark at room temperature. The absorbance in each well was measured at 570 nm using a Spectramax (Molecular Devices) plate reader.
IPSC culture maintenance
All lines were maintained under feeder-free and defined, serum-free medium conditions. IPSCs were cultured in either mTeSR (StemCell Technologies) or Essential 8™ Medium (ThermoFisher) and passaged on vitronectin-coated tissue culture plates using standard methods.
CO generation
All media formulations for CO generation are described in Supplementary Table 7. The initial cohorts of whole brain COs used in Figs 2 and 3 were generated according to our previously described protocol.31 CO culture media were exchanged every third day. An adapted whole-brain CO generation protocol was used for subsequent analyses in Figs 4–7, which was optimized to increase CO reproducibility. In this CO protocol, iPSC lines were thawed from cryopreservation and passaged a minimum of one time and maintained in culture for at least 7 days. IPSCs at 65–85% confluency were pretreated with 5 µM Y-27632 ROCK inhibitor for 1 h and then processed into single cells with TrypLE dissociation reagent (ThermoFisher). Cells were then resuspended in iPSC media supplemented with 5 µM ROCK inhibitor at a concentration of 40 cells/µl. Then, 100 µl of the suspension was transferred into each well (4000 cells/well) of a non-tissue culture treated U-bottom 96-well plate. The plates were then balanced and centrifuged at 400g for 4 min. Although the embryoid bodies (EBs) began to noticeably form within a few hours of seeding, plates were left undisturbed for 72 h for optimal EB formation. After EB formation, media and unincorporated cells were aspirated from each well and replaced with 150 µl of fresh neural induction medium (NIM). The NIM was replaced every other day until Day 10. On Day 10, EBs were transferred to a larger plate format (10 cm2 untreated dishes) with cerebral organoid expansion medium (COEM) + 2% Matrigel and placed on an orbital shaker. Then, 72 h later, the COEM was removed and replaced with cerebral organoid growth and differentiation medium (COGDM) + 1% Matrigel. Organoids received fresh COGDM three times per week for the remainder of their time in culture. All media formulations were prepared according to our previous studies.31
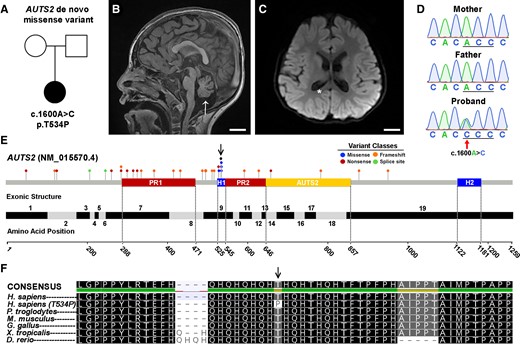
AUTS2T534P patient COs show reduced growth and proliferative deficits. (A) Overview of protocol used to generate COs. Briefly, PBMCs were isolated from patient and control blood samples and underwent Sendai virus transduction with Yamanaka factors (OCT3/4, SOX2, KLF4, c-MYC) to produce iPSCs. These cultures were characterized and then used to generate COs through undirected, spontaneous differentiation. A was created with BioRender.com. (B and C) Representative images of parental control COs and proband COs at Day 34 showing a significant growth reduction in proband COs. Scale bar = 1 mm. (D) Growth trajectory analysis of parental control and proband COs from Days 16 to 37 in CO development. (E and F) Parental control COs show proliferating neural progenitors identified as EdU+ and phospho-Histone H3+ (pHH3; mitosis marker) compared to proband COs, which show a reduction (quantified in G and H). Scale bar = 50 µm. DAPI was used to stain all nuclei (shown in blue). All data are shown as the mean ± standard deviation (SD). Statistical analyses in D were performed using Mann–Whitney U-tests and those in G and H were performed using one-way ANOVA with Tukey’s multiple comparisons test (n = 4 independent organoids per group and two independent experiments performed). Statistically significant differences between parental control and proband COs were observed between groups commencing at Day 20. *P ≤ 0.05; **P ≤ 0.01; ***P ≤ 0.001; ****P ≤ 0.0001.
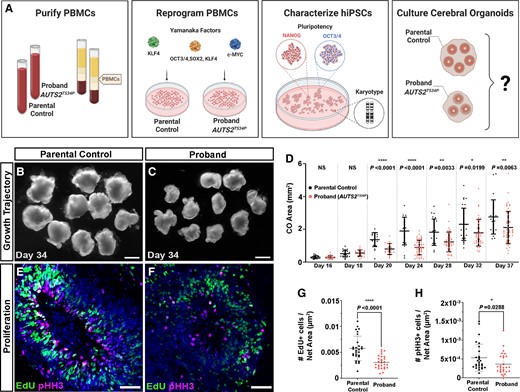
AUTS2T534P patient COs show functional and molecular deficits in NPCs. (A) The fate of neural progenitor daughter cells correlates with their mitotic division class. Symmetric divisions (top) give rise to two daughter apical progenitors whereas asymmetric divisions (bottom) give rise to a single apical progenitor and one mature cell type (intermediate progenitor or neuron). A was created with BioRender.com. (B and C) Representative mitotic divisions at the apical surface of parental control and proband rosettes of COs. The division class is determined by the acute angle, θa, that forms between the cleavage plane (defined by TPX2+ mitotic poles) and the apical surface (marked by ZO1, membrane protein seen as a mostly continuous cell layer). NPCs are stained for SOX2. Scale bar = 50 and 10 µm for lower and higher magnification images, respectively. (D) Asymmetric oblique and vertical divisions are overrepresented in proband COs (65%) compared to parental control COs (36%). (E and F) Acetylated tubulin (AcTub) staining reveals normal rosette microtubular organization within parental control COs, but severely disrupted organization in proband COs (G and H). Scale bar = 250 µm. (I) SOX2+ neural progenitors within rosettes of parental control COs form robust, uniform ARLB13B+ cilia at the apical surface (central ring-like structure), whereas those within rosettes of proband COs show shortened and irregular arrangement (J). Scale bar = 10 µm. (K) Proband cilia show a statistically significant reduction in length compared to parental control cilia. All data are shown as the mean ± SD. Statistical analysis of cilia quantification data was performed using an unpaired t-test (n = 540 parental control cilia and n = 191 proband cilia quantified across four independent organoids per group and one independent experiment performed). ****P ≤ 0.0001.
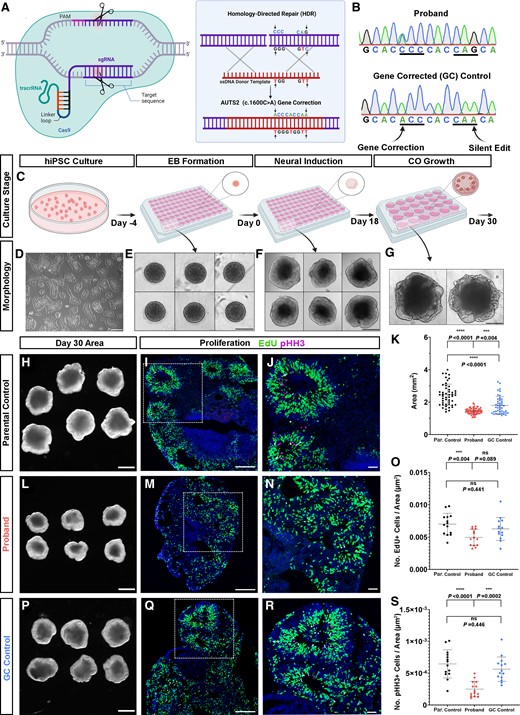
AUTS2T534P gene editing with CRISPR-Cas9 rescues proband COs phenotypes. (A) CRISPR-Cas9-mediated homology-directed repair gene correction strategy. (B) Chromatogram generated by Sanger sequencing of affected patient (AUTS2 c.1600A>C, proband) and GC hiPSC line. First arrow denotes the C>A base pair change at c.1600 and the second arrow denotes the silent gene edit (G>A) at c.1608. (C–G) Schematic showing major steps in an optimized protocol to generate reproducible COs from hiPSCs with representative culture phase contrast microscopic images below each step. Scale bar = 200 and 500 µm for D and E–G, respectively. A and C were created with BioRender.com. (H, L and P) Representative images of parental control, proband and GC control COs at Day 30, cross-sectional area of each CO group quantified in K. (I, M and Q) Decreased percentage of EdU+ and phospho-Histone H3+ (pHH3; magenta, mitosis marker) progenitors in proband CO rosettes compared to parental and GC controls. Scale bar = 200 µm. Magnified in J, N and R, scale bar = 50 µm; quantified in O and S. All data are shown as the mean ± SD. Statistical analyses were performed using one-way ANOVA with Tukey’s multiple comparisons test (n = 14 rosettes quantified across a minimum of four independent organoids per group and one independent experiment performed). ***P ≤ 0.001; ****P ≤ 0.0001; ns = not significant.
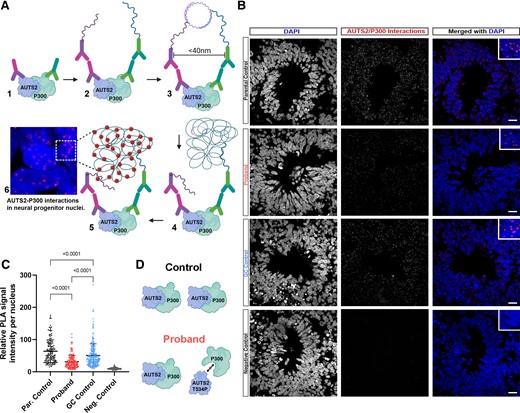
The AUTS2 T534P variant disrupts interaction with P300. (A) Schematic of Duolink proximity ligation assay (PLA) depicting detection of AUTS2 interacting with P300. (B) Representative images of CO rosettes with nuclear staining shown in the first column (DAPI), PLA signal (demonstrating AUTS2-P300 interaction) in the second column, and merged DAPI and PLA signal in the third column. (C) Quantification of the PLA intensity per nucleus. (D) Model showing the results from the Duolink PLA assay in which AUTS2-P300 interaction is disrupted in the proband, leading to the decreased PLA signal intensity per nucleus. All data are shown as the mean ± SD. Statistical analyses were performed using one-way ANOVA with Tukey’s multiple comparisons test (n = a minimum of 150 nuclei quantified across at least three rosettes per group).
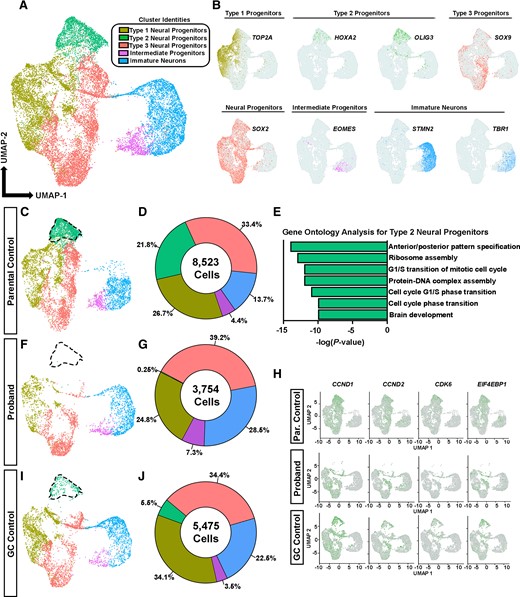
Single-cell RNA sequencing reveals an under-represented population of proliferative NPCs in proband COs. (A) UMAP plot of key cell types organized into five major clusters: Intermediate progenitors, immature neurons and three classes of NPCs containing 17 752 cells. (B) Select canonical markers used to determine cluster identities. MKI67 and TOP2A show enriched expression within type 1 NPCs, HOXA2 and OLIG3 show enriched expression in type 2 neural progenitor cells and SOX9 shows enriched expression in type 3 NPCs; SOX2 is a pan-progenitor marker; EOMES (TBR2) labels intermediate progenitors; STMN2 and TBR1 label immature neurons. (C, F and I) UMAP plots of cells from parental control COs (8523 cells), proband COs (3754 cells) and GC control COs (5475 cells). Type 2 neural progenitors are outlined in each plot to highlight their under-representation in proband COs. (D, G and J) Percentages of cell types per group. (E) GO terms identified in type 2 neural progenitors enriched for genes associated with G1/S cell cycle phase transition (source: Metascape). (H) Feature plots showing expression of G1/S cell cycle genes in proband and GC control COs.
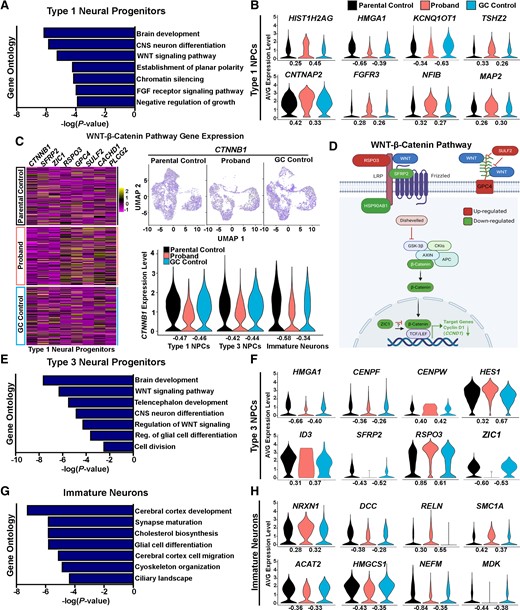
Deficits in WNT-β-catenin pathway gene expression in AUTS2 patient COs. (A) GO terms identified in type 1 neural progenitors enriched for genes associated with the WNT-β-catenin signalling among others. (B) Violin plots of DEGs in type 1 neural progenitors shows chromatin-modifying genes: HIST1H2AG, KCNQ1OT1 and HMGA1; transcriptional regulator cortical layer 5 gene, TSHZ2, identified as an AUTS2 target gene; and genes associated with neural and glial differentiation: FGFR3, NFIB, MAP2; and cell adhesion: CNTNAP2, also identified as an AUTS2 target gene. (C) Heat maps of type 1 neural progenitor DEGs in proband and control COs show alterations in gene expression associated with WNT-β-catenin signalling. Feature and violin plots of CTNNB1 gene expression in types 1 and 3 neural progenitors, and immature neurons shows reduced expression in proband COs compared to controls. (D) Schematic showing the WNT-β-catenin pathway and colour-coded type 1 neural progenitor DEGs (dashed border lines): upregulated = RSPO3, SULF2, GPC4; and downregulated = SFRP2, HSP90AB1, CTNNB1, ZIC1 , CCND1. (E) GO terms identified in type 3 neural progenitors enriched for genes associated with the canonical WNT signalling pathway, regulation of glial cell differentiation and others. (F) Violin plots of DEGs in type 3 neural progenitors show NOTCH signalling transcription factor, HES1, and ID3, which regulate glial differentiation; genes regulating cellular division: CENPF and CENPW; chromatin-modifying gene, HMGA1; and WNT signalling regulators: RSPO3, SFRP2 and ZIC1. (G) GO terms identified in immature neurons enriched for genes associated with synapse maturation, cholesterol metabolism, cytoskeletal organization and others. (H) Violin plots of DEGs in immature neurons shows genes associated with synapse maturation: NEFM, RELN and NRXN1; cholesterol biosynthesis: ACAT2 and HMGCS1; and genes associated with cytoskeletal organization: SMC1A and NEFM; and neurite morphogenesis: DCC and MDK. Of note, NRXN1 (AUTS2 target gene), DCC, RELN (AUTS2 target gene) and SMC1A are also designated SFARI genes implicated in autism spectrum disorder and intellectual disability. Log fold changes (FC) are shown under each violin plot and denote FC relative to either the parental control or gene-corrected control.
AUTS2 exon 9 PCR amplification and Sanger DNA sequencing
PCR was performed using the JumpStart REDTaq ReadyMix Reaction Mix (Sigma) with the following experimental conditions: 200 ng of genomic DNA, 25 µM of primers (AUTS2 exon9-forward primer: 5′-TCTTGCGACAGGAACTGAACA-3′, AUTS2 exon9-reverse primer: 5′-GTGCTCTACTTATCCTCACATTTTGC-3′) and the JumpStart REDTaq ReadyMix. PCR cycling parameters were the following: initial denaturation 2 min at 94°C followed by 35 cycles at 94°C for 30 s, 30 s at 60°C, 1 min at 72°C and a final extension of 5 min at 72°C. Agarose gel electrophoresis was used to visualize PCR products, which were then excised and extracted using the QIAquick Gel Extraction Kit (Qiagen). Purified PCR products were then processed for Sanger DNA sequencing (Eurofins) using both AUTS2 Exon9F and AUTS2 Exon9R primers.
CRISPR/Cas9 AUTS2 variant gene correction and iPSC clone screening
The patient hiPSC line harbouring the AUTS2T534P variant was gene-corrected in collaboration with Synthego with the specific gene correction and silent edit: AUTS2P534T (c.1600C>A, c.1608G>A) (Fig. 4B). A small guide (sg) RNA (TGTGCTGGTGCGTGTGCTGG) was designed that contained <2 base pair matches to other sequences in the genome to ensure precise gene targeting. The sgRNA was then complexed with Cas9 to generate a ribonucleoprotein complex and together with the single-stranded oligo DNA donor (Supplementary Table 5) was nucleofected into AUTS2T534P hiPSCs. Synthego’s Inference of CRISPR Edits (ICE) software tool was then used to measure the frequency of successful gene editing. iPSCs were then dissociated with TrypLE Express (Thermofisher) and seeded at 0.5 cells/well into a 96-well dish and allowed to expand to confluency. Genomic DNAs from single iPSC clones were then isolated, exon 9 PCR amplified, and screened using Sanger sequencing to confirm successful gene correction and introduction of the silent gene edit.
Conservation analysis
The full-length AUTS2 isoform sequence (AUTS-isoform 1 on UniProtKB) was selected from the UniProtKB database. UniProtKB’s in-built ClustalW (Clustal Omega) alignment tool was used to perform sequence alignment. The following default alignment parameters were used—default transition matrix Gonnet, gap penalty of 6 bits, gap extension of 1 bit. The default alignment algorithm HHAlign32 was used to perform sequence alignment.
Collation of AUTS2 Exon 9 variants
Exon information of Homo sapiens AUTS2 full length-isoform (Ensmbl ID ENST00000342771.10) was determined based on UCSC Genome browser annotation. Based on this exon 9 mapping, all unique AUTS2 exon 9 variants on ClinVar, LOVD (Leiden Open Variant Database) and HGMD were collected and tabulated.
Immunofluorescence
Fixation
COs were fixed in 4% paraformaldehyde (PFA, Electron Microscopy Sciences, 15713)/Dulbecco’s phosphate-buffered saline (DPBS; Gibco, 14190-144) at 4°C overnight. The next day, COs were placed on a shaker in PFA solution at room temperature for 10–15 min to finalize fixation. Once entirely fixed, residual PFA was removed with three DPBS washes. COs then underwent a sucrose gradient: first, COs were equilibrated to 10% sucrose (Sigma Life Sciences, S7903-250G)/1% antibiotic-antimycotic (Gibco, 15240-062)/DPBS solution overnight. Then, COs were transferred to a 30% sucrose/1% antibiotic-antimycotic/DPBS solution to equilibrate overnight again.
Preparation for cryosectioning
The COs and the 30% sucrose solution were inverted into a Petri dish and transferred to excess optimal cutting temperature (OCT) solution (Sakura Finetek USA Inc., 4583) with a sterile, trimmed transfer pipet. Up to five COs were placed quickly into the mould, minimally rearranged in a grid-like fashion and immediately frozen in a bath of dry ice pellets and methanol. The COs were stored at −80°C until sectioned.
Cryosectioning
The embedded tissue was removed from −80°C and mounted on a cryostat chuck with dry ice. The mounted tissue was placed in the cryostat (ThermoFisher, 957020) to equilibrate to −14°C for approximately 1 h. Then, the tissue was sectioned at 20 µm directly onto positively charged glass slides (Fisherbrand, 1255017) in the cryostat. The slides were stored at −30°C until further processing.
Staining
Slides containing sections were then thawed at room temperature for at least 20 min, outlined with a hydrophobic maker (Life Technologies, 008899) and rehydrated in PBS. Slides were then incubated with blocking solution containing 0.1% Triton X-100/10% donkey serum/Tris buffer solution (TBS) for 1 h at room temperature. Slides were then incubated with primary solution (blocking solution, antibodies per dilutions described in Supplementary Table 2) for 16–24 h at 4°C. Slides were then rinsed three times with TBS solution. Then, a secondary solution (blocking solution, species-appropriate secondary antibodies and DAPI) was added and incubated for 2 h at room temperature. Residual secondary antibodies were removed with three TBS washes. Slides were then immediately cover-slipped with Fluoromount-G® (SouthernBiotech, 0100-01).
Imaging
Images were captured with confocal microscopy on a scanning laser confocal microscope (Zeiss LSM 800).
CO phenotype characterization
Organoid area quantification
Organoid cross-sectional areas were extracted from phase contrast images using FIJI and analysed for trends in GraphPad Prism X.
Mitotic angle analysis
Angle calculations were determined using fixed organoid slices stained with TPX2, ZO1 and DAPI to label spindle microtubules during mitosis, the ventricular surface and cell nuclei, respectively. First, the ventricular surface was outlined using the Adobe Photoshop 2020 Curvature Pen Tool with a solid line one pixel in width. Next, the Add Anchor Point Tool was used to ensure the outline closely adhered to the border of the ventricular surface. ZO1 and DAPI were used to describe the ventricular surface. Second, the line of cleavage was similarly drawn between the TPX2 signals of cells caught in mitosis. Third, the line of cleavage was copied and transposed to intersect the ventricular surface outline at its closest point using the Path Selection Tool. Fourth, the outlined images were quantified on ImageJ (FIJI) using the Angle tool to measure the angle of cleavage as defined by the acute angle formed by the transposed line of cleavage and the intersecting portion of the ventricular surface for each cell. Finally, each cell was given a division classification of vertical, oblique, or horizontal according to its angle of division falling between 0 and 30°, 30–60°, or 60–90°, respectively.
EdU and phospho-histone H3+ analysis
First, rosette boundaries were drawn on a merged image of Edu, phospho-histone H3+ (pHH3) and DAPI signal using the Polygon Selection Tool in FIJI. Then, EdU+ and pHH3+ cells were manually quantified and trends were analysed in GraphPad Prism X.
Cilia length and count analyses
Tissue sections from the parental control and proband lines were stained with ARL13B, SOX2 and DAPI according to our immunofluorescence protocol. The sections were then surveyed to locate and collect z projection images of rosettes. The upper and lower boundaries of the z projection were defined by ARL13B signal (i.e. appearance of cilia). A maximum projection was then generated and used in subsequent analyses, where cilia length and count as well as rosette area were determined using the region of interest and measurement tools in FIJI (ImageJ v.2.0.0-rc-69/1.52p). All statistical analyses were performed using one-way ANOVA with Tukey’s multiple comparisons test.
Rosette morphology analysis
Cell polarity within CO rosettes was analysed using the ImageJ plug-in ‘Directionality’ created by Jean-Yves Tinevez (https://imagej.net/plugins/directionality), following the instructions therein and methodology described in a previous publication.33 Briefly, raw images of individual rosettes were isolated, a threshold of 20.0 ± 5.0% was applied and the ‘Directionality’ plug-in was applied, selecting the Fourier component analysis. Each cell is given an angle respective to the horizontal, with the number of bins being the default: 90° to −90° (180°). Statistics generated from the highest peak was found and fitted by a Gaussian function, with ‘Direction’ reporting the centre of the Gaussian distribution, ‘Dispersion’ reporting the standard deviation of that Gaussian function, and ‘Amount’ the sum of the histogram data from centre-minus-standard-deviation to centre-plus-standard-deviation divided by the total sum of the histogram. Additionally, an orientation map was generated and the Fourier power spectrum of each input image was produced, as detailed in the plug-in instructions (denoted as Fast Fourier Transform or FFT).
Duolink proximity ligation assay
The Duolink proximity ligation assay (PLA) was performed as previously described34 and as outlined in Fig. 5 (Sigma). Briefly, slides were incubated with primary antibodies for AUTS2 (Sigma, cat. no. HPA000390, 1:250) and P300 (Active Motif, cat. no. 61903, 1:1500) and then secondary antibodies (PLUS and MINUS PLA probes) were added. If protein–protein interaction occurred, DNA probes would hybridize to make circular DNA. The DNA is then amplified, and fluorescent probes added for detection of the protein–protein interaction sites (minimum of 150 nuclei from n = 10 rosettes quantified, across a minimum of four independent organoids per group and one independent experiment performed). ImageJ was used for image analysis and data quantification.
Single-cell RNA sequencing sample processing
COs were pooled in groups of eight (per line) and prepared for single-cell RNA sequencing as previously described.31 In brief, organoids were dissociated into a single cell suspension using a gentleMACS Octo Dissociator (Miltenyi) with the manufacturer’s ‘37°C_ABDK_02’ program. Then, 2 ml solution of Accumax (Sigma, A7089) was transferred into a gentleMACS C-tube (Miltenyi, 130-093-237), organoids were placed in this solution and processed using an Octo-Dissociator instrument (Miltenyi). After the program completed, 10 ml of DPBS + 0.04% bovine serum albumin (BSA; Sigma, A9418) were added to each C-tube and then sample solution was filtered through a 70-μm strainer to remove undissociated tissue and debris. Dissociated and strained cell mixtures were then centrifuged for 2 min at 300g and resuspended in 1 ml DPBS + 0.04% BSA. Additional cell filtration steps was performed to remove fine cell debris using a 40-μm Flowmi® cell strainer (Sigma, BAH136800040). We found repeating this filtration step twice yielded a cell suspension devoid of cell debris for all lines. The concentration and viability of each suspension was then manually determined using trypan blue staining and a haemocytometer. Finally, samples were diluted to achieve a concentration of 1000 cells/μl. Approximately 10 000 cells were used to generate scRNA-seq libraries using the 10× chromium single cell 3′ V2 library kit (10× Genomics) according to the manufacturer’s instructions and sequencing was performed on a NovaSeq 6000 System (Illumina).
Single-cell RNA sequencing data processing and analysis
Raw base call sequencing data were demultiplexed with Cellranger (v6.0.0) mkfastq function and aligned by CellRanger (v6.0.0) count function using default settings and the GRCh38-2020-A reference transcriptome from 10× Genomics. Summary by sample: parental control—17 066 cells, 23 427 mean reads per cell, 2370 median genes per cell, 5850 median unique molecular identifier (UMI) counts per cell; proband—10 542 cells, 37 722 mean reads per cell, 3300 median genes per cell, 9578 median UMI counts per cell; GC control—14 124 cells, 27 886 mean reads per cell, 2780 median genes per cell, 6556 median UMI counts per cell. The count matrices were then converted to objects in Seurat v3.3.035,36 for analysis and to generate visual representations. Standard quality control parameters were applied to each object. In brief, cells with greater than 200 and less than 5000 unique features or less than 20% mitochondrial reads were retained. The data were log-normalized with a scale factor of 10 000 and the top 2000 variable features per object were identified. Integration anchors were generated with 30 principal components and used to integrate all samples into a combined object with a total of 35 633 cells. Standard Seurat procedures were applied to perform a principal component analysis and k-nearest neighbour unbiased clustering. The FindNeighbors principal component analysis reduction (30 dimensions) and FindClusters (0.5 resolution, 30 dimensions) functions were used to identify 24 unbiased clusters. Cluster identities were determined by characteristic canonical markers37–40 and five unique clusters were identified. Given the scope of the study, we opted to utilize a subset object with 17 752 cells that exclusively contained clusters relevant to our focus on progenitor-to-neuron differentiation. This subset object contained immature neurons, intermediate progenitor cells and three classes of NPCs.
Foetal brain and COs transcriptome analyses
Single-cell transcriptomic analyses of foetal brain cortex and COs were carried out on a large, publicly available dataset20 (downloaded from https://cells.ucsc.edu/organoidreportcard/). The data were handled in Seurat35 (v3.2.2) with R version 4.0.2 with a publicly available dataset. The foetal dataset was composed of 189 409 cells from various cortical regions of five unique foetal donors between Weeks 6 and 22 of gestation. The organoid dataset was composed of 235 121 cells from 37 organoids across a developmental time window spanning 3–10 weeks of culture. Cell identities were assigned based on the metadata provided by Bhaduri et al.20
Statistical analyses
GraphPad Prism v9.0.0 (La Jolla, CA) was used to generate all graphs and perform all data and statistical analyses in this study. For organoid growth analyses, the number of replicates displayed in Fig. 2 ranged from 19 to 53 from each group. Statistical analysis of data of organoid growth was performed using a Mann–Whitney U-test. Statistically significant differences between parental control and proband COs were observed between groups commencing at Day 20, P-values are displayed in Fig. 2D. *P ≤ 0.05; **P ≤ 0.01; ***P ≤ 0.001; ****P ≤ 0.0001; ns = not significant. For organoid growth analyses in Fig. 4R, the number of replicates ranged from 44 to 65 from each group at Day 30. Statistical analyses were performed using one-way ANOVA with Tukey’s multiple comparisons test (n = 14 rosettes quantified across a minimum of four independent organoids per group and one independent experiment performed). Statistical analyses for quantification of EdU+ and pHH3+ NPCs in neural rosettes of organoids was performed using one-way ANOVA with Tukey’s multiple comparisons test (minimum of n = 4 independent organoids per group and three independent experiments performed). Cilia length quantifications in neural rosettes of organoids were performed using one-way ANOVA with Tukey’s multiple comparisons test (minimum of n = 4 independent organoids per group and one independent experiment performed). Analysis of single-cell RNA sequencing data is described in detail within the methods section. Eight individual organoids were pooled per group consisting of parental control, proband and GC control organoid groups. In all differential expression data analysis and Metascape gene ontology (GO) analyses, P-values were adjusted for multiple test correction. Significance of differentially expressed genes (DEGS) was defined as adjusted P < 0.05.
Data availability
The data that support the findings of this study are available upon reasonable request from the corresponding author.
Results
Identification of a de novo missense variant in the AUTS2 gene
We report a 4-year-old female who presented with profound intellectual disability, cerebellar hypoplasia, epilepsy and dysmorphic features (Fig. 1A). An MRI of the patient’s brain performed at age 5 showed enlarged ventricles consistent with cerebral volume loss as well as small cerebellar hemispheres and vermis (Fig. 1B and C). Extensive clinical genetic testing was performed on the patient that included karyotype and single nucleotide polymorphism microarray analysis, biochemical testing for congenital disorders of glycosylation and Smith–Lemli–Opitz syndrome and DNA methylation testing for Prader–Willi/Angelman syndrome. All of these tests were interpreted by the clinical care team as non-diagnostic. The patient and her parents were then enrolled in an IRB-approved research study for further genomic analysis.
To investigate whether the patient’s symptoms resulted from underlying genetic causes, WGS was performed on the patient and healthy parents (Supplementary Table 1). Our analysis uncovered two candidate-coding variants in the patient without corresponding genetic alterations in the parents, suggesting these variants arose de novo. The first candidate was a mosaic splice site variant TULP3 (NM_003324.4:c.253+1G>T) present at ∼23% variant allele frequency. TULP3 variants have not been associated with human disease according to OMIM, and the c.253+1G>T variant does not show constraint for loss-of-function (LoF) variation according to gnomAD (pLI = 0), suggesting the splice site variant is not pathogenic. The second variant identified was a de novo missense change in AUTS2 [NM_015570.3:c.1600A>C, p.(Thr534Pro)]. This AUTS2 variant is predicted to be damaging by 16/25 in silico tools according to VarSome.41 Sanger sequencing of the family trio confirmed its de novo status (Fig. 1D). Although the vast majority of AUTS2 variants reported as pathogenic or likely pathogenic to the ClinVar database are predicted to cause loss-LoF changes, five distinct missense variants (including c.1600A>C identified in our patient) have been reported within amino acid residues 529–535 (Fig. 1E) Sequence alignment of vertebrate amino acid sequences within the H1 region show that this portion of AUTS2 is significantly conserved, suggesting functional importance (Fig. 1F). Because few missense variants in AUTS2 have been reported to cause disease and given its expanding role in a range of neurological disorders, we sought to investigate the underlying pathogenic mechanism of this p.Thr534Pro variant.
Expression of AUTS2 in excitatory neurons and progenitor cell types
To investigate which cell types may be affected by the AUTS2T534P variant during corticogenesis, we analysed a published scRNA-seq CO and foetal brain dataset to evaluate AUTS2 expression at cell-type specific resolution.20 These data indicate AUTS2 is expressed in a diversity of cell populations within the developing foetal brain and COs with notable expression in excitatory neurons, radial glia and intermediate progenitors (Supplementary Fig. 1). Given the expression of AUTS2 in these progenitor cell types and the highly dynamic developmental program of NPC proliferation and differentiation during corticogenesis, we sought to investigate its pathophysiology in COs, which are an emerging model system that recapitulate morphological and early neurodevelopmental features of the human brain.
AUTS2 patient COs exhibit patient-specific developmental growth defects with proliferative deficits in NPCs
To investigate the functional role of the AUTS2T534P variant during human cortical development, we reprogrammed peripheral blood monocytes from the AUTS2T534P patient and her healthy parent as a control into hiPSCs using Sendai virus-based delivery of Yamanaka transcription factors (Supplementary Fig. 2). HiPSC colonies emerged within 7 days post-infection showing tight cell junctions, distinct cell borders and alkaline phosphatase activity, which are characteristic features of human pluripotent stem cells (Supplementary Fig. 2A and B). We then evaluated the chromosomal integrity and pluripotency of the hiPSCs by karyotyping (Supplementary Fig. 2C) and immunohistochemical analysis of key pluripotency markers, including OCT3/4, SSEA4, NANOG and LIN28 (Supplementary Fig. 2D). Using Sanger sequencing, we confirmed the heterozygous AUTS2T534P variant was present in the AUTS2T534P patient line (Fig. 1D). Additionally, we performed WGS and subsequent variant analysis on the parental and proband iPSC lines. Upon subsequent variant analysis, we did not identify any significant genetic alterations when generating both parental control (eight gene variants) and proband iPSCs (10 gene variants) from PBMCs (Supplementary Tables 3 and 4). Literature analysis of these mostly missense variants did not suggest functional effects in COs. We then used these hiPSC lines to generate three-dimensional COs with our undirected differentiation protocol.31 Our overall approach for modelling the AUTS2T534P variant in COs is summarized in Fig. 2A.
To investigate whether proband COs modelled the patient’s microcephaly, we differentiated proband and parental control hiPSCs into COs and performed a rigorous growth trajectory analysis of COs within a dynamic neurodevelopmental time window of NPC proliferation and differentiation (Fig. 2B–D). Proband and parental control COs were indistinguishable by size or gross morphology until Day 20 of culture, when proband COs showed a statistically significant reduction in overall growth compared to the parental control from Day 20 (Fig. 2D). This trend persisted over time (Day 20 median cross-sectional area of proband COs was 0.71 mm2 compared to 1.41 mm2 in parental control Cos; Fig. 2B–D). By Day 28, the median cross-sectional area of proband COs was 1.52 mm2 in proband COs compared to 2.56 mm2 in parental control COs [coefficient of variation (CV) = 49.01% in proband COs and 44.2% in parental control COs]. This trend was also observed across multiple cohorts (n = 4), suggesting that the proband COs recapitulate morphological features of the patient’s microcephaly.
We then tested whether proliferative deficits in NPCs within ventricular-like zones (i.e. neural rosettes) underlie the growth deficits observed in proband COs. To perform this analysis, we pulse-labelled proliferating cells in proband and control COs with EdU42 and performed a quantitative imaging analysis for the M-phase specific marker, pHH3 (see Supplementary Table 2 for all antibodies utilized in this study), and EdU+ cells within neural rosettes. Our analysis revealed a statistically significant reduction in the number of EdU+ and pHH3+ NPCs in proband COs compared to the parental control (Fig. 2E–H). To increase the rigour of our analyses, we analysed organoid growth and the NPC proliferative properties of an additional proband clone, which showed similar phenotypic deficits (Supplementary Fig. 3). These data further demonstrate that the CO developmental growth phenotypes observed are due to the AUTS2T543P variant. To determine whether increased apoptotic cell death contributed to the proband phenotypes, ironically, we observed a statistically significant decrease in CC3+ intensity compared to the parental control (Supplementary Fig. 4). This finding may reflect a compensatory change in proband COs to preserve NPCs, although future investigation is warranted. To rule out whether differences in growth between proband and the parental control COs was not due to proliferative differences in iPSC lines, we analysed their cell proliferation rates using the MTT assay and did not observe any statistically significant differences among iPSC lines (Supplementary Fig. 5). Collectively, these data further suggests the AUTS2T543P variant causes a defect during neurodevelopment and not a general cell cycle defect.
Proband COs exhibit increased asymmetric cellular divisions and ciliary defects
As cell cycle control and cellular division is tightly coupled within the ventricular zone (VZ) during human corticogenesis, we investigated the dividing properties of apical progenitors along VZ-like zones in proband COs. During early human brain development, NPCs self-renew through symmetrical divisions along the ventricular surface to sufficiently expand the pool of NPCs allowing for subsequent neurogenesis.43–45 After this rapid symmetrical expansion of NPCs, they undergo a gradual shift towards dividing asymmetrically to form a daughter NPC and either an intermediate progenitor cell (IPC) or a neuron. Compared to rodent brain development, human brains undergo more extensive symmetrical divisions of apical progenitors and increased basal progenitor proliferation within the outer subventricular zone resulting in a larger frontal cortex,43–45 a key difference which may explain why mutations causing microcephaly in humans are not adequately modelled in the mouse. Several studies have suggested primary microcephaly results in the loss of cortical expansion caused by premature neuronal differentiation due to the depletion of dividing progenitors.22,23,46 This process occurs when progenitors prematurely undergo asymmetric divisions to generate neurons instead of additional progenitors at an early stage of neurodevelopment (Fig. 3A).
To test whether a similar mechanism of premature asymmetric divisions occurred in proband NPCs, we measured the division angles of SOX2+ apical progenitors at the VZ within our COs using the mitotic spindle marker TPX2 and apical zone marker ZO1 (Fig. 3B and C). Approximately one-third of divisions within parental control COs were asymmetric (vertical: 18%, oblique: 18%, horizontal: 64%; n = 95 cells) whereas nearly two-thirds of divisions in the proband AUTS2T534P COs were asymmetric (vertical: 31%, oblique: 34%, horizontal: 35%; n = 126 cells). This approximate 2-fold increase in asymmetric divisions within proband COs indicates progenitors may be undergoing premature neuronal differentiation. Taken together, the overall decrease in proliferation and increase in neurogenic, asymmetrical divisions within proband COs suggests that the AUTS2T534P variant adversely affects NPC cell cycle dynamics and/or cell fate determination.
We next analysed the primary cilium within neural rosettes as this structure is critical in establishing NPC columnar organization within the VZ and is directly involved in cell cycle kinetics of various cell types, including NPCs. Several microcephalic phenotypes have been linked to disruptions in primary cilium dynamics.23,47–49 We found VZ-like structures within proband COs that lacked NPC columnar organization and uniform polarity. Specifically, they exhibited disrupted microtubule networks within rosettes, as shown by their irregular acetylated tubulin immunoreactivity (Fig. 3G, H and J) compared to controls (Fig. 3E, F and I). Additionally, we observed a statistically significant reduction in the length of proband ARLB13B+ cilia compared to controls (Fig. 3K).
To further investigate rosette morphological changes observed in proband COs, we analysed the orientation of NPCs within CO rosettes using the Fourier component analysis for directionality (Supplementary Fig. 6). Rosettes display the canonical circular structure with cells pointing towards the middle of the rosette, exemplified by the organized and opposite colours seen in the orientation map and the FFT, which shows a circular shape. This agrees with an inward, circular polarity with columnar organization in which each cell has an opposite counterpart that negates any preferred orientation. The amount value per cent (%) represents the proportion of cells in a specified orientation and the dispersion value represents the degree of organization. The low dispersion and amount values in the parental control indicates that these cells are organized, as expected from this configuration. Conversely, proband rosettes have a significantly higher dispersion and amount, indicating cell disorganization, fewer opposing polarities and significant deviation from the parental control rosette pattern (Supplementary Fig. 6).
Collectively, these results suggest the proband COs exhibit deficits in ciliary properties and organization with a concomitant loss of NPC polarity within CO rosettes. As primary cilium formation and resorption is imperative to the progression of the cell cycle, the loss of NPC polarity in proband COs provides further evidence that the AUTS2T534P variant impairs their proliferative capacity.
Given the established role of AUTS2 in neuronal migration,6 we then evaluated whether there were any overt abnormalities in progenitor cell migration by analysing the distribution of TBR2+ IPCs surrounding neural rosettes in proband COs. We did not observe any marked differences in the distribution of TBR2+ IPCs demarcating neural rosettes within both proband and control COs (Supplementary Fig. 7). Further, no IPCs were detected within proband or control rosettes as expected, suggesting the AUTS2T534P variant may not substantially affect progenitor migration. To investigate AUTS2 expression in proband COs, we observed both cytoplasmic and nuclear expression of AUTS2 in NPCs, similar to the parental control, and verified AUTS2 staining specificity using a blocking peptide directed against the AUTS2 antibody utilized. These data suggest the AUTS2T534P variant does not alter normal AUTS2 expression patterns (Supplementary Fig. 7B). We also observed that a subset of IPCs were both AUTS2+ and TBR2+ in both proband and control COs, which is consistent with our synthetic scRNA-seq analysis (Supplementary Fig. 1).
Growth area and NPC proliferative deficits in proband COs are rescued by gene correction
To investigate whether the phenotypes we observed in proband COs were caused by the AUTS2T534P variant, we gene-corrected this alteration to the wild-type sequence using CRISPR-Cas9 homology-directed repair (Fig. 4A). A small guide (sg) RNA (20 base pairs) targeting the AUTS2 variant region was designed that contained <2 base pair matches to other sequences in the genome to ensure precise gene targeting. Additionally, a silent edit was inserted in the single-stranded oligo donor (ssODN) sequence to disrupt repeated sgRNA binding and subsequent recutting by Cas9 after successful editing (Fig. 4B). The sgRNA and ssODN sequences are provided in Supplementary Table 5. Synthego’s ICE software tool was then used to measure the frequency of successful gene editing. We then generated single iPSC clones, screened ∼100 of them using Sanger sequencing and confirmed three clones showed both successful gene correction (c.1600C>A) and introduction of the silent gene edit (c.1608G>A). Next, we verified pluripotency markers using immunofluorescence analysis and chromosomal stability using karyotype analysis in the GC hiPSC line prior to generating COs (Supplementary Fig. 2B–D).
We then generated COs using an optimized protocol to enhance organoid reproducibility in our cultures38,50 and to test whether GC of the AUTS2 variant rescued the microcephalic phenotype we observed in proband COs (Fig. 4C–G). This protocol obviates the requirement to encapsulate neuroepithelial bodies and generates morphologically reproducible and robust COs compared to prior protocols.38,50 Consistent with our previous studies, proband COs generated by this method showed a reduction in growth compared to parental control COs (Day 30 median cross-sectional area of proband COs was 1.44 mm2 compared to 2.43 mm2 in parental control COs; Fig. 4H, L and K). In contrast, our GC COs showed a statistically significant increase in cross-sectional area compared to proband COs, suggesting phenotypic rescue and that the AUTS2T534P variant contributes to organoid growth deficits (Day 30 median cross-sectional area of GC control COs was 1.68 mm2, 75th percentile cross-sectional areas were 1.55 mm2 in proband COs compared to 2.11 mm2 in GC control COs and 2.81 mm2 in parental control COs (Fig. 4P, L and K). However, a statistically significant difference in cross-sectional area was observed between the parental control and GC control COs. This finding highlights the variability in growth properties of COs arising from intrinsic differences across hiPSC lines with different genetic backgrounds (Fig. 4K) and underscores the value of performing these types of analyses with a GC hiPSC line. Our optimized CO generation protocol resulted in a significant reduction of the CV in CO area measurements across groups compared to our earlier CO area growth analysis (CV = 12.78% in proband COs, 26.86% in parental control COs and 29.77% in GC control COs), which suggests this improved CO generation protocol lowers organoid-to-organoid variability.
Next, we tested whether NPC proliferative deficits in proband COs were rescued by the AUTS2 variant gene correction. Similar to our prior experiment, we pulse-labelled proliferating cells in COs with EdU and then performed a quantitative imaging analysis for pHH3+ and EdU+ cells within neural rosettes across all organoid groups. Although an increased trend in the number of EdU+ was observed in the GC control compared to proband COs, this increase did not reach statistical significance (Fig. 4O). However, a statistically significant increase in the number of pHH3+ NPCs was observed in the GC control compared to proband NPCs (Fig. 4S). In addition, no significant difference was observed between the parental control and the GC control, suggesting phenotypic rescue and thus providing further evidence that the AUTS2T534P variant contributes to deficits in NPC proliferation (Fig. 4S). Additionally, we analysed apoptotic cell death and showed no statistically significant difference between the proband and GC control as determined by CC3+ staining (Supplementary Fig. 4). Further, we measured rosette morphological features in the GC control and our analysis showed a statistically significant decrease in the amount and dispersion compared to the proband. All of these data suggest that reduced proliferation is the main cause of reduced organoid growth in the proband.
To increase the rigour of our analysis and verify whether the phenotypic rescue we observed in the GC control was due to the gene correction of the AUTS2T534P variant into the wild-type sequence and not due to mutations introduced during the CRISPR and cloning process, we performed WGS analysis on the GC control (Supplementary Table 4). WGS analysis of the gene-corrected iPSC clone revealed eight gene variants. Although we did not identify any variants due to off-target effects of the sgRNA utilized in the gene correction, we observed a TP53 truncating variant (∼61% frequency) and a missense TP53 variant of unknown significance (VUS; ∼52% frequency). Given the role of P53 in suppressing cell growth and the unknown role of these TP53 variants in COs, we screened additional gene corrected clones and identified one without the TP53 truncating variant by Sanger sequencing (GC 2 control; Supplementary Table 4 and Supplementary Fig. 3). CO growth and NPC proliferative analyses in GC 2 control COs showed a similar statistically significant rescue compared to both proband clones. Additionally, both GC control COs showed similar growth and NPC proliferative rescue properties (Fig. 4 and Supplementary Fig. 3), suggesting the combined TP53 variants in the original GC control clone do not contribute to the phenotypic rescue.
The AUTS2 T534P variant disrupts interaction with P300
The AUTS2 T534P variant was recently shown to disrupt interaction with P300 and alter transcriptional activation.51 To test whether the AUTS2 T534P variant in proband COs also showed disruption in P300 binding, we used the Duolink PLA to quantify AUTS2/P300 interactions (Fig. 5A). This sensitive and quantifiable assay allows for the detection of endogenous protein–protein interactions at distances <40 nm within tissue sections as observed by fluorescent puncta.34 Parental control COs showed robust AUTS2/P300 interactions predominately within nuclei of rosette structures (Fig. 5B). Conversely, we observed a significant decrease in signal intensity in proband COs, suggesting impaired interactions with P300. Strikingly, GC control organoids, showed a significant increase in signal intensity, signifying the AUTS2/P300 interaction was restored upon gene correction. Image analysis and intensity quantification per nucleus showed an approximate 2-fold decrease (parental control, 63.8 ± 36.6; proband, 31.2 ± 19.4; GC control, 50.8 ± 36.1). All pairwise comparisons showed statistical significance among groups (P < 0.0001; Fig. 5C). Collectively, these data indicate the AUTS2 T534P variant disrupts interaction with P300, which may cause transcriptional dysregulation in proband COs (Fig. 5D).
Single-cell RNA sequencing reveals a susceptible population of NPCs in proband COs that is rescued by gene correction
Based on our previous results showing impaired interactions of AUTS2 T534P with P300, we sought to determine cell-type specific transcriptomic signatures underlying the proband COs growth defect phenotype, using scRNA-seq analysis in Day 30 proband COs (n = 8 organoids pooled per group; Fig. 6). We performed unsupervised clustering on gene expression profiles from an integrated data set of 35 633 cells and identified 10 composite clusters using canonical marker genes (Supplementary Fig. 8). Because the scope of our study primarily concerned NPCs and differentiated immature neurons, we subclustered them for further analysis. This subclustering resulted in five cell types from an integrated dataset of 17 752 cells, which were composed of EOMES+ IPCs, STMN2+/GAP43+/TBR1+ immature neurons and three classes of SOX2+ NPCs (Fig. 6A and B). Upon initial analysis, we observed a drastic reduction in the relative proportion of type 2 NPCs in proband COs compared to both controls (Fig. 6C, F and I). Strikingly, type 2 NPCs constituted approximately 22% of cells within parental control COs, but only 0.25% in proband COs. This under-represented NPC population was significantly rescued in GC control COs showing a 22-fold increase of type 2 NPCs (5.5% of total) compared to proband COs, suggesting the reduction of this cell type is related to the AUTS2T534P variant. We also observed a 2-fold increase in the percentage of immature neurons in proband COs (29%) compared to parental control COs (14%), which supports our earlier results showing increased asymmetrical divisions and subsequent premature neuronal differentiation in proband COs. The GC control also showed a decrease in the percentage of immature neurons compared to proband COs (from 29% in proband COs to 23% in GC control COs), suggesting that gene correction of the AUTS2 variant partially restores the proper timing of neurogenesis in COs. We also noted a nearly 2-fold increase in the percentage of IPCs in proband COs, which constitute 7% of all subclustered cells but only 3–4% in control COs. Analysis of AUTS2 expression in our scRNA-seq data showed similar levels across both proband and control groups in NPCs and in immature neurons, suggesting the AUTS2T534P variant does not affect mRNA stability (Supplementary Fig. 9).
Next, we investigated gene expression signatures enriched in type 1 and type 3 NPCs. Type 1 NPCs were enriched for G2/M phase gene expression signatures such as MKI67 and TOP2A and type 3 NPCs were enriched for FABP7 and SOX9, transcription factors that are critical for NPC proliferation and promote neuronal and glial fate specification52–55 (Fig. 6B and Supplementary Fig. 8). Type 1 NPCs were composed of similar percentages within proband (24.8%) and parental control COs (26.7%) and were elevated approximately by 10% in GC control COs. Type 3 NPCs showed an approximate 5% increase in proband COs compared to both control COs. The significance of these differences is unknown and warrants future investigation.
To determine specific biological processes and molecular functions that characterize type 2 NPCs, we performed a GO analysis from the top enriched gene expression signatures identified in type 2 NPCs. Type 2 NPCs were enriched for the GO terms: anterior/posterior pattern specification (GO:0009952), ribosome assembly (GO:0042255), G1/S transition of mitotic cell cycle (GO:0000082), protein–DNA complex assembly (GO:0071824) and others (Fig. 6E). Further analysis within the anterior/posterior pattern specification GO revealed genes associated with midbrain and hindbrain specification (e.g. DUSP6, OLIG3, HOXA2; Supplementary Fig. 10). Thus, AUTS2 may play a critical role in specifying these cells fates and may explain why AUTS2 syndrome patients have cerebellar hypoplasia. Additionally, the type 2 NPCs were enriched for CCND1, EIF4EBP1, CDK6, CCND2 and other gene expression signatures, all of which contribute to the G1/S transition phase of the cell cycle (Supplementary Table 6). Expression analysis of these cell cycle genes showed significant reductions in proband COs, which were restored in GC COs (Fig. 6H). Collectively, these findings suggest that the AUTS2T524P variant in proband COs leads to a selective loss of proliferating progenitors, which is consistent with a reduced percentage of EdU+ and pHH3+ progenitors and consequential developmental growth defect phenotype in proband COs compared to controls (Figs 2G and H, 4O and S). These results suggest AUTS2 plays an important role in the progression of the cell cycle within NPCs, which is critical for proper timing of human corticogenesis.
Proband NPCs show dysregulated gene expression associated with WNT-β-catenin signalling, chromatin modification and gliogenesis
To further investigate underlying molecular mechanisms affecting NPC proliferative deficits in AUTS2 patient COs, we performed GO analyses from genes identified within the type 1 and 3 NPC clusters that were differentially expressed in comparison to both parental and GC control COs. In type 1 NPC, we observed DEGs that were enriched for the GO terms: brain development (GO:0007420), CNS neuron differentiation (GO:0021953), WNT signalling pathway (GO:0016055), chromatin silencing (GO:0006342) and others (Fig. 7A). Of note, the chromatin modifying gene, HMGA1, showed reduced expression in proband COs (Fig. 7B), which has been shown to play an important role in controlling the neurogenic potential of NPCs and the developmental timing of gliogenesis.56,57 Other chromatin-modifying genes, HIST1H2AG and KCNQ1OT1, were also dysregulated. Our analysis also identified increased expression levels of MAP2, which is consistent with our earlier finding that proband NPCs are undergoing premature neuronal differentiation. NFIB and FGFR3 expression levels were also induced in proband type 1 NPCs, suggesting these progenitors show a propensity towards glial cell differentiation. Interestingly, we observed increased expression of the homeobox transcription factor, TSHZ2, and the neural cell adhesion gene, CNTNAP2, both of which have been previously identified as AUTS2 target genes in mouse studies58 (Fig. 7B). We then focused our analysis on those DEGs associated with WNT signalling as numerous studies have underscored its critical role in regulating NPC proliferation and differentiation within the ventricular zone.59–61CTNNB1, which is the major signal transducer of WNT signalling, was significantly reduced in proband COs within both type 1 and 3 NPCs and immature neurons. We also observed alterations in the expression of multiple genes in proband COs compared to control COs, which function in regulating WNT signalling activity such as RSPO3, SFRP2, GPC4 and SULF2 (Fig. 7C and D). Cyclin D1 (encoded by the CCND1 gene) is a well-characterized target for WNT-β-catenin signalling, which promotes G1/S phase transition of the cell cycle,62,63 was reduced in proband NPCs compared to controls (Fig. 6H). Collectively, our data suggest that proband NPCs show deficits in WNT-β-catenin signalling, which may underlie their proliferative deficits and impairment to transition through the G1/S phase of the cell cycle.
We then performed the same type of GO analysis for type 3 NPCs and observed DEGs that were enriched for the GO terms: brain development (GO:0007420), WNT signalling pathway (GO:0016055), regulation of glial cell differentiation (GO:0045685), cell division (GO:0051301) and others (Fig. 7E). Similar to type 1 NPCs, type 3 NPCs showed reduced expression of HMGA1 and dysregulated expression of the WNT signalling regulators RSPO3, SFRP2 and ZIC1. In addition, we observed dysregulated expression of the centromere binding genes, CENPF and CENPW, which may contribute to the polarity and mitotic deficits in proband NPCs compared to controls. Increased expression of the HES1 and ID3 genes was also observed in proband NPCs. Previous studies have suggested that HES1 and ID3 promote the specification of neural precursors towards an astrocyte fate,64,65 which suggests proband NPCs may have an altered propensity to differentiate into glial identities.
Next, we examined the DEGs identified in immature neurons from our scRNA-seq data. Mouse studies have underscored a critical role for AUTS2 in controlling neuronal gene expression and specifying neuronal cell fates; however, few studies have examined the role of AUTS2 in human corticogenesis and its biological link to intellectual disability observed in AUTS2 syndrome patients. Similar as described above, we performed a GO analysis on DEGs from immature neurons and identified the following enriched biological processes: synapse maturation (GO:0060074), cholesterol biosynthesis (R-HSA-191273), glial cell differentiation (GO:0010001) and cytoskeleton organization (GO:0045104), among others (Fig. 7G). We observed dysregulated expression in the synaptic maturation genes NEFM, RELN, NRXN1 and reduced expression of genes controlling cholesterol metabolism such as ACAT2 and HMGCS1 (Fig. 7H). Other altered gene expression levels were observed in genes regulating cytoskeletal organization: SMC1A and NEFM; and neurite morphogenesis: DCC and MDK. Interestingly, Nrxn1 and Reln were previously identified as AUTS2 target genes in mouse studies using ChIP Seq.58 In addition, NRXN1, DCC, RELN and SMC1A have all been implicated in ASD and intellectual disability and are designated Simons Foundation Autism Research Initiative (SFARI) genes.66–70 Further studies are warranted to understand the impact of these altered gene expression patterns on synaptic maturation and activity during neurodevelopment using in vitro and in vivo models of AUTS2 deficiency and whether they are linked to cognitive deficits in ASD/intellectual disability patients.
Discussion
This study provides novel molecular insights into AUTS2 function within NPCs, which may underlie the neurological manifestations of microcephaly and syndromic intellectual disability observed in AUTS2 syndrome patients. Previous animal studies have identified a role for AUTS2 in transcriptional activation, RNA metabolism and cytoskeletal regulation in excitatory neurons. However, these animal models of AUTS2 deficiency do not develop reductions in cortical volume (i.e. microcephaly) and therefore may not adequately recapitulate disease mechanisms underlying AUTS2 syndrome within the cerebral cortex.
Here we present a patient with a de novo pathogenic AUTS2T534P missense variant who presents with AUTS2 syndrome. We established a CO model of this patient to investigate the human-specific pathogenesis of AUTS2T543P in the early developing brain. Our results indicate that AUTS2 deficiency leads to a developmental growth phenotype recapitulating the patient’s microcephaly, which dysregulates cell cycle dynamics within NPCs, leading to a subsequent reduction in proliferation, ciliary defects and the selective loss of progenitors enriched for gene expression associated with G1/S cell cycle transition. Further, scRNA-seq analysis revealed deficits in WNT-β-catenin signalling in NPCs, which may underlie their proliferative deficits. Multiple studies have underscored the critical role of β-catenin within NPCs during neurodevelopment. For example, conditional deletion of β-catenin in mouse cortical NPCs led to reduced cell proliferation and disruptions in the organization of the neuroepithelium.60 Conversely, overexpression of a stabilized form of β-catenin in NPCs increased cell proliferation.59 Additionally, focal depletion of β-catenin within NPCs of the mouse ventricular zone caused premature cell cycle exit and neuronal differentiation.61 However, it is unclear how AUTS2 deficiency is related to deficits in WNT-β-catenin signalling, although a few studies have suggested WNT-β-catenin signalling and AUTS2 share common downstream targets. For example, the WNT target gene, Cachd1, was recently identified as an RNA transcript that can be bound and regulated by AUTS2.14Wnt7b expression was also shown reduced in mice conditionally deleted for Auts2 (Auts2del15) in neocortex.14 Other shared AUTS2 targets identified using ChIP Seq58 and targets of WNT signalling using RNAseq71 include Fzd1 and Nfia. It is also plausible that altered expression of chromatin modifying genes observed in proband NPCs may dysregulate downstream WNT target gene expression. Interestingly, CTNNB1 gene mutations have been associated with dysmorphic features, microcephaly and intellectual disability in patients,72,73 clinical symptoms which have been observed in AUTS2 syndrome patients. Further investigation is required to determine whether overexpression of CTNNB1 in AUTS2T543P COs can rescue NPC proliferative deficits.
More recent work by Liu et al.51 demonstrated the HX domains of AUTS2, including the HQ-rich domain within exon 9, are critical for the previously characterized AUTS2-P300 complex. Variants that fall within this HQ-rich domain are associated with neurological symptoms such as microcephaly and intellectual disability—a strikingly similar clinical presentation to Rubinstein–Taybi syndrome, which is caused by pathogenic variants in CREBBP/P300. In this study, the AUTS2T534P variant is deficient in recruiting P300 to the PRC1.5-AUTS2 complex, leading to transcriptional dysregulation of downstream target genes. Although this work provides important insight to the mechanism by which the AUTS2T534P variant alters PRC1.5-AUTS2 activity, our study provides novel molecular insights into how this variant leads to pathogenesis in the developing human brain.
The most common challenges associated with CO models are (i) the variability among hiPSC lines; and (ii) organoid-to-organoid variability present within a particular experimental batch. We addressed these challenges by adapting a modified CO protocol to enhance organoid reproducibility and by generating an isogenic, gene-corrected hiPSC line. By gene-correcting this variant in proband hiPSCs, we determined that the proliferative and molecular deficits observed in proband NPCs were directly linked to the AUTS2 variant. In GC COs, we observed a statistically significant rescue of overall growth compared to proband COs, although overall growth of GC COs did not match that of parental control COs. However, at the molecular level, GC COs showed a statistically significant rescue in the percentage of proliferating pHH3+ NPCs compared to proband COs. Additionally, scRNA-seq analysis of GC COs showed a rescue of molecular alterations underlying proliferative deficits within proband NPCs.
Our scRNA-seq analysis also uncovered an NPC population that was strikingly under-represented in proband COs. GO analysis revealed these type 2 NPCs were enriched in gene expression signatures associated with G1/S cell cycle transition in addition to marker genes associated with midbrain and hindbrain specification. The loss of these cell fates in combination with proliferative deficits observed in proband NPCs most likely contributes to the organoid growth deficit observed in proband COs. Interestingly, the AUTS2 syndrome patient described here has cerebellar hypoplasia (Fig. 1B), which may be the result of deficits in hindbrain fate specification. Investigation of the AUTS2T534P variant using cerebellar organoids would provide greater mechanistic insight into AUTS2 function during cerebellum development.
Future studies are required to expand upon our findings with additional iPSC lines of AUTS2 deficiency and evaluate the mechanisms by which AUTS2 controls cell cycle progression in early NPCs. Additionally, other disease-causing variants, such as those found within the mutation hotspot within the ninth exon of AUTS2, warrant further investigation. Because AUTS2 is a master neuronal transcriptional activator, microcephaly in AUTS2 syndrome patients may arise from dysregulation of multiple downstream target genes. Thus, future studies are required to elucidate how transcriptional activation of AUTS2 variants is altered in NPCs and differentiated neuronal progeny. Our results show a critical role for AUTS2 in NPC proliferation and neuronal specification during early human cortical development, deficits of which may contribute to the clinical manifestations observed in AUTS2 syndrome patients. In sum, this study highlights the value of COs to advance our understanding of mechanisms underlying AUTS2 syndrome with the ultimate goal of developing therapeutic strategies for patients.
Acknowledgements
We are grateful to all laboratory members for their advice and constructive critiques related to this study. We would especially like to thank Arelis Berrios Hester for her excellent editorial assistance. Figs 2–4 contain schematics that were created with BioRender.com.
Funding
The funding of this work was generously supported by the Nationwide Foundation Pediatric Innovation Fund.
Competing interests
The authors report no competing or conflicts of interest.
Supplementary material
Supplementary material is available at Brain online.

