


Abstract
Locomotor performance is often key in animal fitness, and may be affected by habitat anthropization. This study compares locomotor performance of natterjack toads (Epidalea calamita), which move by intermittent runs, from a natural pine grove and surrounding agrosystems. The effects of sex, morphology and habitat on sprint speed and run rate (number of runs per metre) were assessed. Males were faster than females, and had longer limbs, but the latter trait only partially explained sex differences in sprint speed. Sprint speed was directly related to hindlimb length, but not to any of the other morphological traits measured. Thus, other factors, such as amplexus ability, seemingly shape longer forelimbs in males. Habitat did not affect sprint speed, but toads from the agrosystem habitat had a higher run rate, which could help increase vigilance or confound predators, probably related to habitat openness and/or human presence. For a given speed, males used greater run rates than females, probably because males encounter predators more often and face higher predator pressure. Finally, a negative relationship between sprint speed and run rate suggests that slower toads tend to use short runs, which may improve vigilance or help to confuse predators, while faster toads tend to use long runs, probably for fast escape from predators.
INTRODUCTION
Locomotor performance is often a key trait shaping animal fitness (Huey, Dunham & Overall, 1991; O’Steen, Cullum & Bennett, 2002; Miles 2004). An efficient locomotor performance optimizes refuge use (Martín & López, 2000), enhances prey acquisition (Budick & O’Malley, 2000; Higham, 2007)and aids escape from predators (Watkins, 1996; McGee et al., 2009). In fact, predator pressure shapes locomotor performance (Ingley et al., 2016). Locomotor performance is increased in open areas, where vulnerability to predators is higher (Vanhooydonck & Van Damme, 2003), and can directly increase survival (Jayne & Bennett, 1990; Husak, 2006a, b). Moreover, locomotor performance is positively related to social dominance (Garland, Hankins & Huey, 1990; Perry et al., 2004), as faster individuals can control larger territories (Peterson & Husak, 2006). It can also be favoured by sexual selection (Husak & Fox, 2008). Indeed, faster males are more able to defend females from other males (Husak, Fox & Van Den Bussche, 2008), and therefore have increased reproductive success (Husak et al., 2006).
Locomotor performance is closely related to morphology in vertebrates: larger fins in fish (Li et al., 2016), longer limbs in amphibians (Hudson, Brown & Shine, 2016), reptiles (Garland & Losos, 1994) and mammals (Day & Jayne, 2007), and longer wings in birds (Moreno-Rueda, 2003) all enhance locomotion. Even traits not primarily involved in locomotion, such as head shape, may affect performance (Edwards et al., 2016). Morphology is often shaped by locomotion (Botton-Divet et al., 2017; Higham, Gamble & Russell, 2017), and is thus under strong selection (Calsbeek, 2008). Moreover, for identical biometrics, a heavier body mass often impairs locomotion (Witter & Cuthill, 1993; Iriarte-Díaz, 2002). Consequently, animals often lose weight in the presence of predators, which could improve escape ability by means of increased locomotion performance (Pérez-Tris, Díaz & Tellería, 2004). For the same reason, an increase in female body weight caused by reproduction may impair locomotion performance (Magnhagen, 1991; Shaffer & Formanowicz, 1996; but see Zamora-Camacho et al., 2014 for an exception).
Hence, due to differential selection on sexes, females and males may differ in locomotor performance, with concomitant sexual dimorphism in morphological traits related to locomotion (Conradsen & McGuigan, 2015; Brandt et al., 2016). When one sex (typically males) is more conspicuous to predators (Promislow, Montgomerie & Martin, 1992), or displays a reproductive strategy that is more dependent on locomotor performance (Magnhagen, 1991), it is expected to show proportionally higher locomotor performance (Kaliontzopoulou, Bandeira & Carretero, 2013). Indeed, males often show better locomotor performance than females (Lailvaux, 2007; Herrel, Vasilopoulou-Kampitsi & Bonneaud, 2014). Locomotor performance demands physiological adjustments (Brijs et al., 2017), is energetically costly (reviewed by Halsey, 2016) and is thus involved in energy trade-offs (Zamora-Camacho et al., 2015). Consistent with evidence that sexual traits are costly (reviewed by Kotiaho, 2001), locomotor performance is often under sexual selection (Peterson & Husak, 2006; Husak & Fox, 2008).
Locomotor performance and morphology of locomotor traits can also vary geographically (Huey et al., 1990; Irschick et al., 2005), or even at microhabitat level within habitats, as locomotor performance (Calsbeek & Irschick, 2007) and related morphological traits (Colombo et al., 2016) can be adjusted to habitat use. In fact, the morphology of locomotor traits may determine habitat use (Tulli et al., 2016), and may differ between natural and human-altered habitats (Donihue, 2016). Moreover, predation risk may shape habitat differences in locomotor performance (Melville & Swain, 2000; Goodman, 2009), and animals can interpret human presence, a constant in some anthropized habitats, as predation risk (Frid & Dill, 2002). Human-altered habitats may deteriorate health (reviewed by Acevedo-Whitehouse & Duffus, 2009), alter behaviour (reviewed by Tuomainen & Candolin, 2011), reduce body condition (Martín et al., 2015; Gallego-Carmona, Castro-Arango & Bernal-Bautista, 2016) and even induce evolution (Smith & Bernatchez, 2007). Therefore, human-altered habitats may exert a negative impact on locomotion performance (Fahrig, 2007).
In the present study, I investigated locomotor performance of natterjack toads (Epidalea calamita), by comparing females and males from a natural pine grove and from human-altered agrosystem habitats. These toads move exclusively by means of intermittent runs, instead of leaping as in most anurans (Gómez-Mestre, 2014). Whilst locomotion in jumping anurans has long been studied (Reilly et al., 2016), running locomotion patterns in anurans (see Ahn, Furrow & Biewener, 2004 for an exception), and particularly morphological correlates, have received much less attention. Therefore, running locomotion in anurans remains an important gap in locomotor performance studies. In this context, I assessed the effects of morphology, sex and habitat on two parameters of toad locomotor performance, as well as the relationship between both: sprint speed and run rate (number of runs per metre; see below). Based on the aforementioned arguments, I expected locomotor performance to be related to morphology; in particular, I expected a positive relationship with limb length, and a negative relationship with body mass. Also, I predicted greater locomotor performance in males than in females, as males are more conspicuous to predators, and face higher predator pressure, mainly while searching for and defending their territories, and calling to attract females (Gómez-Mestre, 2014). Moreover, a different strategy is expected according to perceived predation risk in toads from the agrosystem habitat owing to stressful conditions in this human-altered habitat. Agrosystem E. calamita toads are indeed shorter-lived (but larger-bodied) than pine grove conspecifics (Zamora-Camacho & Comas, 2017).
MATERIAL AND METHODS
Epidalea calamita is a medium-sized [49–86 mm snout–vent length (SVL) in this system] bufonid toad that occurs in a fairly continuous wide area in central and south-west Europe (Gómez-Mestre, 2014). Within its distribution range, it is generally an abundant species, and, due to its ecological versatility, it occupies diverse habitats, from pristine environments to human-altered locations (Gómez-Mestre, 2014). Toads are terrestrial except briefly during amplexus, and are active mainly on wet, warm nights; while inactive they remain sheltered under logs, rocks or in holes they burrow in the ground (Gómez-Mestre, 2014). The period of toad activity varies geographically: they hibernate in winter and reproduce in late spring or early summer in northern cold habitats, but instead aestivate and mate in late winter or early spring in southern hot, dry climates (Gómez-Mestre, 2014). During the breeding season, males can be distinguished because they show blackish nuptial pads in their forelimbs, and their vocal sacs appear pinkish or purple (Gómez-Mestre, 2014). The larval stage is brief (often less than 2 months), and eggs are frequently laid in shallow, small, sunny, ephemeral ponds (Gómez-Mestre, 2014). Toads prey on diverse invertebrates, showing no clear selectivity (Boomsma & Arntzen, 1985).
Fieldwork was conducted between January and April 2015, in the natural pine grove Pinares de Cartaya (south-west Spain: 37°20′N, 7°09′W) and surrounding agrosystems, within the natural distribution range of toads. Winters in this area are moderately rainy and warm, usually with no frosts, and summers are dry and hot. Therefore, toads do not hibernate in this region, but skip summer aridity by aestivating. The pine grove used for this study was a stone pine (Pinus pinea) forest, with an undergrowth dominated by Cistus ladanifer, Rosmarinus officinalis and Pistacea lentiscus bushes. Although the autochthonous or anthropogenic origin of the vegetation in this habitat is unclear, it has been the dominant landscape at least over the last 4000 years (Martínez & Montero, 2004). Therefore, I considered this pine grove as a natural habitat for toads. In turn, agrosystems were located 5 km from the pine grove. They consisted of traditional extensive vegetable crops, which have been changed in recent decades to intensive strawberry, raspberry and orange plantations, among others. Crops are artificially irrigated during the summer, and manure, fertilizers, herbicides, pesticides and fungicides are added in different amounts according to landowners’ discretion. During the toad mating season, small temporary ponds where toads reproduce are abundant in both habitats.
I captured toads (37 females and 25 males in agrosystems; 30 females and 31 males in pine grove) while they were active on rainy nights, or actively searched for them while they were resting in their shelters, randomly in both habitats. However, as crops are private properties, in agrosystem habitats only public areas, such as meadows, areas of empty ground, tracks, ditches, etc., could be accessed. All toads captured were in their reproductive period: vocal sacs and nuptial pads were clearly visible in males, and eggs could be felt by gently pressing the lower abdomen of females. Since these toads drastically reduce activity after they reproduce (Gómez-Mestre, 2014), the ecological relevance of locomotion is maximal during that period. I took toads to a laboratory facility, where room temperature was controlled (19 °C). I measured SVL (from the tip of the snout to the urostyle), and forelimb and hindlimb length (from the insertion point of the limb to the tip of the longest toe) with a ruler to the nearest millimetre. I calculated limb ratio as forelimb length divided by hindlimb length. During captivity (and 24 h before the trials), I kept toads individually enclosed in plastic terraria (20 × 13 × 9 cm) with soaked peat as a substrate and a piece of opaque plastic as a shelter. In this way, all individuals were fully hydrated, controlling for the potential effects of different hydration states on toad locomotion (Preest & Pough, 1989).
On the day after capture, I emptied each toad’s bladder by gently but firmly pressing on its lower abdomen (Walvoord, 2003; Prates et al., 2013). This technique standardizes bladder water burden, which could affect locomotor performance, by reducing it to zero (Preest & Pough, 1989; Walvoord, 2003; Prates et al., 2013). I then immediately measured toad body mass (standard mass sensuRuibal, 1962: body mass of a fully hydrated amphibian with an empty bladder) with a balance (model CDS-100, precision 0.01 g). Toads were then returned to their terraria. One hour later, toads were individually recorded (with a Canon EOS 550D video camera, at 25 frames/s) while they were running on a brown cardboard linear runway (200 × 15 × 15 cm) divided into 10-cm stretches with white stripes stuck perpendicularly along the bottom of the runway. White stripes contrasted with brown cardboard, so each stretch could be perfectly distinguished in the video. Cardboard provided a surface rough enough for appropriate traction, as substrate may affect locomotor performance (Vanhooydonck et al., 2015). I placed a black background at the end of the runway, so that toads would mistake it for a shelter and were encouraged to move. Toads were released at the other end of the runway. Trials were always performed during the night, within the daily activity period of toads. A 60-W bulb 2.5 m above the centre of the runway provided the same illumination in all trials. Toads were chased constantly during the trials to stimulate their moving forward, until they reached the end of the runway. Since body temperature may affect amphibian motility (Preest & Pough, 2003), I verified that all toads performed the trials at the same body temperature (room temperature: 19 °C) by inserting a 1-mm-diameter thermocouple, connected to a Hibok 18 thermometer (precision: 0.1 °C) 8 mm inside their cloacae. As soon as possible after the trials, I released toads at the same spots where I had collected them. No toad suffered any visible damage or died as a consequence of this study.
Speed was calculated from videos with the software Tracker v.4.92, which allows a frame-by-frame video analysis. I calculated the time (precision: 0.01 s) that toads needed to cover each stretch, starting and finishing when the snout of the toad reached the perpendicular strips delimiting either end of each stretch (Martín & López, 2001; Zamora-Camacho et al., 2014). I thus calculated toad sprint speed (cm/s) in each stretch by dividing 10 cm (the length of every stretch) by the time (s) needed to cover it. I conducted analyses based on the = fastest stretch speed by each toad, because the objectives of this related to maximum speed (hereafter sprint speed). I also calculated average speed. However, because toads frequently stopped during the trials, and sprint speed is the most informative measure, results involving average speed are presented in the Supporting Information. I also counted the number of runs-and-stops (how many times toads stopped running in each trial) that each toad used to cover the whole runway, and divided it by the length of the runway in metres, to obtain run rate as the number of runs per metre for each individual.
As the data met the criteria of residual normality and homoscedasticity, parametric statistics were performed (Quinn & Keough, 2002). I did not include body mass and SVL at the same time in any model due to their high collinearity (r = 0.925; P < 0.001). Firstly, I conducted fully saturated ANOVAs to test the effects of sex, habitat and their interaction on morphometric variables (body mass, SVL, fore- and hindlimb length, and limb ratio; shown in the Supporting Information) as well as average speed (also shown in the Supporting Information), sprint speed and run rate. I then conducted a set of individual ANCOVAs to assess the relationships between each morphometric variable (body mass, SVL, forelimb length, hindlimb length and limb ratio, each included as a covariate in an individual ANCOVA) plus run rate (included as a covariate in an individual ANCOVA) on sprint speed (dependent variable), controlling for sex, habitat (categorical variables) and their interaction. In each of these ANCOVAs, only one covariate was included at a time. A similar set of ANCOVAs was used to test the relationships of morphometric variables plus run rate (included as covariates in individual ANCOVAs) on average speed (dependent variable), controlling for sex, habitat (categorical variables) and their interaction (Supporting Information). Finally, I performed a similar set of ANCOVAs to test the effects of morphometric variables plus sprint speed (included as covariates in individual ANCOVAs) on run rate (dependent variable), in which sex, habitat (categorical variables) and their interaction were also controlled for. All analyses involving fore- or hindlimb length were controlled for SVL, introducing it as a covariate. Statistical analyses were conducted in the software Statistica 8.0 (StatSoft Inc., Tulsa, OK, USA).
RESULTS
Body mass (Supporting Information Table S1, Fig. S1a) and SVL (Table S1, Fig. S1b) were greater in agrosystem toads than in pine grove toads. The interaction was significant for body mass (Table S1, Fig. S1a), which was similar in both sexes in the pine grove, while females were heavier than males in agrosystems. Forelimbs (Table S1, Fig. S1c) and hindlimbs (Table S1, Fig. S1d) were longer in males, although they did not differ between habitats. The interaction was nearly significant for forelimb length (Table S1, Fig. S1c), and significant for hindlimb length (Table S1, Fig. S1d), sex differences being greater in agrosystem toads. Limb ratio was greater in females than in males, with no effect of habitat (Table S1, Fig. S1e), so male forelimbs were relatively shorter than hindlimbs. Sprint speed was higher in males (F1,116 = 50.420, P < 0.001; Fig. 1a), with no effect of habitat (F1,116 = 0.235, P = 0.629; Fig. 1a) or sex × habitat interaction (F1,116 = 0.348, P = 0.557; Fig. 1a). Results were qualitatively similar for average speed (Table S1, Fig. S1f). Meanwhile, run rate was higher in agrosystems (F1,116 = 7.042, P = 0.009; Fig. 1b), but did not differ between sexes (F1,116 = 0.131, P = 0.0.718; Fig. 1b), and the sex × habitat interaction was non-significant (F1,116 = 0.480, P = 0.490; Fig. 1b).
Sex and habitat differences in sprint speed (a) and run rate (b). Sample sizes are indicated in (a). Vertical bars represent standard errors.
Among all morphometric variables, only hindlimb length showed a significant, positive relationship with sprint speed (Table 1). Sex differences remained significant in this model (Table 1). In all cases, introducing morphometric variables and run rate as covariates resulted in higher sprint speeds in males with no effect of habitat (Table 1). Sprint speed was negatively related to run rate (Tables 1 and 2). Results were qualitatively similar for average speed, although the effect of hindlimb length was not significant in this case (Supporting Information, Table S2).
Individual models testing the effects of body mass, snout–vent length, fore- and hindlimb length, limb ratio, and run rate on sprint speed
| Co-variables | Co-variable F1,115 | Co-variable β-value | Sex F1,115 | Habitat F1,115 | Sex × Habitat F1,115 |
|---|---|---|---|---|---|
| Body mass | 0.338NS | 0.050 | 50.380*** | 0.435NS | 0.222NS |
| Snout–vent length | 1.747NS | 0.106 | 51.436*** | 0.616NS | 0.434NS |
| Forelimb length | 0.770NS | 0.091 | 46.338*** | 0.661NS | 0.305NS |
| Hindlimb length | 5.617* | 0.346 | 10.817** | 0.859NS | 0.356NS |
| Limb ratio | 1.528NS | −0.113 | 28.394*** | 0.334NS | 0.277NS |
| Run rate | 53.543*** | −0.483 | 69.037*** | 1.401NS | 0.057NS |
Sex, habitat and their interaction were controlled for in all models. F- and β-values are indicated. Note that the effects of limb length were controlled for snout–vent length, so degrees of freedom were 1 and 114. NSNon-significant
P < 0.05
P < 0.01
P < 0.001. Significant results are in bold type.
Run rate was not affected by any morphometric variable (Table 2), but showed a significant, negative relationship with sprint speed (Tables 1 and 2). In all cases, introducing morphometric variables as covariates resulted in a higher run rate in agrosystem toads, with no effect of sex (Table 2). Remarkably, when sprint speed was introduced as a covariate, habitat differences in run rate persisted, and sex differences arose, run rate being higher in males (Table 2, Fig. 2).
Individual models testing the effects of body mass, snout–vent length, fore- and hindlimb length, limb ratio, and sprint speed on run rate
| Co-variables | Co-variable F1,115 | Co-variable β-value | Sex F1,115 | Habitat F1,115 | Sex × Habitat F1,115 |
|---|---|---|---|---|---|
| Body mass | 0.713NS | −0.084 | 0.214NS | 7.710** | 0.276NS |
| Snout–vent length | 1.799NS | −0.125 | 0.174NS | 8.435** | 0.268NS |
| Forelimb length | 0.008NS | 0.011 | 0.180NS | 8.335** | 0.245NS |
| Hindlimb length | 0.113NS | −0.059 | 0.002NS | 8.450** | 0.325NS |
| Limb ratio | 0.161NS | 0.043 | 0.008NS | 7.112** | 0.447NS |
| Sprint speed | 53.542*** | −0.658 | 13.424*** | 8.218** | 0.188NS |
Sex, habitat and their interaction were controlled for in all models. F- and β-values are indicated. Note that the effects of limb length were controlled for snout–vent length, so degrees of freedom were 1 and 114. NSNon-significant; §marginally non-significant
* P < 0.05
P < 0.01
P < 0.001. Significant results are in bold type.
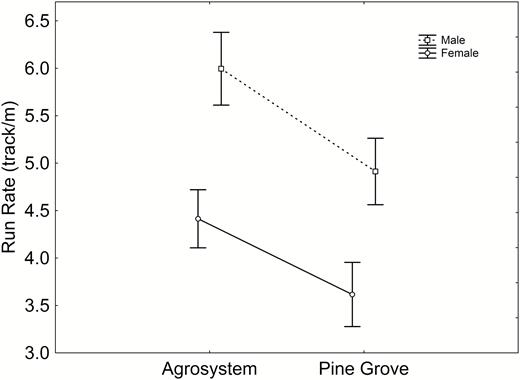
Sex and habitat differences in run rate when sprint speed was controlled for. Sample sizes are indicated in Figure 1(a). Vertical bars represent standard errors.
DISCUSSION
Clarifying the relationships between morphology and locomotion provides a fundamental framework for advancing evolutionary ecology. The results herein demonstrate a positive relationship between sprint speed and hindlimb length. This was an expected result, as several jumping anurans show a positive effect of hindlimb length on locomotor performance (Tejedo, Semlitsch & Hotz, 2000; Choi, Han Shim & Ricklefs, 2003; Johansson, Lederer & Lind, 2010), probably related to more massive muscles (James et al., 2005). Therefore, hindlimbs are also suggested to be the main factor responsible for toad propulsion in this running species. No other morphological variable proved to affect toad sprint speed. Neither forelimb length nor limb ratio showed a relationship with sprint speed, which reinforces the idea that toad sprint speed relies mainly on hindlimbs. The finding that SVL had no effect on sprint speed contrasts with that of Llewelyn et al. (2010), who detected a positive relationship between body length and sprint speed in terrestrial Rhinella marina toads. Moreover, contrary to expectation, body mass did not have a negative effect on sprint speed. Other studies on anuran locomotor performance also found no relationship with body mass, or even a positive relationship, during terrestrial locomotion (Wilson, Franklin & James, 2000; Álvarez & Nicieza, 2002).
Males were faster than females. Accordingly, male hindlimbs were longer, and a lower male limb ratio indicates that hindlimbs in males are proportionally longer than forelimbs. Similarly, other anurans, such as Xenopus tropicalis frogs, show sexual dimorphism in morphology and locomotor performance, males having longer limbs and proportionally higher burst speeds (Herrel et al., 2012). However, males were still faster when hindlimb length was controlled for, which suggests that other factors, such as greater muscle mass in male toads (Lee & Corrales, 2002; Zhiping, 2013), may drive sex differences in sprint speed. The finding that the longer forelimbs of males were not related to higher sprint speed suggests a different function of forelimbs in both sexes besides locomotion. Sex differences in forelimb length may be caused by their role during amplexus in males (Clark & Peters, 2006; Navas & James, 2007). Interestingly, males and females did not differ in SVL or body mass, which showed no effect on sprint speed.
Sprint speed was similar in agrosystem and natural pine grove toads. Accordingly, neither forelimb nor hindlimb length differed between habitats, despite a greater body size in agrosystem toads, which was controlled for (by including SVL as a covariate) in all models testing the effects of limb length. Remarkably, significant or nearly significant sex × habitat interactions for body mass as well as forelimb and hindlimb length resulted in higher sex differences in agrosystem toads. In this system, agrosystem toad lifespans are shorter (probably as a consequence of high mortality in stressful environmental conditions), while indicators of reproductive investment are higher (Zamora-Camacho & Comas, 2017). The result that sexual dimorphism is more accentuated in agrosystem toads could suggest greater sexual selection in agrosystem toads (Zamora-Camacho & Comas, 2017), a probable consequence of reduced lifespan according to life-history theory (Stearns, 2000): reproduction is evolutionarily prioritized under circumstances that shorten lifespan.
Run rate was significantly higher in agrosystem toads, so they use more runs than pine grove conspecifics to cover a given distance. Toads could save energy (Edwards & Gleeson, 2001) and enhance endurance (Weinstein & Full, 1999) by increasing locomotion intermittence. In fact, locomotion is an energetically costly trait for anurans (Walton & Anderson, 1988). However, the energetic cost of walking for anurans proved to be relatively low (Walton, Peterson & Bennett, 1994). Moreover, toads from both habitats have similar prey resources in this system (Zamora-Camacho & Comas, 2017), which does not support an energy limitation triggering higher run rate in agrosystem toads. McLaughlin & Grant (2001) detected no effect of intermittent locomotion on energy expenditure or endurance in brook charr (Salvelinus fontinalis). Contrastingly, intermittent locomotion in desert iguanas (Dipsosaurus dorsalis) increases metabolic costs (Hancock & Gleeson, 2005). Therefore, the energy basis of intermittent locomotion remains unclear in this case. An alternative and not mutually exclusive explanation is that intermittent locomotion may increase chances for vigilance against predators (McAdam & Kramer, 1998). Indeed, Octodon degus degus (Vásquez, Ebensperger & Bozinovic, 2002) and Psammodromus algirus lizards (López & Martín, 2013) increase vigilance by interrupting locomotion in open habitats, where exposure to predators is greater. Therefore, agrosystem toads could have enhanced vigilance behaviour due to openness in such habitat. Also, frequent stops in agrosystem toads could allow them to remain unseen or to confound predators via intermittent movement patterns (Martell & Dill, 1995). Accordingly, animals can perceive human presence, a constant in agrosystems, as a form of predator pressure (Beale & Monaghan, 2004).
Run rate was similar in both sexes. However, when sprint speed was controlled for, males showed a higher run rate than females, which indicates that, for a given speed, males used more runs than females. Assuming that intermittent locomotion increases opportunities for vigilance against predators in this species (Trouilloud, Delisle & Kramer, 2004), this finding, along with increased male speed, reinforces the idea that males are better suited for predator avoidance, and probably experiencegreater predator pressure. These differences are a probable consequence of E. calamita males performing more conspicuous activities in territory defence (Miaud, Sanuy & Avrillier, 2000) or mating (Sinsch, 1988).
I also detected an interesting negative relationship between sprint speed and run rate. An individual’s escape strategy seems to consist of a continuum from slow, multiple short movements to a few fast, long runs. Slower toads may remain unnoticed by reducing movements, to confound predators by increasing the number of short runs (Martell & Dill, 1995), or to increase predator vigilance by frequent stops (McAdam & Kramer, 1998). Conversely, faster toads may rely on their speed and use longer runs to escape predators or find a shelter as soon as possible (Lima & Dill, 1990). Sprint speed proved highly constrained by hindlimb length. On the other hand, the fact that run rate was unaffected by morphology suggests that it could be a behavioural trait rather than a morphology-limited ability, which contrasts with other findings that morphology affects locomotion (Miller, Samuk & Rennison, 2016). This negative relationship between sprint speed and run rate thus suggests that locomotion mode in this running toad is a combination of morphology-limited sprint ability influencing behavioural decisions of locomotion pace.
CONCLUSIONS
In summary, sprint speed was directly related to hindlimb length, but not to forelimb length, SVL or body mass in natterjack toads. Males were faster than females, and had longer limbs, but sex differences in sprint speed were not explained solely by longer limbs of males. Males’ longer forelimbs were not related to higher speed, so other factors, probably use of forelimbs during amplexus, seem to drive differences in forelimb length. Habitat had no effect on sprint speed, but run rate was higher in agrosystem toads, which suggests increased vigilance against predators, probably related to habitat openness and/or to human presence. For a given speed, males showed higher run rates than females, which, along with higher speed, suggests a greater effect of predator pressure on shaping male locomotion. Finally, a negative relationship between sprint speed and run rate suggests that locomotion pace is affected by sprint speed abilities: slower toads tend to use short runs, which probably helps them to remain unseen or confound predators, while faster toads tend to use long runs, probably to flee from predators or find a shelter as soon as possible.
ACKNOWLEDGEMENTS
The author was partly supported by a Fundación Ramón Areces postdoctoral fellowship, and by a Juan de la Cierva-Formación postdoctoral fellowship from the Spanish Ministerio de Economía, Industria y Competitividad. Toad capture was conducted according to permits by the Junta de Andalucía issued to the author (Reference AWG/MGD/MGM/CB). Comments by six anonymous reviewers improved the manuscript. This research did not receive any specific grant from funding agencies in the public, commercial or not-for-profit sectors.
SUPPORTING INFORMATION
Additional Supporting Information may be found in the online version of this article at the publishers web-site:
Table S1. Individual ANOVAs testing the effect of sex, habitat, and their interaction on body mass, snoutvent length, fore- and hindlimb length, limb ratio, and average speed. Note that fore- and hind limb length were controlled for snoutvent length, so degrees of freedom were 1 and 115. F-values are indicated. NSNon-significant; §marginally non-significant; *P < 0.05; ***P > 0.001. Significant results are in bold type.
Table S2. Individual models testing the effects of body mass, snoutvent length, fore- and hind limb length, limb ratio, and run rate on average speed. Sex, habitat and their interaction were controlled for in all models. F- and ß-values are indicated. Note that the effects of limb length were controlled for snoutvent length, so degrees of freedom were 1 and 114. NSNon-significant; §marginally non-significant; *P < 0.05; **P < 0.01; ***P < 0.001. Significant results are in bold type.
Figure S1. Sex and habitat differences in body mass (a), SVL (b), forelimb length (c), hindlimb length (d), limbratio (e) and average speed (f). Fore- and hindlimb length were controlled for SVL. Sample sizes are indicated in(a). Vertical bars represent standard errors.
