


Abstract
• Background and Aims Neutral red (NR), a lipophilic phenazine dye, has been widely used in various biological systems as a vital stain for bright-field microscopy. In its unprotonated form it penetrates the plasma membrane and tonoplast of viable plant cells, then due to protonation it becomes trapped in acidic compartments. The possible applications of NR for confocal laser scanning microscopy (CLSM) studies were examined in various aspects of plant root biology.
• Methods NR was used as a fluorochrome for living roots of Phaseolus vulgaris, Allium cepa, A. porrum and Arabidopsis thaliana (wild-type and transgenic GFP-carrying lines). The tissues were visualized using CLSM. The effect of NR on the integrity of the cytoskeleton and the growth rate of arabidopsis primary roots was analysed to judge potential toxic effects of the dye.
• Key Results The main advantages of the use of NR are related to the fact that NR rapidly penetrates root tissues, has affinity to suberin and lignin, and accumulates in the vacuoles. It is shown that NR is a suitable probe for visualization of proto- and metaxylem elements, Casparian bands in the endodermis, and vacuoles in cells of living roots. The actin cytoskeleton and the microtubule system of the cells, as well as the dynamics of root growth, remain unchanged after short-term application of NR, indicating a relatively low toxicity of this chemical. It was also found that NR is a useful probe for the observation of the internal structures of root nodules and of fungal hyphae in vesicular–arbuscular mycorrhizas.
• Conclusions Ease, low cost and absence of tissue processing make NR a useful probe for structural, developmental and vacuole-biogenetic studies of plant roots with CLSM.
INTRODUCTION
Neutral red (NR; 3-amino-7-dimethylamino-2-methylphenazine), a lipophilic free base, has been widely used in various biological systems for almost a century. The main application of NR is its use as a vital stain because it penetrates in viable cells and accumulates in lysosomes of animal (Essig-Marcello and van Buskirk, 1990), and in vacuoles of plant (Guilliermond, 1929; Timmers et al., 1995) and in fungus cells (Dixon et al., 1999). As a lysosomal stain, NR was implicated as a biomarker for environmental toxicology studies of soils (Weeks and Svendsen, 1996; Svendsen et al., 2004). NR in its unprotonated form easily penetrates the plasma membrane and tonoplast. Due to protonation in acidic compartments the dye is trapped in vacuoles (Oparka, 1991; Timmers et al., 1995; Ehara et al., 1996). Thus, NR is used for plant tissues as an acidotropic stain accumulating in vacuoles (Smith and Raven, 1979; Timmers et al., 1995; Di Sansebastiano et al., 1998; Kawai et al., 1998; Ngo et al., 2005) and the peri-arbuscular space of mycorrhizal roots (Guttenberger, 2000a, b) as well as a general vital stain (Strugger, 1935; Stadelmann and Kinzel, 1972; Crippen and Perrier, 1974; Nishimura, 1982; Timmers et al., 1995; Nobel et al., 1998). NR is known to stain various compounds due to its affinity for lipophilic structures (suberin, Conn, 1977; Lulai and Morgan, 1992; lipids, Conn, 1977; phenolic substances, Stadelmann and Kinzel, 1972), ionic interaction of the protonated dye with negative charges (cell walls, Stadelmann and Kinzel, 1972), intercalation (DNA, Zhang et al., 2004), and chemical binding (lignin, Conn, 1977). The acidotropic staining is referred to as specific staining in contrast to non-specific staining of cell walls. Accumulation of NR in vacuoles can also be due to interactions with phenolic substances dissolved in the cell sap (‘full cell saps’), which frequently give rise to stained globular or dendritic structures in the cell sap (Stadelmann and Kinzel, 1972).
As a relatively non-toxic compound, NR has been widely used for root growth studies. Particularly, after pre-staining the root with NR, new growth of unstained root portions can be analysed (Schumacher et al., 1983; Schumacher and Smucker, 1984). These authors showed that NR did not have a significant effect on root growth or respiration rate (Schumacher et al., 1983). This method is currently widely used either for root growth studies (Watkin et al., 1998) or computerized determinations of root length or diameter (Bouma et al., 1997, 2000; Bates and Lynch, 2000). Other studies also demonstrated the non-toxic effect of NR on plant root systems (Guttenberger, 2000b).
Fluorescence properties of NR were explored first by animal and later by plant physiologists. NR can be used for the determination of pH in rat brains (LaManna and McCracken, 1984) and vacuoles of plant tissues (Timmers et al., 1995; Wilson et al., 1998). NR has a wide emission spectrum from <450 nm to >700 nm with the maximum ranging from 550 nm to 650 nm (Chen et al., 1998). The maximum emission occurs at pH 7·06, which becomes reduced by 50 % at pH 8·00 (Chen et al., 1998). NR was used as a fluorochrome for the identification of suberized tissues (Lulai and Morgan, 1992; De Simone et al., 2003a, b). The latter authors used the stain to detect the suberized hypodermis on stem sections of some tree species.
Lateral root primordia in arabidopsis develop from pericycle cells adjacent to protoxylem poles. To recognize the stages of lateral root development, the analysis is usually done on roots laying on a slide in the protoxylem plane (Malamy and Benfey, 1997). In previous studies of lateral root development in arabidopsis (Dubrovsky et al., 2000, 2001) it was noticed that propidium iodide, commonly used for arabidopsis roots as an apoplasmic tracer (Van den Berg et al., 1995), does not penetrate into the vascular cylinder of the differentiation zone of an intact living root. This shortcoming prompted us to search for a permeable fluorochrome, preferably not toxic, that can be appropriate for various studies of plant roots and, particularly, for the analysis of lateral root development using CLSM. Soran and Lažar (1965) reported that NR very rapidly penetrates maize roots tissues, including the pericycle. This observation indicated that NR can be used for the analysis of internal tissues of plant roots. In the current study is an evaluation of the possible applications of NR in CLSM studies of the internal root structure. The use of NR in transgenic arabidopsis lines carrying GFP and enhancer trap lines have been tested in addition to other plants. Also discussed are possible limitations of using NR. As far as is known this is the first report of the use of NR as a probe for CLSM studies of intact plant organs.
MATERIALS AND METHODS
Plant material
The Arabidopsis thaliana lines used were wild-type Col-0 and Ler, scr-3 (CS3997) mutant (Fukaki et al., 1998), enhancer trap lines J0121and J1701 (http://www.plantsci.cam.ac.uk/Haseloff/Home.html) and other transgenic lines: GFP-mammalian microtubule-associated protein 4 (GFP-MAP4) (Marc et al., 1998), mouse talin actin-binding domain fused to the C-terminus of GFP, GFP-mTn (Kost et al., 1998), GFP-actin-binding domain 2 (GFP-FABD2) (Ketelaar et al., 2004; Voigt et al., 2005) and PIN-FORMED1:GFP (PIN1:GFP) (Benková et al., 2003). These lines were selected to test general staining properties of NR (Col-0 and scr-3) and its effect on actin cytoskeleton (GFP-mTn and GFP-FABD2) and microtubule network (GFP-MAP4). Other GFP expressing lines (J0121, J1701 and PIN1:GFP) were used to test the possibility for cross-talk between green emission of GFP and red emission of NR (see below), as well as to examine how appropriate NR is for developmental studies. The seeds were surface sterilized for 10 min in 60 % (v/v) commercial bleach and 0·08 % (w/v) Triton X-100, rinsed four times with sterile distilled water and maintained at 4 °C for 48 h. Seeds were plated on 20 % Murashige and Skoog medium (MS), pH 5·8, supplemented with 1 % (w/v) sucrose and solidified with 0·8 % bacto-agar (Difco Laboratories, Detroit, MI, USA). Petri dishes were maintained in a vertical position at 23 °C under an 8-h dark/16-h light cycle (105 μmol m−2 s−1). To prevent any root damage, seedlings were selected with the root system growing on the agar surface.
Phaseolusvulgaris ‘Negro Jamapa’ seeds were surface sterilized with ethanol for 1 min and subsequently with 20 % bleach for 5 min and washed six times with sterile water. Seeds were germinated aseptically in Petri dishes containing wet filter paper to ensure germination. Germinated seeds were transferred to liquid Fahraeus medium (Fahraeus, 1957). The roots were inoculated withRhizobium etli, CE3 (Cárdenas et al., 2006).
Allium cepa seeds were germinated on filter paper moistened with distilled water. Growth and culture conditions of mycorrhizal plants (Glomus mosseae and Allium porrum) were described earlier (Guttenberger, 2000a, b).
Toxicity test
Arabidopsis plants were grown for 5 d on 0·2× MS medium, pH 5·8, and, for the toxicity test, transferred to the same agar medium containing filter-sterilized NR (1 μm and 4 μm; Merck, Darmstadt, Germany). Alternatively, roots of intact plants, 5 d after germination (dag), were incubated for 30 min in liquid 0·2× MS medium containing NR (1 μm and 4 μm) and then transferred to NR-free 0·2× MS medium. Root growth increments were recorded each 24 h. Experiments were repeated at least twice. Growth conditions were the same as indicated above.
The actin cytoskeleton and the cortical microtubule network are very sensitive to toxic compounds (see the Results section). Therefore, the effect of NR on the cytoskeleton was investigated. Oryzalin (1 μm; Sigma), an inhibitor of microtubule polymerization (Hugdahl and Morejohn, 1993), served as a positive control for disruption of the microtubule network in living arabidopsis (Col-0 wild-type) roots.
Staining
All observations were done on living roots of intact arabidopsis seedlings, 6–8 dag unless indicated otherwise, on whole roots of A. cepa 5 dag, and on excised portions of living roots of P. vulgaris 13 dag. Day 0 of germination was considered the day when seeds were plated on 0·2× MS medium. NR was used for the preparation of 4 mm stock solution in water and kept at 4 °C for 3 weeks. After that period a new stock was used. The final concentration of NR ranged from 0·4 μm to 40 μm and mostly was 1 μm or 4 μm. Only freshly prepared solutions were used. The pH of the staining solution was 5·8 (0·2× MS medium, optimal for growth) or 8·0 (for minimal background staining). At pH 8·0 the staining solution solvent consisted of (a) 0·1 m potassium phosphate buffer, (b) 1 m potassium phosphate buffer, both prepared in water, (c) 0·2× MS medium supplemented with 20 mm potassium phosphate buffer, or (d) medium (c) supplemented with 50 mm KNO3. Since for arabidopsis roots background staining was acceptable at pH 5·8, the staining solution was mostly prepared in 0·2× MS medium. For staining of arabidopsis roots, 1–10 min of incubation was sufficient. In some cases material was kept in NR solution for up to 3·5 h. When roots were stained with a very low concentration of NR (0·4 μM, pH 5·8 and 8·0) the time required for staining was 20–30 min. Phaseolus vulgaris 2-cm root portions were incubated with NR for 10–30 min (pH 5·8). In each particular case, the staining time is indicated in the figure legends. For comparison, some material was stained with 1–10 μg ml–1propidium iodide (Sigma) for 10–30 min. Mycorrhizal roots were stained (0·4 μm NR) and examined according to Guttenberger (2000a). Plant material was mounted directly in the solution of NR or propidium iodide on a slide which was wrapped three times with two 1-mm-thick strips of parafilm 45 mm apart from one another and covered by a 24 × 50 mm coverslip (No. 1). When observations were done on an inverted microscope, after mounting, the coverslip was fixed in its position by another two thin strips of parafilm.
Spectral characteristics of NR
At pH 7·5 NR has a wide excitation spectrum ranging from 450 to 550 nm (Zhang et al., 2004) and a wide emission spectrum with the maximum ranging from 550 to 650 nm (Chen et al., 1998). The reported emission spectra of NR include significant emission between 500 and 550 nm (green). In the current work, GFP-expressing transgenic lines were used. It is known that GFP emission peaks at 509 nm (Tsien and Wagooner, 1995), indicating that NR and GFP emissions overlap. This is why before observing tissues expressing GFP it was necessary to verify which tissues in non-transgenic material emit green fluorescence when NR is used. In wild-type Col-0 seedlings, neither Casparian bands and xylem nor vacuoles emitted significant green fluorescence. To avoid the possibility of cross-talk, the laser power was maintained at the level that kept green fluorescence from NR minimal or absent. In most cases this approach permitted NR and GFP emissions to be detected separately.
The emission spectra of plant material stained with NR have not been reported. The Zeiss LSM 510 Meta microscope made it possible to acquire a series of images of the same object area each taken with different emission wavelengths in 10-nm steps. This stack is called a lambda stack (Dickinson et al., 2001). A lambda stack of various tissues and sub-cellular compartments (substrates) reacting with NR (4 μm diluted in 0·2× MS medium at pH 5·8; excitation at 488 nm) was acquired and fluorescence intensities plotted against wavelengths to obtain emission curves. Considering these spectra, NR and GFP were detected with the emission filters BP 565–615 and BP 500–530, respectively.
Microscopy and image acquisition
Confocal images were acquired on an upright Leica TCS4D (Leica Lasertechnik Heidelberg, Germany) and an inverted Zeiss LSM 510 Meta (Carl Zeiss, Jena, Germany) microscopes. Leica ×25 (NA 0·75) oil immersion, Leica ×63 (NA 0·9) water immersion and Zeiss ×40 (NA 0·75, Plan Neofluar) dry and ×63 (NA1·2, C-Apochromat) water immersion objectives were used. With a Leica miscroscope, 564 and 488 nm lines of a Kr/Ar laser were used. With the Zeiss microscope, 543 nm line of a He/Ne laser and 488 nm of an Ar laser were used for NR and GFP excitation.
To further decrease cross-talk and improve spectral separation during image acquisition of samples containing GFP and NR, commonly the sequential scan (time-separated data collection for each channel) was used, and different excitation wavelengths were employed (488 nm and 543 nm for GFP and NR, respectively). For transgenic lines, mutants and wild-type plants no autofluorescence was detected (Supplementary Information, Fig. SF1).
Each single section represents an average of four scans. Some reported figures represent maximum intensity projections of a stack of confocal optical sections. To obtain a transverse section (a section in the x–z plane) a longitudinal optical section was acquired, the zone of interest was detected and a tracing line perpendicular to the root axis was set over the image. Then, with the Zeiss LSM 510 Meta microscope acquisition software, images along the tracing line of increasing depth of focus were taken and subsequently visualized at a 90° angle. At progressively deeper depth of focus, the fluorescence signal decreased progressively. This explains why transverse sections of the images were always brighter at the top and dim at the bottom. For image analysis, the Zeiss Image Examiner software, version 3·2 and Image J (National Institutes of Health, Bethesda, MD; http://rsb.info.nih.gov/ij/) were used.
RESULTS
Spectral characteristics of NR
To allow unequivocal distinction of signals from NR and GFP, emission spectra of NR-stained structures were collected (Fig. 1). These data confirmed the wide emission spectra observed earlier and showed that the highest emission peak was 590 nm for vacuoles and 600 nm for protoxylem, metaxylem and Casparian bands. It was surprising to find that the emission spectra recorded in stained arabidopsis tissues showed up to five peaks or shoulders.
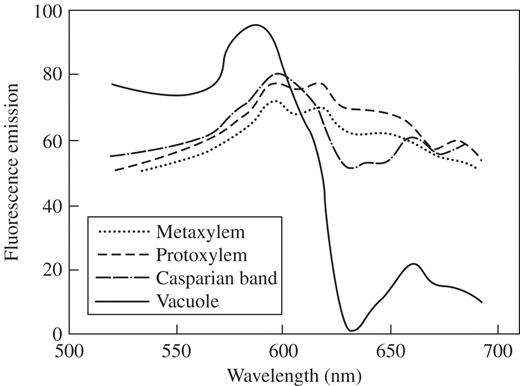
Emission spectra of various NR-stained (4 μm, pH 5·8) Arabidospsis thaliana, Col-0, root tissues and sub-cellular compartments taken with the meta-channel option of the Zeiss LSM 510 Meta microscope; excitation at 488 nm. In each case the same area was analysed. Spectra of protoxylem and metaxylem were taken in young and mature differentiation zones, respectively. Spectra of Casparian bands and vacuoles were taken in mature differentiation and transition zones, respectively.
NR toxicity
To study the potential toxicity of NR at the concentrations used for CLSM studies, arabidopsis root growth dynamics were analysed (Fig. 2). Roots grown in 0·2× MS medium supplemented with 4 μm NR (pH 5·8) stopped growing and did not recover for at least 5d of incubation in the medium (Fig. 2). However, after 5 d of growth in the medium supplemented with 1 μm NR (pH 5·8), roots were only 18 % shorter (but still significant, P < 0·05) than the roots grown in normal medium (Fig. 2). Interestingly, short-term treatment of 30 min in 4 μm NR (Fig. 2) or 1 μm NR (data not shown) did not inhibit subsequent root growth. These data indicate that the toxicity of NR is relatively low at 1 μm, which is the concentration sufficient to visualize Casparian band, xylem elements or vacuoles under CLSM.
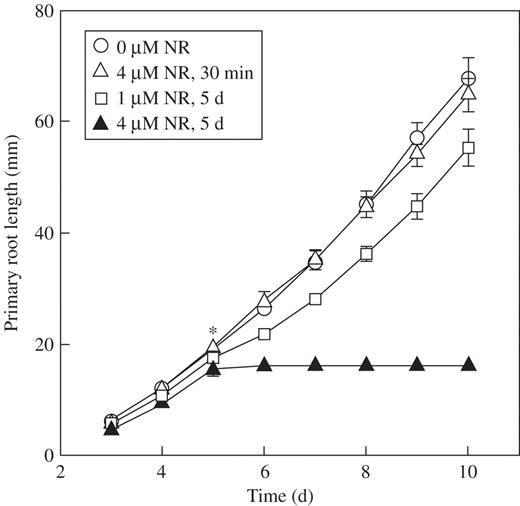
Root growth dynamics in Arabidopsis plants, Col-0, subjected to short-term (30 min) and long-term (5d) treatment with NR (pH 5·8). Asterisk indicates the time of short-term treatment or time of transfer of the roots into medium supplemented with NR. Data are means ± 95 % confidence interval (n = 11). The experiment was repeated at least twice.
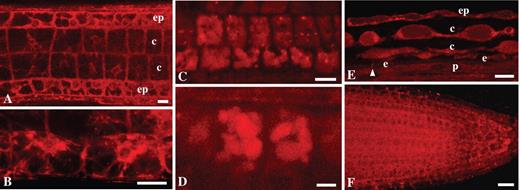
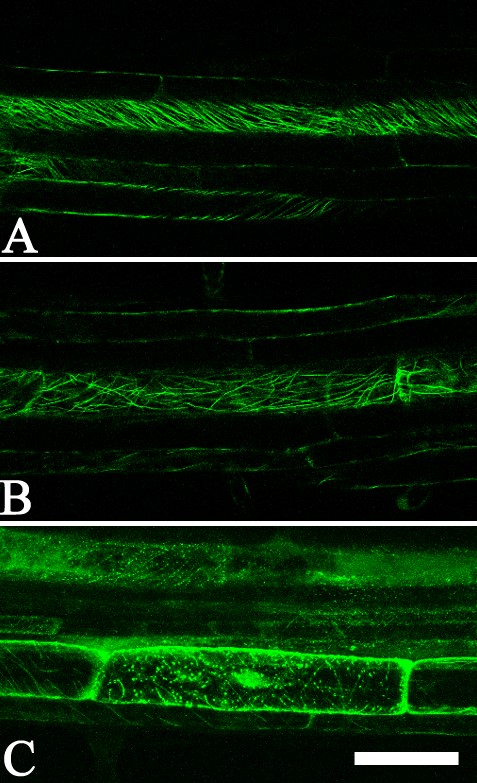
Both the microtubule network and the actin cytoskeleton are very sensitive to disturbance and pharmacological treatments (for root cells, see Baluška et al., 1993, 1996, 2001a; Sivaguru et al., 1999; Barlow and Baluška, 2000). To test whether NR affects the microtubule network or the actin cytoskeleton in living roots, a comparative study was made of the roots of various transgenic lines where microtubules and the actin cytoskeleton were observed. Under the influence of NR, no significant differences were detected in the distribution of cortical microtubules in the elongated cells (Fig. 3A, B) of the GFP-MAP4 line [where GFP is fused to the microtubule-binding domain of the mammalian microtubule-associated protein 4 (MAP4) gene; Marc et al., 1998]. When the roots of this line were incubated for 2 h with 1 μm oryzalin (pH 5·8) changes in the orientation of cortical microtubules were observed. The 4-h treatment induced complete disorganization of microtubules (Supplementary Information, Fig. SF2). Incubation of the roots with NR did not have any of these effects. Also possible changes in the actin cytoskeleton induced by NR (1 μm and 4 μm, pH 5·8) were tested. There were no significant changes in the actin cytoskeleton, either in cortical cells of the transition zone of arabidopsis roots or in the young differentiation zone. In GFP-mTn and GFP-FABD2 lines, cells in the transition zone (root portion between the meristem and rapid elongation zone; Baluška et al., 2001b), both with and without NR treatments, had a similar distribution of F-actin arrays (Fig. 3C, D, H, G), suggesting that NR does not affect the actin cytoskeleton. Similarly, there were no significant differences in the actin cytoskeleton detected in recently elongated cortical cells in the roots of a GFP-ABD2 line (Fig. 3E, F). These observations indicate that 1 μm and 4 μm of NR is not cytotoxic for roots of arabidopsis when applied for up to 60 min.
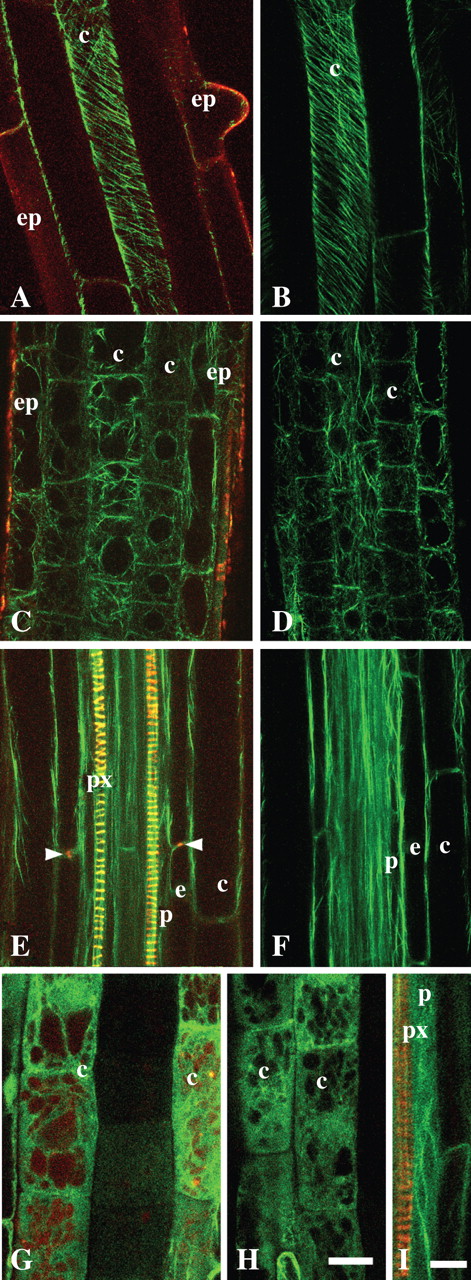
Cortical microtubule array and actin cytoskeleton in Arabidopsis roots in relation to application of NR. (A and B) Cortical microtubules in GFP-MAP4 roots; cortical cells of the young differentiated zone in roots stained with 1 μm NR (A) and without staining (B). (C–F) Actin cytoskeleton in GFP-ABD2 roots; the cells of the transition zone (C and D) and differentiation zone (E and F) stained with 1 μm NR (C and E) and without staining (D and F). (G–I) Actin filaments in GFP-mTn line, in the transition zone (G and H) and pericycle adjacent to protoxylem within the differentiation zone (I) stained with 4 μm (G), 1 μm (I) or without staining (H). All panels are single optical sections. (A–D, G and H) Tangential longitudinal optical sections; (E, F and I) longitudinal median optical sections of roots positioned in the protoxylem plane. Staining time was 30–60 min. Arrowheads indicate Casparian band. ep, Epidermis; c, cortex; e, endodermis; p, pericycle; px, protoxylem. In all cases pH of NR solution was 5·8. Scale bars: H and I = 20 μm. Magnification on panels (A–H) is the same.
Staining kinetics
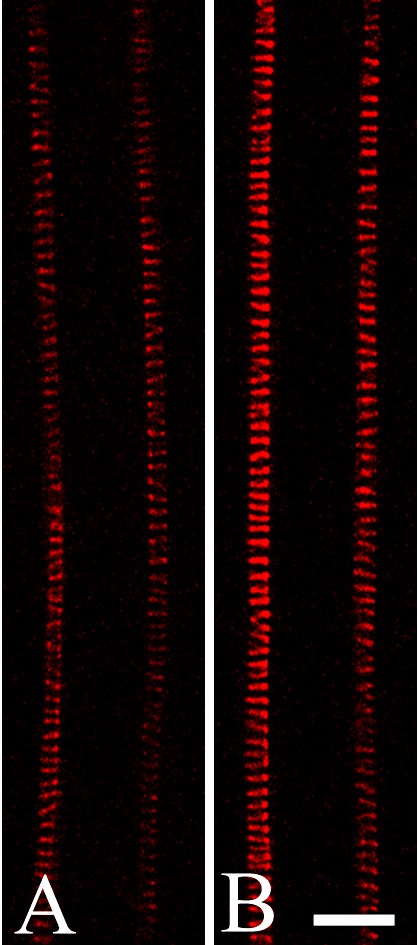
Upon vital staining of roots of Arabidopsis thaliana, Col-0 and Ler, NR penetrated well into all root zones except the root apical meristem (pH 5·8 and 8·0, 0·4–40 μm of NR; Figs 4 and 5). Incubation in 0·4 μm NR prepared in 0·2× MS supplemented with 20 mm potassium-phosphate buffer (pH 8·0) for 15 min was sufficient for visualization of protoxylem, although the signal was still weak. After 3·5 h of incubation, fluorescence from the protoxylem was stronger (Supplementary Information, Fig. SF3). The images were acquired at the same laser settings. In this particular case, grey value levels increased 1·7 times after extensive staining. In the case of propidium iodide, even prolonged incubation at a high concentration (10 μg mL–1 for 30 min instead of the usual 1 min) did not result in penetration into the stele of living arabidopsis roots (10-d-old seedlings, mature root zone with Casparian bands differentiated; Supplementary Information, Fig. SF4).
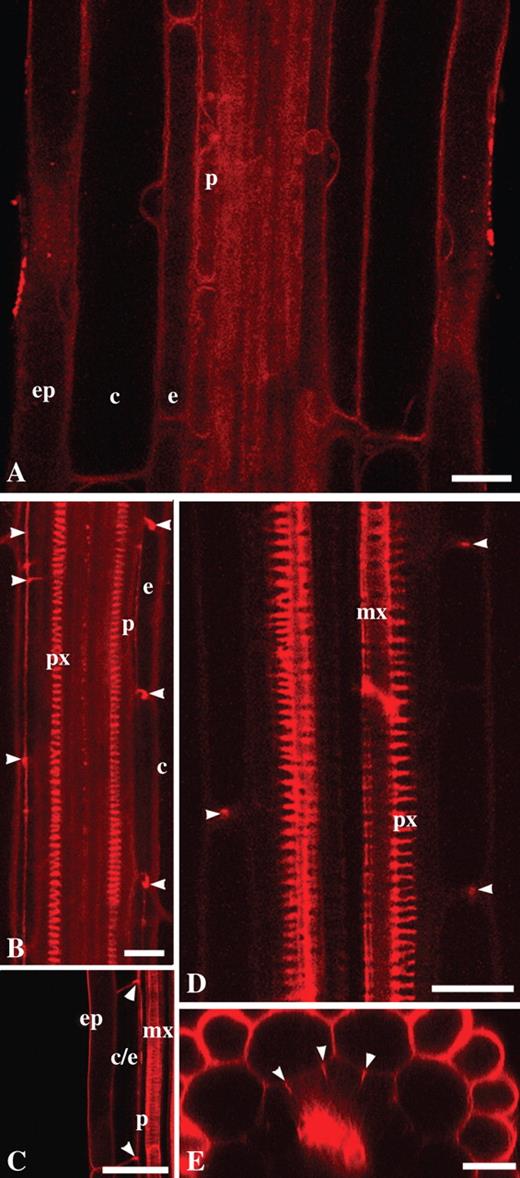
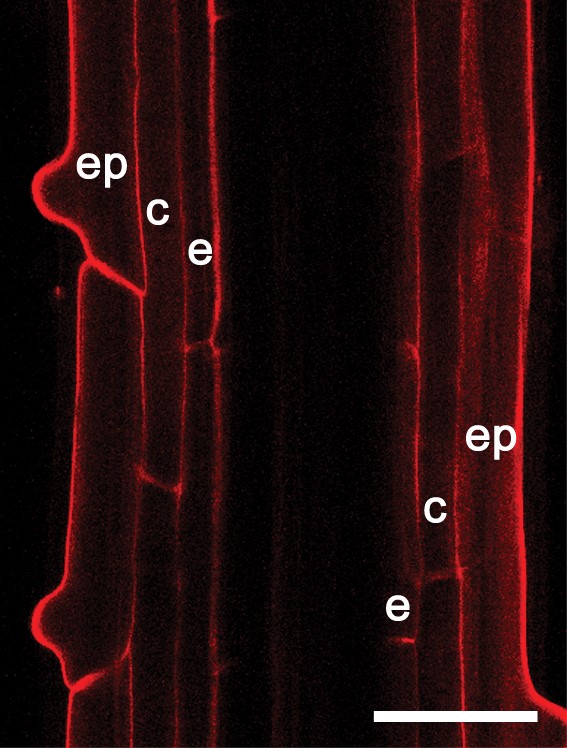
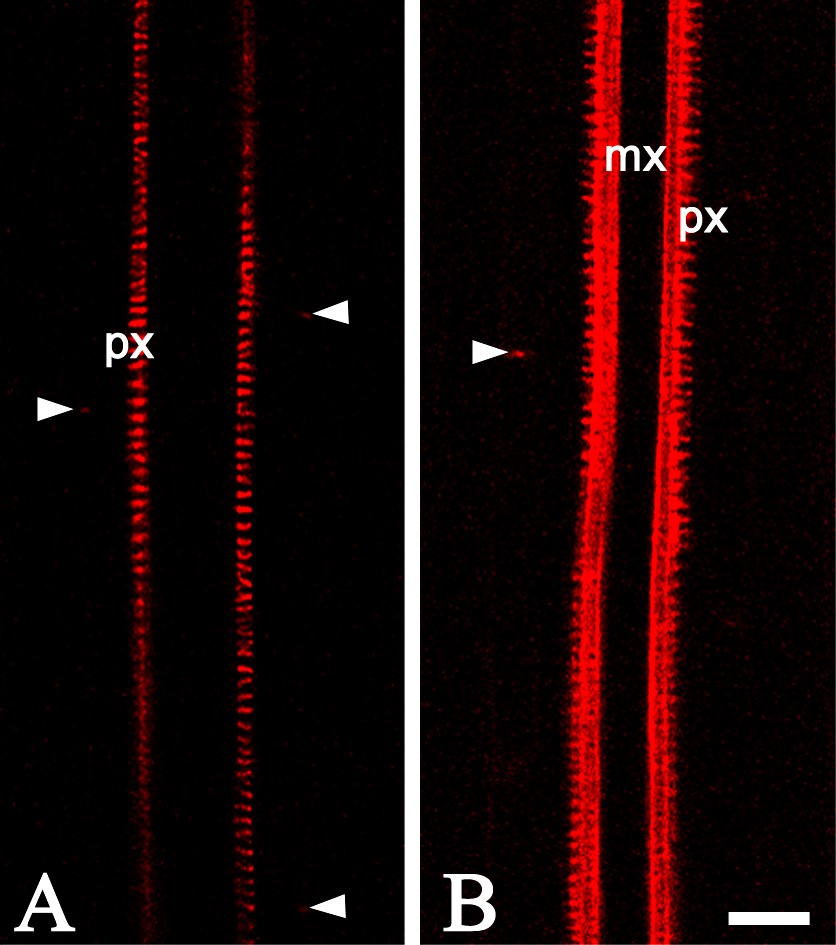
NR as a probe for visualization of the endodermal Casparian band, xylem elements and general root structure in living roots of wild-type arabidopsis, Col-0 (A, B, D and E), and in scr-3 mutant (C): (A) young differentiation zone, protoxylem elements are not yet differentiated; (B) Casparian bands of the endodermal cells and protoxylem elements; (C) metaxylem in scr-3 mutant; note the lack of one cell layer in ground tissue; (D) protoxylem and metaxylem elements and Casparian bands in the mature differentiation zone; (E) transverse optical section of the root in which Casparian bands and general radial tissue pattern can be visualized. Arrowheads indicate Casparian bands; ep, Epidermis; c, cortex; e, endodermis; p, pericycle; px, protoxylem; mx, metaxylem. Roots were stained with 4 μm (A, C and D) and 1 μm (E) NR at pH 5·8 and with 4 μm NR at pH 8·0 in 0·2× MS supplemented with 20 mm K-phosphate buffer (B). Staining time was 10–20 min (A and C–E) and 1 h 45 min (B). All panels show single optical sections except (B), projection of seven optical sections, total thickness of tissues scanned is 6 μm. Scale bars = 20 μm.
Staining properties of NR at pH 8·0 prepared in solutions of different ionic strength in arabidopsis Col-0 (A–D and F) and Ler (E) wild-type plants: (A) tangential longitudinal section, showing staining of cytoplasm in epidermis and cortex in the transition zone; (B) staining of cytoplasm in the epidermis in the transition zone; (C and D) vacuolar system in the cortical cells of the transition zone; (E) vacuolar system in the differentiation zone shown in partially tangential section; (F) staining of cytoplasm in near-median section of the root apical meristem. The arrowhead indicates Casparian bands. ep, Epidermis; c, cortex; e, endodermis; p, pericycle. Roots were stained with 4 μm (A–E) or 0·4 μm (F) NR. The staining solution was prepared in 0·2× MS supplemented with 20 mm K-phosphate buffer (A), in 0·1 m K-phosphate buffer (B and F), in 0·2× MS supplemented with 20 mm K-phosphate buffer and 50 mm KNO3 (C and D) and in 1 m K-phosphate buffer (E). Staining time was 15–30 min (A–E) and 1 h (F). Single optical sections (A, E and F) and projection of three optical sections, total thickness of tissues scanned is 2·4 μm (B), projection of three optical sections, total thickness of tissues scanned is 2·6 μm (C), and projection of six optical sections, total thickness of tissue scanned is 5 μm (D). Scale bars: A, B, E and F = 20 μm; C = 10 μm; D = 5 μm.
Influence of the pH and ionic strength on NR staining
In comparison to experiments at pH 5·8, staining of the cell walls was, in general, very weak at pH 8·0. However, protoxylem and metaxylem elements were well stained (Fig. 4B) and Casparian bands could be detected (Figs 4B and 5E; Table 1). They even appeared to be stained more specifically as the thickness of these stained structures at this pH was visually different from samples at pH 5·8. For example, the lignified cell wall component of the protoxylem elements appeared thinner when stained at alkaline pH in comparison to acidic pH (compare Figs SF3A and SF5A where roots were stained at 0·4 μm NR but at different pH; Supplementary Information). A similar effect could be observed upon addition of salt to the staining solution at pH 8·0 (50 mm KNO3, data not shown). In addition, in the presence of salt (50 mm KNO3) or concentrated buffer (1 m phosphate buffer), vacuoles of the transition zone (Fig. 5C, D) or transition and differentiation zone (Fig. 5E) were stained at pH 8·0, respectively. High buffer concentrations (1 m) induced plasmolysis in the root tissues and allowed visualization of vacuoles in all root zones. This was the only staining condition that permitted detection of the vacuolar system in the differentiation zone (Fig. 5E). Upon prolonged incubation (1 h) the root meristem could be stained consistently in a staining solution containing 0·1 m phosphate buffer at pH 8·0 (Fig. 5F). The other staining media were not effective in this case.
The staining properties of Neutral red in relation to the staining conditions
| Staining solution* | ||||||||||
|---|---|---|---|---|---|---|---|---|---|---|
| Structure | 1 | 2 | 3 | 4 | 5 | |||||
| Non-lignified cell walls | + | w | w | w | w | |||||
| Xylem elements | + | + | + | + | + | |||||
| Casparian bands | + | + | + | + | + | |||||
| Vacuoles | ||||||||||
| Root cap | + | + | + | + | - | |||||
| Transition zone | – | – | + | – | + | |||||
| Differentiation zone | – | – | + | – | – | |||||
| Cytoplasm | ||||||||||
| Meristem | – | (+) | – | – | – | |||||
| Transition zone | – | + | – | + | – | |||||
| Differentiation zone | + | + | – | – | – | |||||
| Lateral root primordium | – | + | – | – | – | |||||
* 1, 0·2× MS medium, pH 5·8; 2, 0·1 m potassium phosphate buffer, pH 8·0; 3, 1 m potassium phosphate buffer, pH 8·0; 4, 0·2× MS medium supplemented with 20 mm potassium phosphate buffer, pH 8·0; 5, 0·2× MS medium supplemented with 20 mm potassium phosphate buffer and 50 mm potassium nitrate, pH 8·0. w, weak; +, stained; –, not stained. Delayed staining is indicated by ( ).
Casparian bands and xylem elements are visualized with NR
In the early differentiation zone, where the protoxylem is not yet differentiated, NR at pH 5·8 can be used as a general stain that serves well for recognition of various root tissues (Fig. 4A). In the more mature portion of the root, NR was found to be useful for detection of the Casparian bands of the endodermis cells (Fig. 4B) and proto- and metaxylem elements (Fig. 4B–E). Even the lowest concentration of NR tested (0·4 μm) was sufficient for visualization of these internal tissues (Supplementary Information, Fig. SF5, pH 5·8). At high concentrations of NR, staining of cell walls was too intense to detect Casparian bands.
Under the same CLSM settings and the same staining time (0·4 μM NR, 10 min) there was no difference in the fluorescence intensity of cell walls in young and mature differentiation zones of the same root (comparing maximum fluorescence intensities estimated as grey values) (Supplementary Information, Fig. SF5B). However, some transgenic lines did show differences in the fluorescence intensity in comparison to wild-type plants (data not shown). It was found that 1 μm NR (pH 5·8) was sufficient to obtain transverse images of arabidopsis roots that permitted visualization of all tissues and the Casparian bands of the endodermis (Fig. 4E). Using NR and CLSM, Casparian bands could also be detected in a mutant with abnormal development of the ground tissue (Fig. 4C).
NR as probe for the studies of vacuolar system biogenesis in root cells
The vacuolar system of root cortical cells in arabidopsis, A. cepa and P. vulgaris was studied for its NR-accumulation properties. At the basal portion of the root apical meristem, the vacuolar system of the cells is already formed in both arabidopsis and P. vulgaris roots. At this stage of cellular development, cells have a system of many small vacuoles. Some of them are <1 μm (Fig. 6A, 4 μm NR, pH 5·8, P. vulgaris). At the beginning of cell elongation in the transition zone, the vacuoles become progressively larger proportional to the increase in cell length (Fig. 6 B–D). In this process, the vacuoles fuse and finally form a large central vacuole (Fig. 6D). In effect the same observations were made for arabidopsis and A. cepa roots (data not shown). Good penetration ability of NR at pH 5·8 was also verified in such organs as the root nodule in P. vulgaris. Using NR, the general morphology of the nodule could be observed (Fig. 6E). NR mainly stained the vacuolar system of differentiated nodule cells. Central vacuoles were formed in the peripheral tissues of the nodules (Fig. 6F). In this case, NR could not penetrate into internal tissues possibly due to binding to peripheral structures.
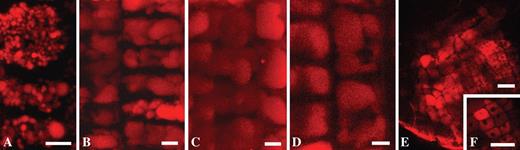
Vacuolar system in cortical cells and the root nodule of the root of Phaseolus vulgaris. (A–D) Vacuolar system in the cortex in P. vulgaris observed in tangential optical sections: (A) a vacuolar system in the proximal portion of the root apical meristem; (B–D) biogenesis of the vacuolar system in cortical cells along the root from the meristem (B) toward the transition zone (C, D) – note the progress of vacuolar fusions in the proximal direction; (D) central vacuoles are formed; (E) P. vulgaris young root nodule; (F) central vacuoles of nodule cells. Roots were stained with 4 μm NR, pH 5·8, for 10–20 min. Projection of 15 optical sections, total thickness of tissues scanned is 14 μm (A), projection of 23 optical sections, total thickness of tissues scanned is 16·5 μm (B), and projection of 30 optical sections, total thickness of tissues scanned is 21·8 μm (C). Panels (D–F) are single optical sections. Scale bars: A–D = 5 μm; E and F = 50 μm.
NR is a useful probe for developmental studies
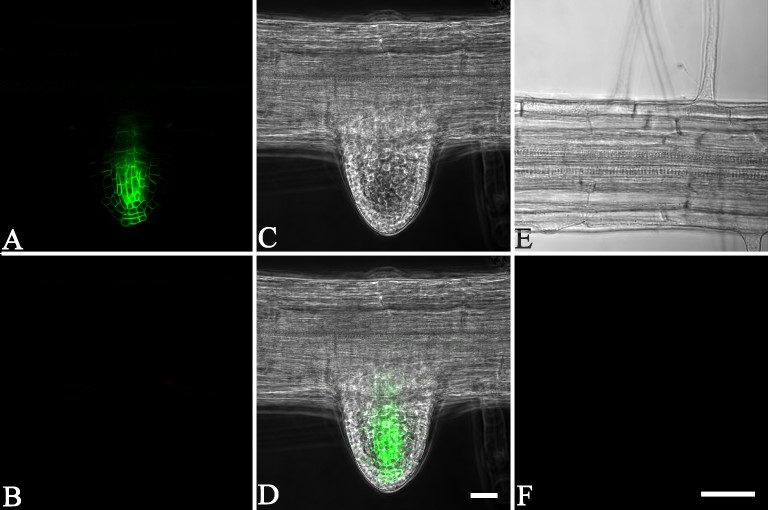
Analysing an enhancer trap line of A. thaliana, J1701 where ER-GFP is expressed in the root cap and presumptive xylem elements, NR was visualized in the vacuolar system of the columella and lateral root cap cells (Fig. 7A, pH 5·8). In the protruding lateral root primordium, the vacuolar system of root cap cells was not detected (Fig. 7B, pH 5·8). At a more advanced stage, NR staining was similar in the primary and lateral roots at pH 5·8 (data not shown) and at pH 8·0 (Supplementary Information Fig. SF6 A, B).
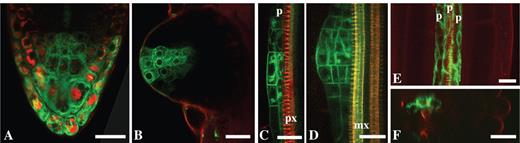
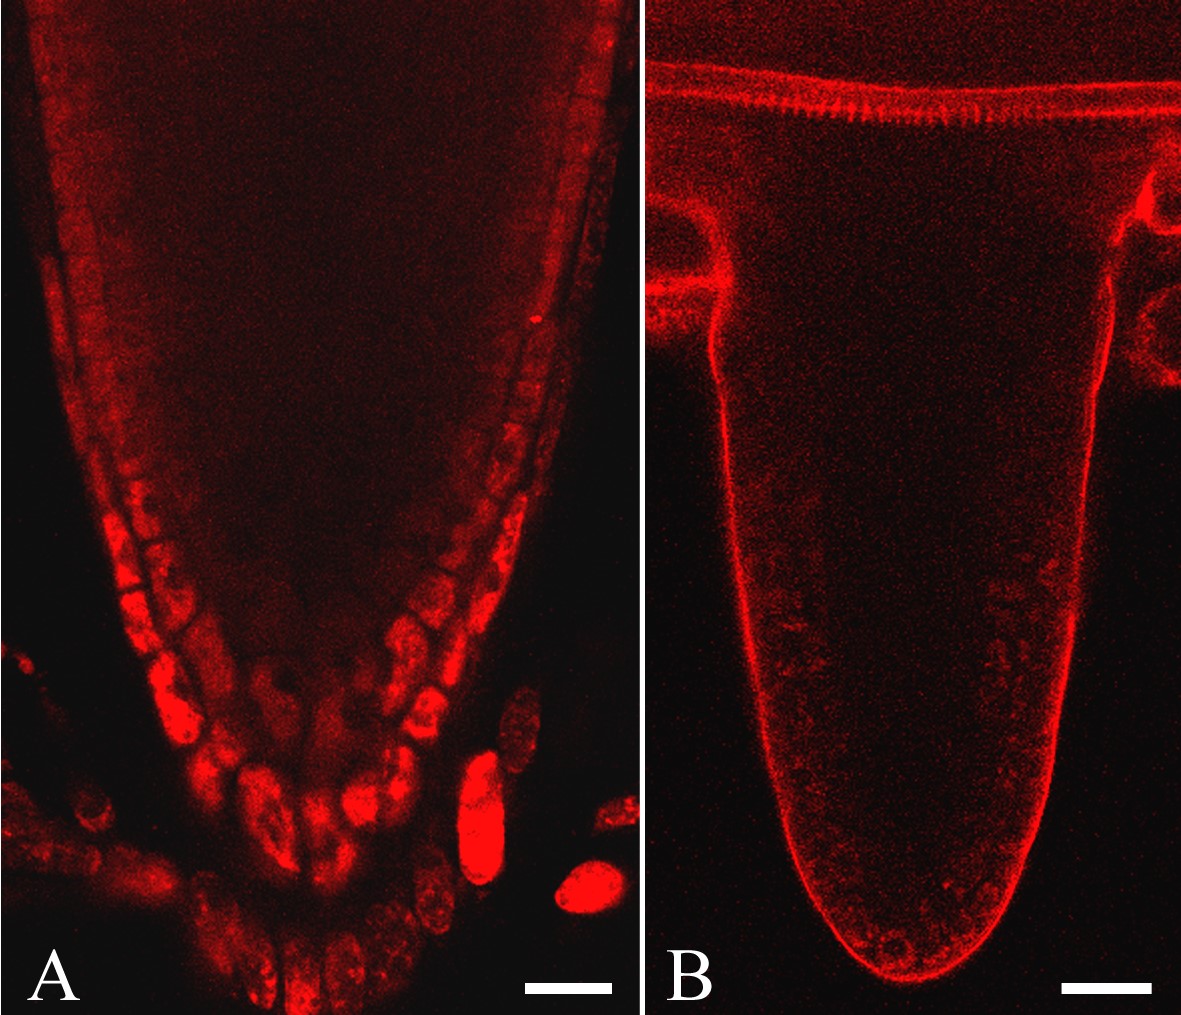
Examples of the use of NR for root developmental studies. (A and B) An enhancer trap line of Arabidopsis thaliana, J1701 – GFP is expressed in the root cap: (A) the root cap of the primary root; (B) recently emerged lateral root—note that no NR is detected in the root apical meristem. (C and D) The root of PIN1:GFP line stained with NR, which is primarily located in the protoxylem—lateral root primordia at stages II (C) and IV (D). (E and F) An enhancer trap line of Arabidopsis thaliana, J0121—GFP is expressed in the pericycle cells adjacent to the protoxylem; (E) tangential longitudinal optical section; (F) transverse optical section. Roots were stained with 4 μm (A and B) and 1 μM (C–F) NR, pH 5·8. p, Pericycle; px, prtoxylem; mx, metaxylem. Projection of seven optical sections, total thickness of tissues scanned is 6 μm (D) and projection of eight optical sections, total thickness of tissues scanned is 7 μm (E). Other panels are single optical sections. Scale bars = 20 μm.
Since NR rapidly penetrates into the tissues of the central cylinder of the root, it is a very useful probe for in vivo analysis of lateral root development. This is illustrated here using a PIN1:GFP line. NR-staining of xylem elements permits easy recognition of the plane of orientation, while the expression of PIN1:GFP highlights the lateral root primordia. In the roots stained with NR, primordia at stages II and IV (stage definition by Malamy and Benfey, 1997) located in the protoxylem plane can be seen (Fig. 7C, D; pH 5·8).
Previously, the question about the minimum number of founder cells required for lateral root initiation in arabidopsis was studied and it was shown that three pericycle cells are sufficient to form a primordium (Dubrovsky et al., 2001). Analysing enhancer trap line J0121, where pericycle cells adjacent to protoxylem (detected by NR) express GFP, it was found that pericycle cells from three cell files adjacent to the protoxylem express GFP. When the root is placed in a protophloem plane, these cells can be observed above the protoxylem detected with NR in a longitudinal tangential (Fig. 7E) or transverse (Fig. 7F) optical section made with a CLSM.
During lateral root development, a founder cell should theoretically be undergoing changes in the cytoskeleton as the cell polarity has to be changed during the formation of a new organ. The study of the cytoskeleton in deeper layers of living roots is not an easy task. The present attempt to visualize the cytoskeleton in the pericycle was possible when 4 μm NR (pH 5·8) was applied to living roots of GFP-mTn (Fig. 3I) and GFP-FABD2 (Fig. 3E) lines. The use of NR permitted the protoxylem to be recognized and thus the identification of the pericycle cells which are competent for lateral root formation in living roots of a transgenic line where GFP is fused either to mouse talin (Kost et al., 1998) or to the ABD2 actin-binding domain of plant fimbrin (Ketelaar et al., 2004; Voigt et al., 2005). In the transition zone, central nuclei are surrounded with an F-actin cage, which interacts with actin-rich end-poles (Fig. 3C and D). The use of NR will enable further studies of the underlying dynamics in the cytoskeleton.
NR for endo-mycorrhiza studies
Fungal structures are barely visible in mycorrhizal roots without staining. In earlier studies, NR was introduced as a suitable vital stain for detection of arbuscules within colonized roots (Guttenberger 2000a, b). Here, it is demonstrated that NR, used as a fluorescent probe for CLSM, is suitable for improving the detection of fungal structures within roots. While the colonized plant cells show hardly any staining, the most intense fluorescence signal lies within fungal structures (Fig. 8). CLSM permitted 3-D reconstruction of fungal structures within roots (see Movie SM1, Supplementary Information).
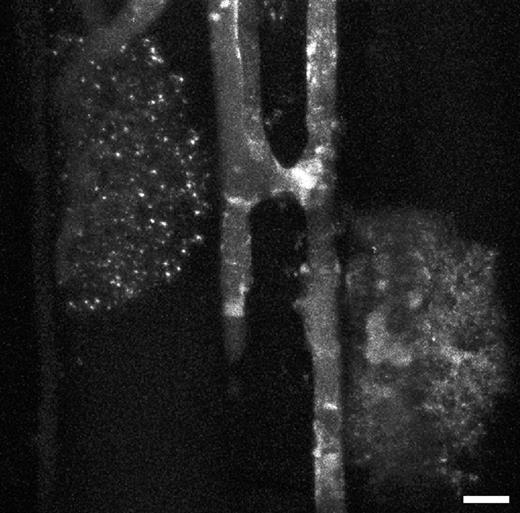
Glomus mosseae in mycorrhizal roots of Allium porrum. Two arbuscules and two running hyphae connected by an anastomosis are shown. The brightly fluorescing globular and tubular structures within the hyphae are probably vacuoles. The staining solution was 0·4 μm NR in 10 mm MOPS/KOH-buffer, pH 8·0. Projection of 63 optical sections, each covers 116 μm2, total thickness of tissues scanned is 28 μm. Scale bar = 10 μm.
DISCUSSION
Spectral properties of NR
The recorded emission spectra were necessary for the proper selection of suitable emission filters to separate signals from NR and GFP. Published emission spectra of NR in solvents or cytoplasm are characterized by a single broad peak (Chen et al., 1998). Since autofluorescence was not observed the complex spectra found in NR-stained roots most likely reflect the interaction of NR with different substrates, giving rise to a number of distinct emission spectra, which sum up to the observed complexity. The complex emission spectra might provide an explanation for the occasional simultaneous observation of green and red signals (Fig. 7D), which in this case may be related to unknown properties of the given transgenic line. In future, analysis of emission spectra might allow for the char-acterization of the physico-chemical environment of NR in a given tissue or subcellular compartment. From such data the biochemical nature of the stained structure and the underlying staining mechanism could be deduced, e.g. spectra from NR bound to full cell saps should differ from those of NR trapped in an acidic compartment or dissolved in a lipid droplet. Known physico-chemical factors that influence the spectral properties of NR, its fluorescence intensity and/or emission maximum are pH (mainly intensity; Chen et al., 1998), solvent polarity (wavelength of maximum increases with increasing polarity; Sousa et al., 1996), concentration of NR (molar absorbance increases with decreasing concentration; Dell'Antone et al., 1972), and intermolecular interactions (changed excitation spectra and fluorescence intensity; Zhang et al., 2004).
NR toxicity and concentrations used for CLSM studies
Vital staining for bright-field microscopy is performed with concentrations of NR ranging from 8 μm (Guttenberger, 2000a, b) to 3·5 mm (Lulai and Morgan, 1992). Stadelmann and Kinzel (1972) recommend 346 μm of NR (0·01 %). The most common concentrations of NR used in this study were 1 μm and 4 μm which were not toxic if applied at pH 5·8 for 5 d (1 μm) or 30 min (4 μm). This result is in line with the use of NR in toxicity assays where NR serves as a marker for vitality (Zhang et al., 1990). However, NR can also have toxic effects as a cancer cell photosensitizer (VanderWerf QM et al., 1997). Since the present culture system did not allow protection from the light, this property may explain, why in the present experiments NR inhibited root growth at concentrations exceeding 4 μm, while NR did not exert a significant inhibition of soybean root growth upon treatment with 1·73 mm for 10 min (Schumacher et al., 1983). In addition, the sensitivity of roots to NR may vary among plant species. Selectively protecting roots from light is not an easy task with the tiny seedlings of arabidopsis. In the case of algae, exclusion of light is even more problematic. In fact, these organisms seem to be especially sensitive to NR. In a study of Chlamydomonas reinhardtii, 8 μm NR was almost lethal and 5 μm strongly induced many oxidative and general stress response genes (Fischer et al., 2005). NR further interacted with the photosynthetic apparatus causing the down-regulation of many photosynthetic genes and the inhibition of photosynthetic electron flow (Fischer et al., 2005). Even moderate concentrations of the weak base NR are also capable of increasing the vacuolar pH by 0·2–0·3 units (50 μm; Felle, 1988). Based on the authors' experiences and the caveats from the literature, the concentration of NR and the staining time was kept to a minimum. Transfer of the protocol to other plant species might require additional optimization and should consider the photosensitizing property of the dye.
In the current study, a range of NR concentrations from 0·4 to 40 μm at pH 5·8 and 8·0 was tested. The lowest concentration tested with CLSM gave a red signal both in the xylem and in Casparian bands though in some cases this concentration was too low for the dye to penetrate into internal root tissues. It was demonstrated that even low concentrations of NR rapidly penetrate internal tissues of intact living plant roots at pH 5·8. As such it can potentially be used in the studies which require time-lapse analysis.
It has been reported that at acidic pH, NR in its predominantly cationic form stains only cell walls and cannot be detected in vacuoles (Stadelmann and Kinzel, 1972). The fact that, at this pH, vacuoles could be visualized, both in the root cap and in the cells of the transition zone, indicates that NR can be detected with a CLSM at relatively low concentrations (1 μm and 4 μm at pH 5·8), whereas it was undetectable under a bright-field microscope (346 μm; Stadelmann and Kinzel, 1972).
NR for visualization of cell walls and its components with CLSM
The present results show that at both acidic and alkaline pH, NR even at the lowest concentration tested (0·4 μm) has high affinity to lignin and suberin. At acidic pH, cell walls are also stained. In the present work, this non-specific staining of cell walls proved beneficial, since under these conditions all cell layers and, hence, the root anatomy can be observed without sectioning. This approach is in clear contrast to the established histochemical protocols which aim at selective staining of acidic compartments (Stadelmann and Kinzel, 1972). Staining at the pH of the culture medium is, of course, also gentler than a shift to an alkaline pH. For staining of special cell wall regions like the Casparian band, an increase in pH improved the specificity as observed in bright-field microscopy.
NR provides easy orientation in mutants with abnormal roots
In scr mutants, only one tissue layer is developed in the ground tissue (Fukaki et al., 1998; Fig. 4C). In scr-1 and scr-2 mutants, the single layer has features of both cortex and endodermis (Di Laurenzio et al., 1996). The question of whether this is also the case for the scr-3 mutant had hitherto not been studied (H. Fukaki, pers. comm.). With the help of NR staining and CLSM, Casparian bands could be detected easily (Fig. 4C) without further processing of the roots. In mutants that have various defects in the development of vascular tissue, such as wol, wooden leg (Scheres et al., 1995), eli, ectopic lignification (Caño-Delgado et al., 2000) or elp, ectopic deposition of lignin in pith (Zhong et al., 2000), xylem elements were studied using either root sections or fixed material. The prsent data indicate that with the use of NR, similar studies can be done on living roots, which will simplify the analysis of ontogenetic changes in development.
Staining of subcellular compartments
While staining unmodified cell walls, lignin and suberin seem to work in the same way for bright-field microscopy and CLSM, staining of some subcellular compartments differs markedly between the two techniques. The staining of cytoplasm has been observed in earlier light microscopical studies (Guttenberger, 2000a) and might be due to binding of NR to phospholipids (Okada, 2000) of endomembranes. However, differences in the staining of nuclei and vacuoles are new phenomena. Using bright-field microscopy, Guttenberger, 2000a) showed acidotropic staining of mature vacuoles of the differentiated root cortex and of the peri-arbuscular space in mycorrhizal root systems. Here it is reported that both compartments are barely detectable in CLSM while structures within fungal hyphae are prominent (Fig. 8). The latter probably arise from fungal vacuoles since these organelles are reported to accumulate NR (Thatcher, 1939; Dixon et al., 1999). The marked difference between bright-field and CLSM images is attributable to the fact that the spectral properties of NR, as well as the quantum yield of the fluorescence signal, strongly depend on the physico-chemical environment of the dye (Dell'Antone et al., 1972; Li et al., 1991; Sousa et al., 1996). In addition, the concentrations of NR employed in the experiments differ substantially (0·4 μm and 8 μm), which might influence the partitioning between stained structures. Hence, staining properties judged by light and fluorescence microscopy are poorly comparable in the case of acidic compartments. It should be mentioned that the vacuolar system in the fully elongated cells could only be detected at alkaline pH, while vacuoles in the root cap and in the transition zone were visualized with a similar resolution independent of the pH of the staining solution. This difference in the staining properties is probably due to the presence of phenolic substances in the latter vacuoles (full cell saps; Stadelmann and Kinzel, 1972).
The faint staining of nuclei in bright-field microscopy (Guttenberger, 2000a), which is not visible in fluorescence images (Fig. 4A and 8), is another example of differences between the microscopical techniques. Further studies are required to investigate the underlying staining mechanisms and the exact subcellular localization of NR.
The observed development of large central vacuoles from numerous small prevacuoles supports earlier findings (Marty, 1999; Abrahams et al., 2003). In the future, a combination of NR with different forms of GFP-fusion proteins, such as the lytic vacuole marker or the protein storage vacuole marker (Flückiger et al., 2003), could be valuable for the studies of vacuolar system biogenesis. In a different system, in GFP-marked Fusarium oxysporum, NR-stained vacuoles of the fungi also did not affect GFP fluorescence (Nonomura et al., 2003).
Neutral red for developmental studies
In developmental studies of living roots, it is frequently a challenge to detect internal root tissues within the differentiation zone. The apoplasmic tracer, propidium iodide, commonly used for plant roots, detects cell walls within the root apical meristem (Van den Berg et al., 1995), but in the differentiation zone does not penetrate deeper than the endodermis (Fig. SF4, Supplementary Information) even at high concentrations (J. G. Dubrovsky, pers. obs.). If the root can be sacrificed, the staining of 5–10 mm root portions with propidium iodide gives satisfactory results (Dubrovsky et al., 2006). It is demonstrated here that the use of NR provides a solution for this problem. Good penetration of NR into internal root tissues and detection of proto- and metaxylem permits easy detection of pericycle cell layers and of the plane in which the root is oriented. For example, tangential longitudinal optical sections of the root oriented in the protophloem plane, and visualization of the protoxylem with NR, permitted protoxylem-adjacent pericycle cells expressing GFP to be seen (Fig. 7E). These observations, together with transverse sections (Fig. 7F), confirm that three pericycle cell files adjacent to the protoxylem participate in primordium formation (Dubrovsky et al., 2001). It was found that the overall appearance of the actin cytoskeleton in these cells was similar, both in situ and in vivo, to the pattern reported previously (Baluška et al., 1997, 2001a; Voigt et al., 2005).
Potential limitations
Potential problems with toxicity have already been mentioned. If living roots are to be analysed, their thickness, level of tissue differentiation, lignification and autofluorescence, as well as metabolites that quench the fluorescence signal of NR are important factors that may not permit the use of NR. In addition, it is known that laser light penetrates no deeper than 10–200 μm depending on the refractive index of the tissues (Paddock, 1999). When thick roots are studied, excised root portions (as for P. vulgaris in this study; Fig. 6E, F) or transverse hand sections can be analysed. The slow staining kinetics is currently not encouraging for the use of NR in the root apical meristem. Since the composition of the incubation medium also had a strong influence on the staining of the meristem region, further optimization is required in this case.
Conclusion
The current study demonstrates the usefulness of NR for various CLSM studies of roots. NR emerges as an easily applied, inexpensive probe for CLSM with affinity to suberin and lignin, the ability to penetrate rapidly into internal root tissues, accumulation in vacuoles, and low toxicity. Unlike widely used propidium iodide, NR also penetrates into the inner parts of roots and serves as an apoplasmic as well as symplasmic stain. Apoplasmic staining can be reduced by an increase in the pH of the staining solution. The staining properties of NR are summarized in Table 1. The most prominent application of NR in conjunction with CLSM is the possibility of analysing internal root structure without the expensive and time-consuming procedures of tissue processing such as fixation, embedding and sectioning. The current work illustrates only some of the possible applications of NR. It certainly can be used to study further aspects of plant roots as well as other plant organs.
We thank Drs P. Benfey and J. Haseloff, and the Arabidopsis Biological Resource Center for seeds of scr-3, J0121 and J1701, as well as Drs J. Friml, R. Cyr and N.-H. Chua for their kind donation of PIN1:GFP, GFP-MAP4 and GFP-mTn arabidopsis lines. We also thank Dr K. Schumacher for helpful discussions, the Leica Vertrieb Bensheim for help with the mycorrhiza images, Mr J. M. Hurtado-Ramirez for logistic help, Dr P. Brewer for correcting the English, and Dr N. Doktor for help with art work. J.G.D. was supported by Programa de Apoyo a Proyectos de Investigación e Innovación Tecnológica (PAPIIT), Universidad Nacional Autónoma de México (UNAM), Projects IN 210202 and IX225304, and by the Exchange Program between UNAM (Mexico) and DAAD (Germany).
LITERATURE CITED
Abrahams S, Lee E, Walker AR, Tanner GJ, Larkin PJ, Ashton AR.
Baluška F, Parker JS, Barlow PW.
Baluška F, Barlow PW, Volkmann D.
Baluška F, Vitha S, Barlow PW, Volkmann D.
Baluška F, Jásik J, Edelmann HG, Salajová T, Volkmann D.
Baluška F, Volkmann D, Barlow PW.
Barlow PW, Baluška F.
Bates TR, Lynch JP.
Benková E, Michniewicz MSM, Teichmann T, Seifertova D, Jürgens G, Friml J.
Bouma TJ, Nielsen KL, Eissenstat DM, Lynch JP.
Bouma TJ, Nielsen KL, Koutstaal B.
Cárdenas L, Alemán E, Nava N, Santana O, Sánchez F, Quinto C.
Caño-Delgado AI, Metzlaff K, Bevan MW.
Chen G, Hanson CL, Ebner TJ.
Conn HJ.
Crippen RW, Perrier JL.
Dell'Antone P, Colonna R, Azzone GF.
De Simone O, Müller E, Junk WJ, Richau K, Schmidt W.
De Simone O, Haase K, Müller E, Junk WJ, Hartmann K, Schreiber L, Schmidt W.
Dickinson ME, Bearman G, Tille S, Lansford R, Fraser SE.
Di Laurenzio L, Wysocka-Diller J, Malamy JE, Pysh L, Helariutta Y, Freshour G, et al.
Di Sansebastiano GP, Paris N, Marc-Martin S, Neuhaus J-M.
Dixon KP, Xu J-R, Smirnoff N, Talbot NJ.
Dubrovsky JG, Doerner P, Colón-Carmona A, Rost TL.
Dubrovsky JG, Colón-Carmona A, Rost TL, Doerner PW.
Dubrovsky JG, Gambetta GA, Hernández-Barrera A, Shishkova S, González I.
Ehara M, Noguchi T, Ueda K.
Essig-Marcello JS, van Buskirk, RG.
Fahraeus G.
Felle H.
Fischer BB, Krieger-Liszkay A, Eggen RIL.
Flückiger R. De Caroli M, Piro G, Dalessandro G, Neuhaus J-M, Di Sansebastiano G-P.
Fukaki H, Wysocka-Diller J, Kato T, Fujisawa H, Benfey PN, Tasaka M.
Guilliermond A.
Guttenberger M.
Guttenberger M.
Hugdahl JD, Morejohn LC.
Kawai M, Samarajeewa PK, Barrero RA, Nishiguchi M, Uchimiya H.
Ketelaar T, Allwood EG, Anthony R, Voigt B, Menzel D, Hussey PJ.
Kost B, Spielhofer P, Chua N-H.
LaManna JC, McCracken KA.
Li QG, Ni YJ, Cao YI.
Lulai EC, Morgan WC.
Malamy JE, Benfey PN.
Marc J, Granger CL, Brincat J, Fisher DD, Kao T, McCubbin AG, Cyr RJ.
Ngo DA, Garland PA, Mandoli DF.
Nishimura M.
Nobel PA, Castaneda M, North G, Pimienta-Barrios E, Ruiz A.
Nonomura T, Tajima H, Kitagawa Y, Sekiya N, Shitomi K, Tanaka M, et al. 2003. Distinguishable staining with neutral red for GFP-marked and GFP-nonmarked Fusarium oxysporum strains simultaneously colonizing root surfaces.
Okada D.
Oparka KJ.
Paddock SW.
Scheres B, Di Laurenzio L, Willemsen V, Hauser M.-T, Janmaat K, Weisbeek P, et al.
Schumacher TE, Smucker AJ.
Schumacher TE, Smucker AJM, Eshel A, Curry RB.
Sivaguru M, Baluška F, Volkmann D, Felle H, Horst WJ.
Smith FA, Raven JA.
Soran V, Lažar G.
Sousa C, Sa e Melo T, Gäze M, Gaullier JM, Maziäre JC, Santus R.
Stadelmann EJ, Kinzel H.
Strugger S.
Svendsen C, Spurgeon DJ, Hankard PK, Weeks JM.
Thatcher FS.
Timmers ACJ, Tirlapur UK, Schel JHN.
Tsien RY, Wagooner A.
Van den Berg C, Willemsen V, Hage W, Weisbeek P, Scheres B.
VanderWerf QM, Castro DJ, Nguyen RD, Paiva MB, Chao KH, Santillanes ME, et al.
Voigt B, Timmers T, Šamaj J, Müller J, Baluška F, Menzel D.
Watkin ELJ, Thomson CJ, Greenway H.
Weeks JM, Svendsen C.
Wilson GH, Grolig F, Kosegarten H.
Zhang G, Shuang S, Dong C, Liu D, Choi MMF.
Zhang SZ, Lipsky MM, Trump BF, Hsu IC.
Author notes
1Departamento de Biología Molecular de Plantas and 3Unidad de Microscopía del Instituto de Biotecnología, Universidad Nacional Autónoma de México, Cuernavaca, Morelos, México, 2Universität Tübingen, Entwicklungsgenetik, Tübingen, Germany and 4Institute of Cellular and Molecular Botany, University of Bonn, Bonn, Germany
