


Abstract
Waste sorting activities are source of occupational bioaerosol exposures that are associated with several health disorders. New analytical tools, based on next-generation sequencing (NGS) technologies, provide powerful methods to assess the microbial composition of bioaerosols. The objectives of the study were (i) to assess the feasibility and the repeatability of NGS-based biodiversity measurements and (ii) to study the microbial biodiversity using NGS in bioaerosols emitted in a waste sorting plant (WSP). Three stationary parallel samples were collected in a sorting cabin using closed-face cassettes equipped with polycarbonate membranes. Bacterial and fungal diversity was assessed by sequencing 16S and 18S rDNA genes using either Illumina sequencing or 454 pyrosequencing methods. At sampling point, airborne bacteria were dominated by Proteobacteria, Firmicutes, and Actinobacteria with prevailing genera assigned to unclassified Enterobacteriaceae, Staphylococcus, Acinetobacter, Leuconostoc, Pseudomonas, and Lactobacillus. Airborne fungi were dominated by Ascomycota with prevailing genera assigned to Penicillium, Aspergillus, Rhizopus, Wallemia, and Hemicarpenteles. The NGS biodiversity measurements revealed a higher biodiversity bioaerosols that previously reported for WSP in studies carried out using culture methods followed by identification of microorganisms. These results provide the first survey about taxonomic biodiversity in bioaerosols from WSPs using high-throughput sequencing.
Introduction
Household waste sorting activities are source of occupational exposure to bioaerosols including bacteria, fungi, endotoxins, (1,3)-β-D-glucans, as well as inhalable dust (Breum et al., 1999; Gladding et al., 2003; Hebisch and Linsel, 2012; Schlosser et al., 2015). Studies carried out in waste sorting plants (WSP) reported health disorders such as non-allergic symptoms (chronic bronchitis and mucous membrane irritations) as well as allergic symptoms (allergic asthma, allergic rhinitis, and hypersensitivity pneumonitis) among the population of WSP workers exposed to bioaerosols (Ivens et al., 1997; Gladding et al., 2003; Perez et al., 2006).
Bacteria, fungi, and viruses found in bioaerosols at the workplaces, as well as the associated microbial compounds such as endotoxins, (1,3)-β-D-glucans, mycotoxins, and allergens, were presented as the possible causative agents of occupational diseases (Douwes et al., 2003; Eduard et al., 2012). However, the complex composition of bioaerosols still prevents identifying the specific microbial agents responsible for health effects as well as their precise role in symptoms. As a consequence, the dose–response relationships have not yet been established for most of non-infectious airborne microorganisms and no occupational exposure limit values are available. Thus, defining the precise composition of the bioaerosols to which employees are exposed to would provide a better understanding of biological risks at the workplaces.
So far, the microbial biodiversity data published in (WSP) were obtained by cultivation of microorganisms on nutrient media prior to identification. The corresponding studies found that the dominant fungi belonged to Penicillium sp., Aspergillus sp., Cladosporium sp. (Breum et al., 1999; Tolvanen, 2001; Lehtinen et al., 2013; Viegas et al., 2014). However, the culture method underestimates the total number of microorganisms in samples as dead cells and microorganisms at viable but non cultivable state due to the selecting effect of culture media and cultivation conditions (Amann et al., 1995; Heidelberg et al., 1997). Thus, the cultured based biodiversity measurements previously performed in WSP surely have underestimated the real microbial taxon richness.
Advances in molecular biology and next-generation sequencing (NGS) provided new powerful methods for biodiversity studies (Cuadros-Orellana et al., 2013). These molecular methods were already used in bioaerosol studies carried out in different occupational environments such as composting facilities (Partanen et al., 2010), wastewater treatment plants (Lin et al., 2014), and swine houses (Kumari and Choi, 2015). NGS overcame the limitations of culture-based methods and provided useful data (greater observed biodiversity, detection of non-preponderant taxa, etc.) for a better understanding of the microbial communities to which workers may be exposed. However, the NGS have also some limitations due to the DNA extraction efficiency, polymerase chain reaction (PCR) biases or the short size of the amplified DNA fragments which do not allow the identification at the species level. Nevertheless, the NGS could provide additional information as compared to culture-based methods (Yoo et al., 2017). To date, metagenomics methods were not applied to investigate the microbial biodiversity found in WSP. The aims of the present study were (i) to assess the feasibility and the repeatability of NGS-based biodiversity measurements in WSP and (ii) to apply this method in order to study the bioaerosol microbial biodiversity in bioaerosols emitted in a WSP.
Materials and Methods
Description of the WSP
Bioaerosol biodiversity was assessed in July 2014 in a French WSP sorting journal newspapers, papers, cardboards, food packaging, and other sorting wastes (4000 tons per month). The WSP employed about 50 workers mainly dedicated to manual sorting in three cabins.
Bioaerosol sampling
Three stationary parallel samples were collected in a cardboard sorting cabin (SC) and one outdoor reference (OR) sample was also collected at ~50 m upwind far from the WSP boundary to determine the background level. Bioaerosols were sampled with 37 mm closed-face cassettes equipped with a sterile polycarbonate filter (Nuclepore®, 0.8 µm pore size) and a backing cellulose pad (Millipore®, thick cellulose absorbent pad). The cassettes were connected to constant flow pumps (Bravo, Tecora, France) and sampling was performed at a flow rate of 10 l min−1. The flow rate was calibrated before and after sampling using a flow meter (Mass Flowmeter 4040, TSI Inc., USA). Sampling devices were placed at 1.7 m above ground level and the sampling was conducted for 5 hours during the work shift. Temperature and relative humidity were monitored using a portable device (Thermohygrometer B6285C Pocket, Fischer, France) at the beginning and at the end of each sampling. Bioaerosol samples were transported to the laboratory during the day of sampling using a cold box and were then stored at 4°C until analysis. All samples were analyzed within 24 hours after being collected.
DNA extraction
A volume of 10 ml of a sterile solution (0.01% Tween 80 in ultra-pure water) was introduced into the cassettes by the inlet. The cassettes inlets and outlets were closed with a cap and placed on a rocker (Heildolph®, Multi-Reax shaker) at 2000 rpm for 20 min, at room temperature. DNA extraction was performed with 500 µL of the subsequent elution solution with FastDNA® SPIN kit for soil kit (MP Biomedicals, Illkirch, France) according to the manufacturer’s instructions. The DNA concentration was measured using Nanodrop 2000c spectrophotometer (Thermo Fischer Scientific, Illkirch, France). Mean concentrations observed in all samples were 6.17 ± 1.30 ng µl−1. The DNA samples were stored at −20°C until sequencing.
DNA sequencing and sequence data analysis
DNA purification, amplification, sequencing, and reads analysis were achieved by INRA Transfert Environnement (Narbonne, France). Bacterial 16S rDNA gene (V4–V5 variable region) was amplified using the universal primers F-GTGYCAGCMGCCGCGGTA and R-CCCCGYCAATTCMTTTRAGT. The universal primers used for Eukaryota DNA amplification were w553 CTTTCCCTA CACGACGCTCTTCCGATCTGCGGTAA TTCCAGCTCCAA and w554 GGAGTTCAGACGTG TGCTCTTCCGATCTTTGGCAAAT GCTTTCGC, targeting the V1 variable region of Eukaryota 18S rDNA. Each PCR mixture consisted of: 5 µl of DNA template, 4 µl of dNTPs (25 mM), 1 µl of each primer (100 ng µl−1), and 0.5 µl of Taq polymerase in a total volume of 50 µl. A PCR cycle was 2 min at 95°C (denaturation step), 1 min at 56°C or 65°C for 18S or 16S rDNA amplification respectively (annealing step) followed by 1 min at 72°C (elongation step). Bacterial 16S rDNA was sequenced using MiSeq technology (Illumina, San Diego, CA USA). The Eukaryota 18S rDNA was sequenced using GS-FLX pyrosequencer (454 Life Sciences, Branford, CT, USA).
The preprocessing of sequence analysis was performed using a Mothur pipeline version 1.33.2 (Schloss et al., 2009) developed by INRA Transfert Environnement. After trimming and denoising, barcodes, primers, and homopolymers longer than 8 pb were removed. Chimera were detected and deleted using UNCHIME (Edgar et al., 2011) executed in Mothur. Reads with 100% of identity were clustered into a unique sequence. Then, sequences were clustered into operational taxonomic units (OTU) at a threshold of 97% sequence similarity. Bacterial taxonomy assignments were performed using the Mothur platform (‘average’ method) using SILVA database. The 10 dominant eukaryotic OTUs were identified at the genus rank at 95% sequence similarity using BLASTn algorithm in Genbank (NCBI database; https://blast.ncbi.nlm.nih.gov).
The Shannon’s index, H’, was calculated with the following formula: H’ = −∑Pi × lnPi, where Pi = Ni/N, Ni is the OTU number in a genus and N is the total OTU number. The Simpson’s index, D, was calculated with the following formula: D = ∑[Ni × (Ni − 1)/N × (N−1)]. The Simpson’s index measures the probability that two OTU chosen randomly will be associated with the same taxon (in that case the genus). The more the index value is near the value 0, the more the taxa are present in different proportions. On the contrary, the more the index value is near 1, the more the taxa are present in the same proportion. The values of Shannon’s index are between 0 and S, the total taxa number and values of Simpson’s index are between 0 and 1.
Repeatability of the biodiversity measurement process
The repeatability of the bioaerosol measurement process was assessed on the 16S rDNA OTUs found in the three parallel replicate samples collected in the SC. Simple descriptive statistics of the proportions of each phylum were calculated. The arithmetic mean (AM) and the arithmetic standard deviation (SD) allowed computing the coefficient of variation (CV; SD/AM). The average CV of all phyla was also computed and assumed as representing the degree of similarity between the three samples. The AM and the CV were also calculated for Shannon’s and the Simpson’s indexes from the replicates samples. The calculation of simple descriptive statistics of the proportions of each phylum revealed CV values <10% (data not shown). For example, the proportion of Proteobacteria was 34.57% in SC1, 34.37% in SC2, and 33.04% in SC3 which corresponds to a CV (Proteobacteria) equals 2%. Furthermore, the average CV of all phyla was 9%. Descriptive statistics calculated from the replicates samples regarding the proportions of phyla revealed CV values <10%. The calculated CV for the Shannon’s and the Simpson’s indexes were <6%. These statistics suggest that bacterial and Eukaryota biodiversity can be assumed as repeatable.
Results
The biodiversity was estimated in the SC (three replicates) and compared to that of the OR.
Environmental and working conditions
The temperatures monitored in July 2014 in the SC and in the OR were 28°C and 29°C, respectively. The relative humidity of the air at the same points was 51% and 46%, respectively. During the sampling, the working activity in the WSP was continuous and regular and no particular malfunction such as stopping in the sorting line occurred. Two operators were working in the cardboard SC.
Assessment of biodiversity using deep sequencing
The outlines of high-throughput sequencing data obtained in the study are given in Table 1. For bacterial 16S rDNA, Illumina sequencing provided about 78600 reads in the OR sample and between 69600 and 100000 reads in the SC samples (Table 1). This corresponds to 581 OTU in the OR sample and between 842 and 1233 OTU in the SC samples. More than 80% of the sequences were assigned to bacterial OTUs in all the samples. The Shannon’s indexes were from 6.41 to 6.60 in the SC samples and 4.24 in the OR one (Table 1). In the three replicates, the mean Shannon’s index was 6.48 ± 0.10 (CV = 1.61%). The Simpson’s indexes were 0.1 in the OR and 0.02 in the SC samples, indicating that dominant bacterial genera were present in the two areas. For Eukaryota 18S rDNA, 454 pyrosequencing provided about 6600 reads for in the OR sample and between 14546 and 21206 reads for the SC samples (Table 1). This corresponded to 15 OTUs in the OR sample and about 40 OTUs in the SC. The Shannon’s indexes were 1.83 in the OR and 1.25 ± 0.07 (CV = 5.60%) in the SC. The Simpson’s indexes were 0.25 in the OR and about 0.45 in the SC.
Overview of high-throughput sequencing data obtained from bioaerosol samples taken in the WSP
| Parameters | SC1 | SC2 | SC3 | OR |
|---|---|---|---|---|
| Bacterial 16S rDNAa | ||||
| Number of reads | 100895 | 102 115 | 69655 | 78603 |
| Number of OTU | 1233 | 1326 | 842 | 581 |
| Number of unique sequences | 218 | 233 | 255 | 262 |
| Simpson’s index | 0.02 | 0.02 | 0.02 | 0.1 |
| Shannon’s index | 6.43 | 6.60 | 6.41 | 4.24 |
| Eukaryota 18S rDNAb | ||||
| Number of reads | 14546 | 16082 | 21206 | 6588 |
| Number of OTU | 38 | 42 | 41 | 15 |
| Number of unique sequences | 3 | 5 | 2 | 1 |
| Simpson’s index | 0.44 | 0.46 | 0.49 | 0.25 |
| Shannon’s index | 1.30 | 1.28 | 1.17 | 1.83 |
Bioaerosol samples were collected in the Sorting Cabin (SC) and in the Outdoor Reference (OR).
aIllumina sequencing.
b454 pyrosequencing.
Taxonomic diversity of airborne bacterial communities
The phylogenetic taxonomy analysis assigned >80% of the reads at the phylum rank, 70% at the family rank, and 60 % at the genus rank (see Supplementary Table S1, available at Annals of Work Exposures and Health online).
The four main phyla found in bioaerosol samples were Actinobacteria, Firmicutes, Proteobacteria, and Bacteroidetes (Fig. 1). They accounted for about 80% of the total reads for the SC and 83% for the OR. Unidentified 16S sequences represented 17% and 12% in the SC and in the OR, respectively. The other found phyla belonged to Chloroflexi, Cyanobacteria, Deinococcus-Thermus, and Planctomycetes and account individually for <2.5% of the total reads. Actinobacteria, Firmicutes, and Bacteroidetes showed higher proportions in the SC than in the OR (Fig. 1). Indeed, Actinobacteria and Firmicutes appeared to be more preponderant in bioaerosols that were emitted in the SC. Proteobacteria were the predominant phylum in all samples and in higher proportion in the OR sample.
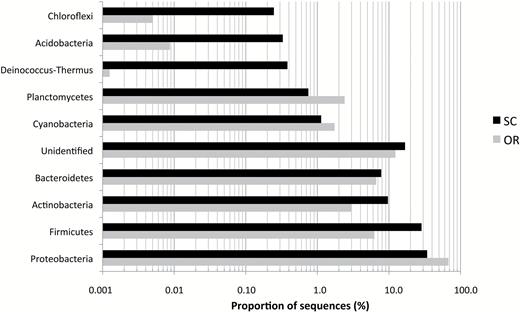
Bacterial biodiversity at the phylum Rank in bioaerosols from the WSP. Bioaerosol samples were collected in the Sorting Cabin (SC) and in the Outdoor Reference (OR). For practical reasons, only the mean of sequencing data from SC1, SC2, and SC3 are presented.
At the family rank (see Supplementary Table S2, available at Annals of Work Exposures and Health online), the specific richness was higher in the SC (78 families) than in the OR (59 families) samples. Most of these families belonged to the Proteobacteria phylum (26 in the SC and 23 in the OR) which accounted for 32% of the reads in the SC and 58% in the OR. In addition, 25% of the reads were assigned to Firmicutes families in the SC, whereas they only account for 6.3% in the OR. The 20 main families found in the SC are represented in the Fig. 2. The proportion of these families was between 9.34% (Entorobacteriaceae) and 0.83% (Aerococcaceae) in the SC and accounted for 57% of the bacterial reads. Others predominant families were Staphylococacceae (6.0%) and Pseudomonadaceae (5.0%).
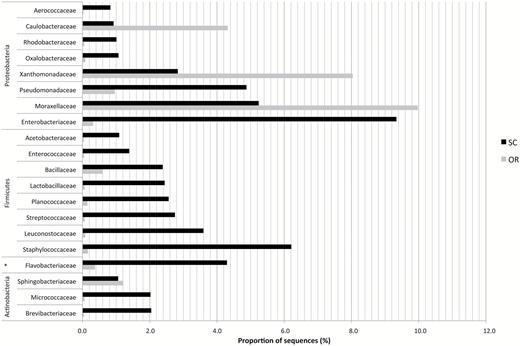
Bacterial biodiversity at the family rank in bioaerosols from the WSP. Bioaerosol samples were collected in the Sorting Cabin (SC) and in the Outdoor Reference (OR). Data are given for the 20 dominant families found in SC samples. For practical reasons, only the mean of sequencing data from SC1, SC2, and SC3 are presented. *Corresponds to Bacteroidetes.
The analysis of sequences at the genus rank revealed 112 bacterial genera in the SC samples (Supplementary Table S3, available at Annals of Work Exposures and Health online). Dominant airborne bacteria in SC samples were unclassified Enterobacteriaceae (8.38%), Staphylococcus (5.63%), Acinetobacter (4.48%), Leuconostoc (3.07%), Pseudomonas (2.99%), Lactobacillus (2.27%), unclassified Planococcaceae (2.15%), and Brevibacterium (2.04%). The analysis of sequences at the genus rank also highlighted differences between SC and OR. In the SC, 11 genera were observed with a 20-fold higher than in the OR (see Supplementary Table S3, available at Annals of Work Exposures and Health online). These 11 genera accounted for 25% (<1% in the OR) of total bacterial reads and belonged to Staphylococcus, Enterococcus, Streptococcus, Lactobacillus, Lactococcus, Leuconostoc, and Brevibacterium.
Biodiversity of airborne Eukaryota communities
The phylogenetic taxonomy analysis of 18S rDNA sequences revealed the occurrence of living organisms belonging to the Fungi and the Plantae kingdoms and assigned >99% of the reads at the phylum rank in the 4 collected samples (Supplementary Table S1, available at Annals of Work Exposures and Health online).
In SC samples, fungi represented 99.4% of the reads and the remaining ones were assigned to Plantae (0.12%) or remained unidentified (0.44%). The three main fungal phyla found in bioaerosol samples were Ascomycota (91.1%), an early diverging fungal lineage [Mucor and Rhizopus] (4.64%) and Basidiomycota (3.70%). Twenty-two fungal genera were found. The 10 dominant fungal OTUs represented 98.5% of eukaryotic OTUs with a predominance of the Penicillium, Aspergillus, and Rhizopus genera (Fig. 3a). Wallemia was the dominant Basidiomycota genus found in SC samples.
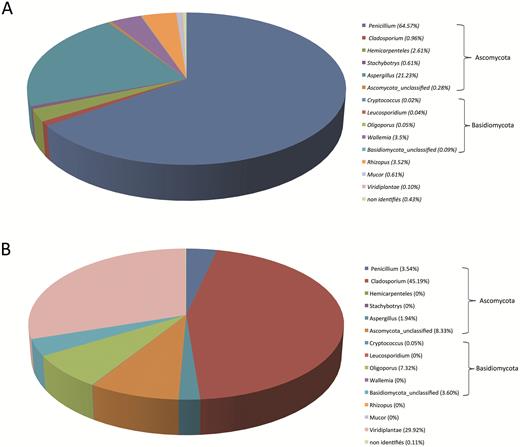
Fungal biodiversity at the genus rank in bioaerosols from the WSP. Bioaerosol samples were collected (A) in the Sorting Cabin and (B) in the Outdoor Reference. For practical reasons, only the mean of sequencing data from SC1, SC2, and SC3 are presented.
In the OR sample, fungi and Plantae represented 70.0% and 29.9% of the reads, respectively, and the remaining ones were unidentified (0.1%). The two fungal phyla found in bioaerosol samples were Ascomycota (59.0%) and Basidiomycota (11.0%); fungi belonging to the ‘early diverging fungal lineage’ were not found. The dominant outdoor fungal genera were Cladosporium (45.2%), unidentified Ascomycota (8.3%), Oligoporus (7.3%), unidentified Basidiomycota (3.6%), and Penicillium (3.5%). Biodiversity also consisted of others Eukaryota such as Viridiplantae (Fig. 3b).
Discussion
Bacterial and fungal biodiversity in the WSP
Very few data have been published regarding the biodiversity of airborne bacterial and fungal particles in industrial plants sorting household waste. Furthermore, the available biodiversity data were obtained by culture of microorganisms followed by macroscopic and/or microscopic identification as well as biochemical identification. Thus, we have found no equivalent results in previous published studies to which our findings could be compared to.
The first analysis of NGS data indicates a higher biodiversity in samples collected in the SC as compared with the outdoor one. Furthermore, biodiversity indexes showed that bacterial biodiversity was higher than Eukaryota biodiversity. Fungal genera were more present in equi-proportion than bacterial genera.
For airborne bacteria, in a plant located in Finland where household wastes were sorted, bioaerosols were dominated by unidentified Gram-positive and Gram-negative cultivated bacteria and by bacteria belonging to Pseudomonas, Bacillus, and Micrococcus (Rahkonen, 1992). In a Danish paper sorting plant, Breum et al. (1999), found that airborne cultivated bacteria were dominated by Gram-positive bacteria, including Staphylococcus and Bacillus species, and Actinomycetes. Cultivated bacteria belonging to Staphylococcus, Bacillus, Streptococcus, or Micrococcus genera were also found in others studies carried during landfill (Breza-Boruta, 2012), glass sorting (De Vasconcelos Pinto et al., 2015), and waste collection (Nielsen et al., 1995; Madsen et al., 2016). In these studies, bacterial identification was usually achieved on a limited number of colonies and using Gram staining, metabolic tests, gas chromatography, or mass spectrometry after cells culture. Data from previous biodiversity studies in the waste treatment sector provided similarities with our results regarding dominant bacterial taxa such as Staphylococcus, Pseudomonas, and actinomycetes. They also provided differences as Bacillus was not found in great portion in our study as compared previous published ones. Differences found in bacterial taxa might be explained by the methods used for assessing biodiversity as well as the geographic and climatic changes in bioaerosol biodiversity (Smets et al., 2016). Furthermore, due to the limits of the sequencing methods, the bacterial biodiversity could not be assessed at the species level in the study. Indeed, the DNA fragments sequenced by the Illumina technology were too short and the genetic target was too preserved to allow identification at the species level with a good accuracy. So, the NGS provided insufficient information for an accurate bacterial risk evaluation. To assess the bacterial risk, others methods such as the identification of cultured bacteria using MALDI-TOF could be used in addition with the sequencing.
For airborne fungi, findings from our study are in agreement with previous published studies for similar activities. Indeed, airborne cultivated fungi belonging to the Penicillium genus was found prevalent during sorting of household waste, while the Aspergillus, Rhizopus, Cladosporium, Geotrichum, and Chrysonilia genera were also common (Breum et al., 1999; Tolvanen, 2001; Tolvanen and Hänninen, 2006; Malta-Vacas et al., 2012; Lehtinen et al., 2013; Viegas et al., 2014). Aspergillus fumigatus was also detected in bioaerosol samples collected in WSP by the culture method (Tolvanen, 2001; Tolvanen and Hänninen, 2006) as well as by PCR (Malta-Vacas et al., 2012). The genus Penicillium was also found to be dominant in other studies carried during out glass sorting (De Vasconcelos Pinto et al., 2015) and during waste collection (Madsen et al., 2016). In the latter study, the authors found 11 Penicillium species as P. brevicompactum, P. camemberti, or P. chrysogenum after identification of colony using MALDI-TOF MS. They also observed six Aspergillus species including A. nidulans, A. niger, and A. versicolor. This suggests that a substantial biodiversity can be found at the species level in bioaerosols emitted during waste collection. Such a biodiversity is expected in WSPs, however, as for the bacterial biodiversity, the methods used in the present study did not allow identifying the fungal sequences at the species level.
The NGS biodiversity data from the present study revealed a far more important diversity than expected from the culture data as 112 different bacterial genera. In others studies, the authors observed from 20 bacterial genera and up to 38 bacterial species using culture-based methods (Rahkonen, 1992; Nielsen et al., 1995; Breum et al., 1999; De Vasconcelos Pinto et al., 2015; Madsen et al., 2016). The fungal diversity was more important than expected from culturing approach since 22 different genera were identified in our study versus only 2 to 8 in previous reports (Breum et al., 1999; Tolvanen, 2001; Tolvanen and Hänninen, 2006; Malta-Vacas et al., 2012; Lehtinen et al., 2013; Viegas et al., 2014). Thus, NGS provides a deeper accuracy of the types of microorganisms to which WSP workers might be exposed. To our knowledge, these results are the first report of bacterial and fungal biodiversity survey, using a metagenomics approach, published about bioaerosol emitted in WSP.
Cardboard SC versus Outdoor
The first analysis of high-throughput sequencing data indicates a higher biodiversity in samples collected in the WSP than in the OR. The dominant bacterial genera were different in the OR and in the SC and the composition of bioaerosols were different in the two areas whatever the taxon rank considered. Differences in biodiversity were also observed between OR and SC samples; the outdoor Eukaryota community was specifically dominated by Cladosporium and Plantae. Such differences were already reported regarding the fungal community (Malta-Vacas et al., 2012; De Vasconcelos Pinto et al., 2015). Our findings showed that WSP workers are exposed to a specific bioaerosol at their workstation.
Significance of NGS biodiversity findings
Several bacterial genera found in the present study were associated with human or animal skin, mucous membrane, or intestinal tract such as, Staphylococcus (Schleifer and Bell, 2009), Enterococcus (Svec and Devriese, 2009), and Streptococcus (Whiley and Haride, 2009). Bacteria from dairy milk or meat were also found such as Lactobacillus (Hammes and Hertel, 2009), Lactococcus (Teuber, 2009), Leuconostoc (Holzapfel et al., 2009), and Brevibacterium (Brennan et al., 2002). Bacterial biodiversity in the SC appears related to the occupational activities due to the origin of waste (domestic environment) as well as the presence of workers. This might explain the differences observed between the two sampling area.
The fungal genera found in our study include species that were associated with allergenic symptoms, opportunistic infection in immunosuppressed patients (Aspergillus fumigatus) or known as MVOC or mycotoxin producers (Fischer et al., 2000). The phylogenetic taxonomy analysis of 18S rDNA sequences allowed highlighting the occurrence of slow growing fungi belonging to the Stachybotrys and the Wallemia genera. These genera include harmful species that were almost never cited in previous works. Thus, culture-based methods provide essential information, but they do not allow a global characterization of Eukaryota biodiversity. This confirms that NGS may provide a new view regarding the types of microorganisms to which WSP workers might be exposed to.
Limits and perspectives of the study
The present study was carried out with a limited number of samples and only three occupational bioaerosols and one reference were analyzed. This is not enough to draw definitive conclusion about the exposure of workers to microorganisms at the sorting plant. Indeed, due to the complexity of the bioaerosols composition and to confirm the difference between the SC and the OR, additional samples need to be collected in order to confirm these first results of biodiversity in a WSP. Data analysis showed that the Simpson’s and Shannon’s indexes were very close among the three replicates. Furthermore, the proportions of bacterial families found in the WSP bioaerosol appeared in the same range from a sample to another one. This suggests that the biodiversity measurement process is repeatable but additional statistical analyses are needed to comfort this. The study shows the usefulness of NGS-based biodiversity measurements for occupational hygiene purposes in WSP but additional research is required to investigate more precisely the microbial composition of bioaerosols in this environment. Especially, studies are needed with more numerous bioaerosol samples collected in different WSP, at different working area in WSP and also at different moment of the year. The NGS is a qualitative method, to get a better understanding of the microbial exposure; the microbial concentration must be assessed using molecular biology methods such as qPCR or culture-based ones.
In the study, the 18S rDNA what used as target gene for the assessment of fungal biodiversity in bioaerosols. This approach reveals that Fungi were the most Eukaryota communities in the SC. Furthers studies, should focus on fungal biodiversity using the ITS (internal transcribed spacer) barcode which give a better taxonomic resolution for Fungi (Schoch et al., 2012).
NGS technologies have also some biases that were not addressed in our investigation. The metagenomics DNA must be of good quality to allow its sequencing. Biodiversity studied by NGS is also affected by the DNA extraction efficiency. Indeed, some microbial species can be preferably extracted depending on the DNA extraction method (Haugland et al., 1999). In addition, errors were reported due to PCR biases in the sequences library preparation and to data analysis (sequences alignment). Illumina technologies provide short reads (150 pb for HiSeq and 250 pb for Miseq), these shorts reads are aligned with reference sequences to get a match probability. The incorrect annotation of reference sequences in the database can introduce mistakes in data analysis (Nilsson et al., 2006; Yamamoto et al., 2014). Because of these facts, the biodiversity, in our study, can only be assessing at the genus level (deeper assignment). But, an assessment of biodiversity at the species level is possible with an increase of the reads size using another sequencing technology as PacBio sequencing. Furthermore, a sequencing of the entire ITS region, rather than the ITS2 sequencing, can provide an accurate method to assess the fungal biodiversity at the species level (Yamamoto et al., 2014). Error factors due to NGS methods are sometimes not suspected by the users or difficult to suppress. Previous studies showed that bioinformatics steps can reduce the impact of these factors (Bellemain et al., 2010; Ovaskainen et al., 2010; Gihring et al., 2012; van Dijk et al., 2014; O’Rawe et al., 2015). Biodiversity studied by NGS is also affected by the DNA extraction efficiency and as well as the accuracy annotation of the sequences in the data basis (Nilsson et al., 2006; Yamamoto et al., 2014). Nevertheless, NGS is a useful approach to describe microbial communities in occupational area, in addition to cells culture methods. To improve the biological risk evaluation, the colonies can be identified using MALDI-TOF MS for identification at the species level of the main culturable genera which has been demonstrated to provide complementary data as compared to Illumina sequencing (Madsen et al., 2015). The metagenomics approach makes it possible to assess the microbial diversity as never before by removing the limits of the microbial culturability biasing the previous biodiversity studies. On the other hand, if the sequencing showed a higher biodiversity at the genus level, it did not provide any information about the bacterial or fungal species present in the bioaerosols. In furthers studies, an identification of microbial colony could be performed in addition to the sequencing to get information about the microbial biodiversity at the species level. The use of metagenomics made it possible to describe for the first time the biodiversity of bioaerosol in WSP overcoming such culture bias and provided a finer description of bioaerosol composition that may be inhaled by exposed WSP workers.
Conclusion
In the present study, the bacterial and fungal abundance in bioaerosols from a WSP treating household waste were revealed for the first time using 16S rDNA Illumina sequencing and 18S rDNA 454 pyrosequencing methods, respectively. The results showed that the components of airborne microbial communities were assigned to 4 phyla and 112 genera for bacteria and to 3 phyla and 22 genera for fungi. In the WSP, airborne bacteria were dominated by Proteobacteria, Firmicutes, and Actinobacteria with prevailing genera assigned to unclassified Enterobacteriaceae, Staphylococcus, Acinetobacter, Leuconostoc, Pseudomonas, and Lactobacillus. Airborne fungi were dominated by Ascomycota with prevailing genera assigned to Penicillium, Aspergillus, Rhizopus, Wallemia, and Hemicarpenteles.
The NGS biodiversity measurements performed in the present study revealed a higher biodiversity in WSP bioaerosols than the one previously reported in studies carried out using culture methods followed by identification of microorganisms. This suggests that NGS would provide a greater accuracy than culture-based methods regarding the types of microorganisms to which WSP workers might be exposed to. Furthermore, different microbial communities were found in the SC as compare with the outdoor air, which support the hypothesis that biodiversity in bioaerosols emitted in the WSP maybe specific to waste sorting activities.
The biodiversity measurement process provided repeatable results. However, further studies based on a larger number of samples and other targeted genes (ITS, genes involved in microbial pathogenicity or in the expression of allergens etc.) are needed to confirm these primary results and to investigate the uncertainty of biodiversity measurements as well as the variation of airborne microbiomes in time and in space at occupational settings.
Supplementary Data
Supplementary data are available at Annals of Work Exposures and Health online.
Declaration
Funding for this project was provided by the INRS. The authors declare no conflict of interest relating to the material presented in this Article. Its contents, including any opinions and/or conclusions expressed, are solely those of the authors.
Acknowledgements
The authors would to kindly acknowledge Catherine Coulais and Véronique Koehler for their valuable technical assistance.
References
