


Abstract
Aims: Evaluate effectiveness and costs of brief interventions for patients screening positive for at-risk drinking in managed health care organizations (MCOs). Methods: A pre-post, quasi-experimental, multi-site evaluation conducted at 15 clinic sites within five MCO settings. At-risk drinkers ( N = 1329) received either: (i) brief intervention delivered by licensed practitioners; or (ii) brief intervention delivered by mid-level professional specialists (nurses); or (iii) usual care (comparison condition). Clinics were randomly assigned to three study conditions. Data were collected on the cost of screening and brief intervention. Follow-up interviews were conducted at 3 and 12 months. Results: Participants in all three study conditions were drinking significantly less at 3-month follow-up, but the decline was significantly greater in the two intervention groups than in the control group. There were no significant differences between the two intervention conditions. Of the patients in the intervention conditions 60% reduced their alcohol consumption by ≥1 drink per week, compared with 53% of those in the control condition. No differences were found on a measure of the quality of life. Differential reductions in weekly alcohol consumption between intervention and control groups were significant at 12-month follow-up. Average incremental costs of the interventions were $4.16 USD per patient using licensed practitioners and $2.82 USD using mid-level specialists. Conclusion: Alcohol screening and brief intervention when implemented in managed care organizations produces modest, statistically significant reductions in at-risk drinking. Interventions delivered to a common protocol by mid-level specialists are as effective as those delivered by licensed practitioners at about two-thirds the cost.
( Received 17 February 2006; first review notified 22 March 2006; in revised form 25 August 2006; accepted 25 August 2006)
INTRODUCTION
Excessive alcohol consumption is estimated to cost the United States economy $184.6 billion annually ( Harwood et al ., 1998 ) in medical, social, and productivity losses. Virtually all such costs are preventable, if those who drink would follow established guidelines for moderation ( U.S. Department of Agriculture, 2000 ). Contrary to conventional wisdom, most excessive drinkers are not alcohol dependent ( Ashley et al ., 1994 ; Caetano et al ., 2002 ) and may be able to reduce their alcohol consumption without specialized treatment.
Alcohol screening and brief intervention (SBI) techniques for at-risk drinkers have been tested in randomized clinical trials in a variety of health care settings. Efficacy studies of brief interventions have been summarized in several review articles and meta-analyses, which largely suggest positive and clinically meaningful drinking outcomes ( Bein et al ., 1993 ; Kahn et al ., 1995 ; Wilk et al ., 1997 ; Moyer et al ., 2002 ; Whitlock et al ., 2004 ). Evidence for the validity of SBI is sufficient to convince the U.S. Preventive Services Task Force (2004) to recommend it in routine medical practice. However, there has been little systematic research to evaluate the effectiveness and cost of SBI under conditions approaching typical clinical conditions ( Babor and Higgins-Biddle 2000 ; Babor et al ., 2005 ). This study was designed to evaluate brief interventions for at-risk drinkers under ‘real-world’ conditions within managed care environments using a quasi-experimental, multi-site evaluation design. Multi-site evaluations are studies conducted simultaneously in multiple geographic locations (e.g. clinics in different communities) to provide generalized knowledge that can be used to improve programs in other locations ( Herrell and Straw 2002 ). This approach allowed us to evaluate the effectiveness and cost-effectiveness of two models of delivering SBI in five managed care organizations (MCOs) as compared with the usual care. Given the positive results of randomized clinical trials, we expected to find significantly greater reductions in alcohol consumption for patients exposed to brief interventions, but the effects were not expected to be as consistent or as strong as those demonstrated in clinical trials, where screening and brief interventions tend to be delivered under optimal research conditions that may not generalize to routine medical settings.
METHODS
Research design
Five MCOs were recruited in the West, Southwest, Midwest, and Northeast regions of the United States. Four MCOs were exclusive group model Health Maintenance Organizations (HMOs); one was a consortium of independent practices. MCO eligibility criteria included the availability of at least three comparably sized Family or Internal Medicine clinics with annual visits of at least 7000 unduplicated adult patients, an MCO liaison to coordinate SBI activities, and no current alcohol screening programs. MCOs were reimbursed for some, but not all, costs of participation, including data collection. One MCO was able to involve only two clinics, and another MCO involved four clinics. Thus, a total of 15 practices participated.
The study employed a pre-post repeated measures group design to compare at-risk drinkers in three study conditions. In one condition (designated P for practitioner), licensed physicians, physician assistants and nurse practitioners delivered the brief interventions as part of a regular medical visit. In another study condition, (S for specialist), mid-level professionals (usually nurses) performed that duty. In the P conditions 61.2% of interventions were delivered by MDs and 38.8% by PAs and NPs, whereas in the S condition non-physicians delivered 94.4% of interventions. The remaining clinics, which provided the usual care, constituted a comparison, C , condition. The 15 practices were randomly assigned to these study conditions within each MCO. The procedure consisted of having an independent statistician (who was not a member of the study team) assign clinics to the three study conditions using a table of random numbers.
Implementation procedures
A comprehensive SBI implementation process was designed and pilot-tested in the project planning phase. The essential elements of the operations protocol were established, patient materials were designed, and the program was branded ‘Cutting Back.’ After planning, teams in each intervention clinic adapted the common protocol to the practice setting, all clinical staff at each practice site were invited to 3 h of training conducted by a physician trainer and the research team's site consultant ( Babor et al ., 2004 ). The curriculum, designed especially for the program, used a practical, systems approach emphasizing the functions required of each staff member, and included practice in screening and providing interventions. Clinics were given 1–2 weeks to practice SBI procedures before data collection began.
Screening protocol
All patients aged ≥18 years were to be offered participation in the study, which was described as involving health education for the improvement of health habits. Eligible patients who provided informed consent at check-in completed a 13-item Health Appraisal Survey (HAS). The survey asked about exercise, dieting to lose weight, cigarette smoking and included the first three questions of the Alcohol Use Disorders Identification Test (AUDIT; Babor et al ., 2001 ), a well-validated alcohol screening instrument developed by the World Health Organization ( Allen et al ., 2001 ).
The AUDIT questions were adapted as recommended by the AUDIT manual ( Babor et al ., 2001 ) to the American standard drink of 14 g. (0.5 oz.) and the US national drinking guidelines [ National Institute on Alcohol Abuse and Alcoholism (NIAAA), 1996 ] of no more than 14 drinks per week or 4 per occasion for men up to age 65 and no more than 7 drinks per week or 3 per occasion for all women and for men over age 65. To approximate these guidelines, the third AUDIT question was changed to ask how often a patient had ≥4 drinks on one occasion, in contrast to the international standard of ≥6 drinks. Additionally, the response alternatives were expanded in all three questions from five to seven, thereby making it possible for finer distinctions between: (i) monthly, weekly, and daily drinking (e.g. 2–3 times a week); and (ii) the number of drinks consumed in a typical day; and (iii) the frequency of consuming ≥4 drinks. With these changes, cut-offs of seven points for women and older men and eight points for younger men were selected to identify patients as drinking above moderation guidelines and thus at-risk of alcohol-related harm.
In the comparison, C, clinics only the HAS screening was conducted. The results of the screening were not shared with providers, although they did know that a study of alcohol SBI was being conducted and that their practice was participating as a control site. Clinic administrators were asked, however, to provide patient care as usual and not to initiate any new alcohol programs for at least one year after the completion of screening in their clinics to prevent contamination effects during the follow-up period.
In the intervention clinics (P and S), patients who scored above the HAS cut-offs were deemed positive for at-risk alcohol use and eligible for an intervention. Positive patients were asked to complete the full 10-item AUDIT, with only the above-mentioned modification of question three, to provide additional information on alcohol-related problems and signs of dependence. This procedure was usually administered by nurses in the P condition and by specialists in the S condition.
Intervention protocol
The modified AUDIT produced a numeric total score, which was used to place a patient into one of three ‘Zones,’ each of which called for a different level of intervention. Zone I (a score of 7–15 for women and men >65 years; 8–15 for men <65 years) called for giving patients advice and an information brochure. Zone II (scores 16–19) required provision of advice and a more extensive self-help manual. Zone III (scores >19) specified advice and referral to specialty care for alcohol assessment and, presumably, treatment. These zones are consistent with the most recent guidelines recommended for screening with the AUDIT ( Babor et al ., 2001 ). The screening form included places for providers to indicate the action taken, or to explain why the recommended action was not taken, and to record their provider code.
The Zone I intervention of simple advice was delivered in ∼3–5 min in conjunction with the brochure. It consisted of five elements: (i) feedback of screening scores and any problems or symptoms identified; (ii) discussion of the patient's risk level; (iii) connection of drinking risk to actual or potential problems and information about safer drinking limits; (iv) commitment to a goal of cutting back or stopping; and (v) presentation of the brochure and encouragement to reach the established goal. The brochure was specially designed for the study and contained a risk indicator, steps to cutting back, tips for success, a list of alcohol-related problems, sensible drinking limits, and illustrations of standard drinks. The manual used with Zone II patients contained an expanded version of this information with additional opportunities for patients to record experiences and plan their course of action. Providers were asked to refer Zone III patients for alcohol assessment and, if warranted, treatment, and to follow up as they would for any other serious health risk. In S clinics physicians were asked to reinforce the intervention of the specialists either before or after its delivery.
Follow-up Interviews
Follow-up evaluations were conducted by an independent survey organization using a computer-assisted telephone interview. Interviewers were not informed of the study condition (Comparison, S, P) to which patients were randomly assigned. Follow-up calls were initiated ∼3 and 12 months after the initial recruitment into the study. Every 3 weeks the survey organization was provided with a list of study participants who were due for follow-up interviews. All 3-month interviews were drawn randomly from this sampling frame. Each pending case was called a maximum of 10 times. The reason for random sampling of participants was because our power calculations did not demonstrate the need to interview every participant at follow-up and our resources did not permit us to do this. By randomly sampling participants at the 3-month follow-up we were able to minimize any bias resulting from sampling earlier versus later participants in the recruitment process. For the 12-month follow-up survey, every individual who completed the 3-month interview was called. In addition, 35 cases were added to the 12-month follow-up from a sample of 44 patients who were not successfully contacted at 3 months but were called at 12 months).
The 3- and 12-month interviews included 12 questions about health and daily living activities (SF-12); the 10 AUDIT questions; 3 questions about travel time to the clinic; and 6 demographic questions. The SF-12 ( Ware and Sherbourne 1992 ) is a 12-item modified version of the 36-item SF-36 general health questionnaire that focuses on eight dimensions of health: general health, physical functioning, psychological distress, role-limitations due to physical health problems, role-limitations due to emotional problems, bodily pain, vitality (energy and fatigue), and limitations on social activities because of physical or emotional problems. Scale scores range from 0 to 100, and are sensitive to differences in disease severity. Higher scores suggest better health-related quality of life. The scale was not administered at baseline to minimize response burden on the participants.
Measures
A quantity–frequency measure, derived from the first two AUDIT questions, quantified the number of drinks per week reported as consumed by the patient. This was used as the primary outcome measure. In addition, several measures of alcohol consumption and related problems were used as secondary outcomes. The third AUDIT question, for measuring the frequency of consuming four or more drinks, was used as a measure of occasional high-risk alcohol consumption. A related secondary outcome measure, which we call the “Drinkers' Index”, consisted of a summary score of the first three AUDIT items, which represents a combination of quantity, usual frequency, and frequency of heavy drinking. The SF-12 quality of life measures were also evaluated as secondary outcomes.
Cost data collection
Data were gathered on the MCO's ongoing implementation costs, which included the costs of the health appraisal, AUDIT screening, and delivery of the intervention ( Zarkin et al ., 2003 ). Specifically, data were gathered on: (i) the number of minutes it usually took to administer the health appraisal, screen, and intervention; (ii) the wages of people who performed these activities; and (iii) the location where these activities were usually performed (e.g. reception area, examining room, private office). Data were also gathered on the number and production costs of health appraisal, screening, and intervention materials used at each site.
Eligibility criteria
Eligibility criteria included age (≥18 years), membership in the MCO, ability to complete the brief screening questionnaire, and reported drinking in excess of the HAS scoring cut-offs described above. Overall, 10.9% of patients screened positive for at-risk drinking. Prevalence of at-risk drinking varied among the 15 MCO sites from a low of 2.8% to a high of 15.0%.
Response rate and non-response bias
Figure 1 provides a flow chart of the response rate during different stages of sample identification and selection. Once the screening program was operational in the 15 clinics, 66 401 patients who appeared to be eligible (based on apparent age) were approached in the waiting areas of the study sites. Of these, 83.6% (55 540) agreed to complete the screening form. No information was available on the 16.4% who refused to be screened, but anecdotal reports indicated that many were too ill or too busy to participate. After the screening form was scored at each site, 9.2% of the patients were ineligible, primarily because they were too young or did not belong to the MCO. Eligible patients were distributed relatively evenly across the C (34.2 %), the P (34.2%) and the S clinics (31.6%). In the C clinics 1955 patients screened positive and were, thus, eligible to be sampled for follow-up. In the P and S clinics, 1151 and 1124 patients, respectively, of the eligible patients received an intervention. Some eligible patients did not receive an intervention because the clinic staff were unable to deliver it. As reported in Babor et al ., ( 2005 ) 57.l% of the at-risk drinkers received an intervention at the P clinics, whereas, 73.1% received an intervention at the S clinics. The flow chart also shows that not all patients who received an intervention were sampled for the 3-month follow-up. Comparison of patients eligible and sampled for follow-up with those who were eligible and not sampled indicated no significant differences in terms of drinks per week, frequency of heavy drinking and age. However, selected patients were slightly more likely to be female (60.5%) than non-selected patients (56.5%), [χ2 for (i) = 5.87, P < 0.05].
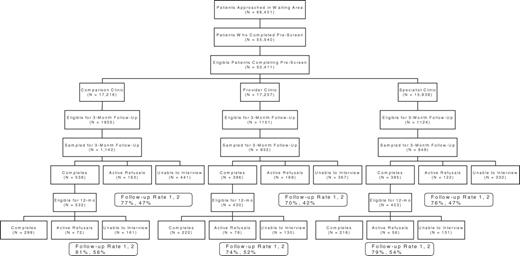
Response Rate Flow Chart.
As indicated in the flow chart, participants sampled for the 3-month follow-up interview were separated into three categories: (i) those who completed the follow-up interview; (ii) those who actively refused by telling the interviewer they did not want to be interviewed; and (iii) those who were unable to be contacted because they had moved, their telephone had been disconnected, or did not respond after 10 telephone calls. Comparison of those who completed the interview with those who were not interviewed (active refusals plus unable to interview) indicated no significant differences in drinks per week and gender distribution. However, the two groups differed in terms of age and the frequency of drinking ≥4 drinks per occasion. Those who completed the 3-month interview were ∼4 years older (43.4) than those who did not (39.0), ( t [2698] = 7.71, P < 0.0001). To estimate representativeness of the follow-up samples, we calculated the effective follow-up rate within each study condition in two ways; first by not including the ‘unable to interview’ (UTI) group in the denominator (overall rate, 74.5%), and second by including them in the denominator (overall rate, 45.5%). These two statistics represent the upper and lower estimates of representativeness, to the extent that we do not know how many of the UTI group would have participated had they been contacted. Regardless of the follow-up rate considered, there were no differences across the three study conditions in the proportions of those interviewed (χ 2 for (ii) = 8.75, n.s.). Similar results were obtained for the 12-month follow-up evaluation, which is based on those patients who agreed to participate in 3-month follow-up.
Characteristics of study sample
The final sample of 1329 patients who were interviewed for the 3-month follow-up consisted of 58.5% males and 41.5% females. The average age was 45.9, with the male and female participants averaging 47 and 42 years, respectively. At the time of screening the men averaged 13.8 drinks per week, with 3.6 occasions per month of ≥4 drinks per occasion. The women averaged 8.7 drinks per week and 1.3 occasions per month of ≥4 drinks. Participants in the P, S and C study conditions were compared on baseline characteristics to evaluate whether the three samples differed significantly from one another. There were no significant differences in drinks per week, age, or gender distribution. Where differences were found (frequency of ≥4 drinks per occasion), they accounted for <1% of the variance and were therefore not considered clinically meaningful.
Statistical analyses
The primary outcome was the number of drinks per week. Secondary measures consisted of the frequency of heavy drinking (≥4 drinks per occasion), the sum of the first three AUDIT questions, and the SF-12 measures of Quality of Life for physical and mental functioning. Primary outcomes were evaluated using repeated measures analysis of covariance. Factors entered into the model were time, gender, age, a dichotomous measure of whether or not a participant was over the NIAAA weekly guidelines, MCO site, study condition and their respective interaction terms. Reduction of the model included using a Type I sums of squares sequential modeling technique and a p-value of .05 for statistical significance. Due to the large sample size, strength of association was also measured between the outcome measure and the independent variables. Variables accounting for <1% of the variance were excluded from the model. The Time By Study Condition interaction term was the primary statistical test of interest. Power analysis calculations indicated that the sample sizes of the three study conditions were more than adequate to detect ‘small’ effect sizes at the 3-month follow-up according to Cohen's (1988) calculations for a three-group study design. Although the 12-month analyses were somewhat underpowered for a small effect size because of participant attrition, it should be noted that the lack of differences between intervention conditions resulted in two-group contrasts between the control group and the combined intervention groups.
Logistic regression techniques were employed to evaluate the effect of brief intervention on the probability that patients decreased their weekly consumption of alcohol. A decrease in consumption was defined by a reduction of ≥1 drink(s) per week at follow-up. Factors entered into the model were gender, site, study condition, and the covariates age and baseline drinks per week, along with their interaction terms. Significance at the entry step was first determined and significance of the final Wald test was reported. Since the nesting of sites within MCO's was complex and produced an extremely unbalanced as well as incomplete factorial design, our attempt at analyzing site within MCO was not successful: there was a failure of the iterative calculations to converge unless a less complex design was structured. We therefore removed MCO from the list of predictors and allowed unanalyzed systematic variance to remain part of the error variance in the design, rendering the design conservative.
Cost analysis
The labor costs of the health appraisal questionnaire, AUDIT screening, and intervention were estimated as the product of the average number of minutes spent by MCO staff on these activities for each patient and the weighted average wage per minute. Because appraisal and screening were performed in large reception areas, a standard estimate of per capita square footage occupied by each patient was used. Space costs for these activities were then estimated as the product of the per capita space, the dollar value of that space, and the average number of minutes spent on health appraisals and screening. The same methodology was used for intervention space costs except that the space allocation per patient was equal to the size of the clinic's examining room. Media cost represented the reproduction costs of screening and patient education materials. The implementation costs for the S and P models were calculated for each MCO. Because the screening and health appraisal activities were similar by design in the S and P clinics, the median costs of these activities across all clinics are reported. Separate median estimates are reported for the S and P intervention costs.
RESULTS
Table 1 presents the means, standard deviations and F statistics for the ANCOVA conducted on the primary outcome measure, drinks per week. Model reduction indicated no time-by-gender or time-by-age effects, so these variables were not included in the analysis. The results indicate a significant main effect for time, with participants in all three study conditions showing reductions in drinks per week between baseline and the 3-month follow-up. In addition, there was a significant time-by-condition interaction. A priori orthogonal contrasts showed significant differences between the comparison (C) condition and the combined intervention (P and S) conditions [ F (1,1315) = 5.64, P = 0.018]. Although the difference was statistically significant, the effect size was small, accounting for approximately one percent of the variance. There were no significant differences in patient outcomes between the P and the S conditions [ F (1,1315) = 1.20, P = 0.27]. To determine whether the specific professional characteristics of the provider affected outcomes, physicians from the P condition were compared with non-physicians from both P and S conditions. No significant differences were found [ F (1,765) = 2.58, n.s.]. All subsequent analyses, therefore, combine P and S patients. Additional analyses evaluated the differential effects of brief intervention on at-risk drinkers who had different levels of weekly consumption, heavy episodic drinking, and AUDIT scores. No subgroup differences were found in relation to these variables.
Changes in drinks per week from baseline to 3-month follow-up
| Condition | |||||
|---|---|---|---|---|---|
| Charachteristics | Control (C) | Specialist (S) | Provider (P) | ||
| Males and females ( N ) | 539 | 394 | 389 | ||
| Baseline month | 11.3 | 11.3 | 9.6 | ||
| −(SD) | (6.6) | (6.9) | (6.4) | ||
| +(SD) | (9.5) | (10.1) | (9.8) | ||
| Follow-up month | 8.1 | 6.7 | 5.7 | ||
| −(SD) | (6.3) | (5.6) | (5.0) | ||
| +(SD) | (11.0) | (10.4) | (9.7) | ||
| F -Statistics | |||||
| Condition | 2.08 | ||||
| Time | 228.53 ** | ||||
| Site | 1.85 | ||||
| Under/over limit | 775.80 ** | ||||
| Time × condition | 4.30 * | ||||
| Time × site | 2.82 | ||||
| Time × under/over limit | 81.96 ** | ||||
| Time × site × condition | 2.24 * | ||||
Adjusted means (SDs) and ANCOVA results.
* 0.001 ≤ P -value < 0.05.
**P -value ≤0.0001.
The analyses of the primary outcome measure were repeated using two different intention to treat assumptions. The first and most conservative assumption substituted baseline drinking values for missing follow-up data. The results showed no significant time-by-condition (C versus P and S) interaction effect [ F (1,2918) = 2.70, P = 0.10]. In addition, the same analysis was repeated among the ‘completes’ and active refusals only. There was no statistically significant time-by-condition (C versus P and S) difference [ F (1,1778) = 2.95, P = 0.086], but both analyses produced P -values [ P < 0.10) that could be interpreted as trends. Next, all non-respondents missing follow-up data were imputed with C condition average weekly alcohol consumption values. There was a significant time-by-condition interaction [ F (1,2902) = 7.00, P = 0.008]. Including only active refusals of the non-respondent group also resulted in a statistically significant interaction term [ F (1,1774) = 6.46, P = 0.011]. Taken in their entirety, these intention to treat analyses provide general support for the robustness of the main study findings.
Additional analyses were conducted using a χ 2 -test statistic to evaluate the proportions of patients in C versus P and S study conditions whose drinking decreased, increased or remained the same, as indicated by changes of ≥1 drink per week following the intervention. The results, illustrated in Fig. 2 , show a significant difference between the proportions of patients in the C versus P and S conditions whose weekly consumption of alcohol decreased, increased or remained the same (χ2 for (ii) = 6.26, P = 0.044). Whereas 60% of the patients in the intervention condition had reduced their drinking, 53% of those in the C condition had done so.
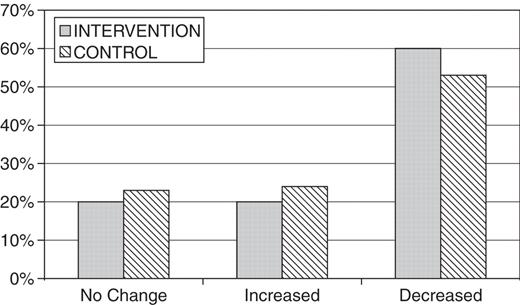
Percentages of at-risk drinkers who had increased, decreased or showed no change in their alcohol consumption 3 months after a brief intervention.
Logistic regression techniques were used to evaluate reductions in weekly alcohol consumption given that patients decreased consumption at follow-up. Among the patients decreasing their drinking at follow-up, there was a significant entry step for study condition (Comparison versus Intervention) (χ2(i) = 6.53, P = 0.011) and a significant final Wald test (6.64, P = 0.010, B = 0.29), such that those in the Intervention conditions were more likely to have decreased their weekly consumption of alcohol by at least one drink per week than the Comparison condition. This result indicates a small effect size (Cox and Snell R2 = 0.02).
Analysis of the “Drinkers' index”, a combined measure of regular weekly consumption and occasions of >4 drinks, using 3-month follow-up data, indicated significant time [ F (1,1316) = 390.13, P < 0.000] and time-by-condition [ F (2,1316) = 3.87, P = 0.021] interaction effects, with the planned contrasts again showing significant differences between the Comparison and intervention groups [ F (1,1316) = 5.46, P = 0.020] but no differences between the two intervention conditions [ F (1,1316) = 2.26, P = 0.133].
Fig. 3 shows the duration of the intervention effect for the primary outcome measure over the 12-month follow-up period by comparing baseline, 3- and 12-month drinks per week among those participants who were interviewed at all three times. The results indicate significant effects for time [ F (2,1416) = 135.57, P < 0.000] and the time-by-condition interaction [ F (4, 1416) = 3.65, P = 0.006]. Planned contrasts showed significant differences between the C and the P and S groups [ F (2,1416) = 6.49, P = 0.002]. Additional trend analyses show marginally significant linear trend differences between the C and the P and S groups [ F (1,708) = 3.57, P = 0.059] and a significant quadratic trend difference [ F (1,708) = 9.45, P = 0.002]. These results indicate that patients in the P and S conditions significantly decreased their weekly consumption of alcohol, and then sustained their decrease 12-months after the intervention, whereas the C condition continued to experience a linear downward trend.
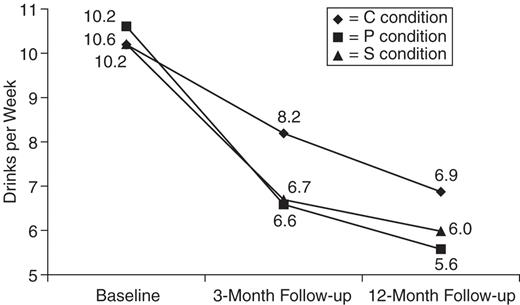
Reductions in weekly alcohol consumption over time.
Secondary outcome measures were also evaluated at the 12-month follow-up, showing no significant differences by condition except for the heavy drinking measure (frequency of ≤4 drinks per occasion). This analysis showed significant effects for time [ F (2,1402) = 158.07, P = 0.000] and a trend toward significance in the time-by-condition interaction [ F (2,1402) = 2.22, P = 0.064]. A priori contrasts between the Intervention (P and S) and C conditions over time indicate a significant [ F (1,701) = 7.58, P = 0.006] linear decrease. However, unlike the weekly alcohol consumption measure, there was no significant quadratic decrease in heavy drinking over time.
The cost estimation procedures provided monetary estimates of the average ongoing implementation costs for the S and P conditions. The Health Appraisal Survey cost, on average, $0.26 per patient questionnaire administered. Screenings cost $0.45 per patient screened. Interventions cost an average of $2.82 per patient in the S condition and $4.16 per patient in the P condition. The incremental cost of SBI per patient for both screening and intervention is estimated to be $3.53 and $4.87 in the S and P conditions, respectively. For more detail on the cost analysis, see Zarkin et al ., ( 2003 ).
DISCUSSION
The results of this multi-site evaluation show that brief advice to at-risk drinkers produces modest but statistically significant reductions in several indicators of hazardous alcohol consumption. As compared with the usual care, more patients reduce their drinking and fewer increase or remain the same. Reductions in weekly consumption occur within the first 3 months after intervention and are sustained for at least 1 year. These findings are corroborated using the more comprehensive “Drinkers' index” that includes the frequency of heavy drinking occasions. The results suggest that brief interventions of just 3–5 min are effective in primary care settings in reducing alcohol consumption and associated risks.
Although the findings of ‘Cutting Back’ are similar to those reported in random assignment studies ( Bein et al ., 1993 , Kahn et al ., 1995 ; Senft et al ., 1997 ; Wilk et al ., 1997 ; Moyer et al ., 2002 ), the overall reduction in drinking appears to be somewhat less than that reported in a meta-analysis of the literature ( Whitlock et al ., 2004 ). This could be attributable to three factors. First, the target sample included not only AUDIT positive drinkers but also those who merely exceeded the NIAAA guidelines for moderate drinking, who did not need to reduce drinking much to reach safe levels. Also, the intervention may have been delivered with less rigor and consistency than in more tightly controlled trials. Thirdly, because of the competing demands in the participating MCOs for time and resources, the approaches we tested represent relatively low intensity interventions aimed at reaching large numbers of patients. Most of our providers did not attempt to add more intensive techniques, such as follow-up telephone contacts and mailed or Internet communications that might have achieved greater initial effects and longer maintenance of reduced drinking.
Given the increasing pressures on physicians' time and the traditional barriers that deter physicians from conducting SBI, it is notable that the patients receiving an intervention in the S model clinics had outcomes similar to those in the P model clinics. This is consistent with the results of previous research ( WHO Brief Intervention Study Group 1996 ) and is important in relation to the differing costs of these two delivery models. The consistency of the outcomes across different provider models lends credibility to the conclusion that brief intervention for risky drinking is effective in real world managed care contexts. There were no differences in SF-12 outcome measures at either the 3- or 12-month follow-up evaluation dealing with quality of life. This suggests either that the instrument may not be sensitive to the benefits associated with reduction in at-risk drinking or that those benefits may not become apparent to patients within these time frames or dosage reduction levels.
As in most other brief intervention studies, the comparison (C) group participants reported significantly lower alcohol consumption at follow-up than at baseline. Possible reasons for this phenomenon include sensitization to the measurement procedures, the motivational effect of alcohol screening, exposure to advice or counseling by providers in the course of their routine medical care, the effect of their medical condition on alcohol consumption and ‘regression to the mean.’ In the present study every attempt was made to minimize the amount of assessment and to disguise the purpose of the study. We also found no evidence that providers in the comparison sites were systematically counseling their patients, although 20% of the research participants reported in their follow-up interview that their provider had spoken to them about their drinking. A final reason, noted by other investigators ( Cunningham, 2006 ; WHO Brief Intervention Study Group 1996 ), is ‘regression to the mean,’ or the tendency for extreme values to approach the individual or sample mean after repeated samples are taken. At-risk drinking by most participants is likely to be an occasional phenomenon, so that a return to less risky drinking is frequent in this population, even in the absence of an intervention. Even if brief intervention has only a marginal effect on some patients, this should not diminish the educational value of alcohol SBI, which is capable of forewarning and educating large numbers of at-risk drinkers who are likely to be exposed to the same risks again in the future.
Although not a primary focus of this study, we did conduct sub-group analyses according to gender, age, level of drinking and severity of AUDIT score. None of these analyses demonstrated significant interaction effects, suggesting that the general effect of brief intervention in routine clinical settings is not specific to demographic or drinker characteristics. This conclusion is consistent with the results of a recent comprehensive review of the literature ( Whitlock, et al ., 2004 ).
The study was methodologically complex and subject to several limitations. Recruitment was limited to five managed care organizations that served a predominantly employed population with health benefits. The follow-up rate may influence the generalizability of the findings to the extent that non-response bias could have been introduced by our survey organization's inability to contact a large number of respondents who agreed to be interviewed at the time of the initial screening. Some of these individuals were actually contacted but had to reschedule because they did not have time to be interviewed. Others could not be contacted after repeated calls. Because the proportions of completed interviews were similar across study conditions, and the three patient groups were similar in terms of their baseline drinking and demographic characteristics, there seems to have been no selection bias associated with regard to study condition. It is notable in this context that the intention-to-treat analysis that imputed missing values from the control condition replicated the significant time by condition interaction effect, and the more conservative imputation procedure approached significance. These findings strengthen the confidence that can be placed in their generalizability to primary care patients treated in managed care organizations.
It is also important to consider these limitations in the context of the quasi-experimental, multi-site research design employed in this study. First, participants were not randomized to conditions, raising the possibility that comparisons across the three conditions could be confounded by differences among the samples. We corrected statistically for known differences between samples, but this does not rule out the influence of unmeasured factors. Second, this was an effectiveness study, in that it used a naturalistic setting with a minimum of scientific requirements, rather than an efficacy study with a randomized clinical trial design. Efficacy studies are designed to have high internal validity, but may be constrained by sample selection criteria, complicated intervention techniques, highly motivated patients and practitioners, and the `demand characteristics' of a research trial. As such, they may not provide useful information about the effects of less rigorous interventions in routine clinical practice. Realism and external validity are the primary strengths of naturalistic studies like this one, which required MCOs to set up their own programs in a way that reflected standard organizational conditions. For example, to simulate real-world conditions, providers in the present study were not selected for their interest in the program; all providers were asked to participate. They received only a short, targeted training limited to this new medical protocol. Although patients gave their informed consent to be called for an evaluation of their health and lifestyle behavior, they did not knowingly self-select into a study of alcohol screening and brief intervention because the purpose of the study was defined more broadly.
Our economic analysis shows that alcohol SBI is quite low in cost when implemented in primary care. The S model is more cost effective than the P model because it is less expensive and no less effective. These cost differences are largely attributable to the labor cost of mid-level professionals being lower than physicians ( Zarkin et al ., 2003 ). Thus, the S model is the preferred choice of MCO's based on economic factors. However, the differences of cost are not so great as to preclude a preference for the P model on other grounds, such as the appropriateness of physician involvement in such important matters of patient health.
The results of this study indicate that SBI can be implemented in busy primary care practices. Moreover, when implemented it is effective in producing modest but statistically significant reductions in patient drinking. As SBI implementation is disseminated in routine medical settings, additional strategies may be required to follow up with high-risk patients who fail to decrease their drinking after one session of brief advice. Additionally, similar research is required in other medical settings (e.g. hospital admissions, emergency departments, and trauma centers) that encounter high rates of at-risk drinkers.
The authors would like to thank the following individuals for their contributions to the project: Jeffery Daniels, Pamela Higgins, Michael Fleming, Jim Finch, and Ellen M. Malaspina. Special thanks are due to the managed care organizations that collaborated with ‘Cutting Back’ and provided access to their patients. This research was supported by grant no. 029620 from the Robert Wood Johnson Foundation.
REFERENCES
Allen, J., Reinert, D. and Volk, R. (
Ashley, M. J., Ferrence, R., Room, R. et al . (
Babor, T. F., Higgins-Biddle, J., Dauser, D. et al . (
Babor, T. F., Higgins-Biddle, J., Higgins, P. et al . (
Babor, T. F. and Higgins-Biddle, J. C. (
Babor, T. F., Higgins-Biddle, J. C., Saunders, J. B., Monteiro, M. (
Bein, T., Miller, W. and Tonigan, S. (
Caetano, R. and Cunradi, C. (
Cohen, J. (
Cunningham, J. A. (
Harwood, H., Fountain, D. and Livermore, G. (
Herrell, J. M. and Straw, R. B. eds. (
Kahn, M., Wilson, L. and Becker, L. (
Moyer, A., Finney, J., Swearingen, C. et al . (
National Institute on Alcohol Abuse and Alcoholism. How To Cut Down on Your Drinking . NIH Publication No. 96–3770, NIAAA, Bethesda, MD.
Senft, R. A., Polen, M. R., Freeborn, D. K. et al . (
U.S. Department of Agriculture. (
U.S. Preventive Services Task Force. (
Ware, J. and Sherbourne, C. (
Whitlock, E. P, Polen, M. R, Green, C. A. et al . (
WHO Brief Intervention Study Group. (
Wilk, A., Jensen, N. and Havighurst, T. (
