


Abstract
Background. Plasma creatinine and creatinine clearance are of limited value for the estimation of renal function in cirrhotics. In these patients, cystatin C (Cys C) has been proposed as an alternative marker of glomerular filtration rate (GFR) and Cys C-based equations for calculation of GFR have been developed in non-cirrhotic patient cohorts.
Methods. We retrospectively analyzed correlation, bias, precision and accuracy of two Cys C-based formulae (Larsson and Hoek) for GFR estimation in comparison with two creatinine-based equations (Cockroft & Gault and MDRD). The Cys C was determined by an immunonephelometric method. The GFR was measured by means of inulin clearance in 44 consecutive patients with liver cirrhosis.
Results. On average, inulin clearance was 28.3 (95% CI: 29.2–41.3 ml/min/1.73 m 2 ). Creatinine as well as Cys C-based equations overestimated the true GFR by 105–154%. However, Cys C-based equations showed significantly lower bias and higher precision than the creatinine-based formulae. Correlation and accuracy tended to be better with the Hoek and Larsson equation than with the Cockroft & Gault or MDRD formulae. Hoek and Larsson equations showed a similar diagnostic performance in all statistical procedures.
Conclusion. Our data suggest a significant improvement of GFR estimation in liver cirrhotics by means of the Cys C-based Hoek and Larsson formulae. However, all estimates remain a crude approximation of true GFR and thus cannot replace gold standard methods.
Introduction
In patients with liver cirrhosis, renal impairment is associated with poor prognosis [ 1 ]. Creatinine-based calculation of glomerular filtration rate (GFR) is still the most commonly used method for estimation of GFR. However, creatinine and creatinine-based methods have been shown to be of limited value as predictors of GFR in cirrhotics [ 2 , 3 ]. Thus, creatinine clearance has been found to overestimate the true GFR by up to 200% [ 4 ]. We and others demonstrated that cystatin C (Cys C), a non-glycosylated 13 kDa protein of the cystatin superfamily, is more precise than creatinine for detection of reduced GFR in cirrhotic patients [ 5–7 ].
Recently, several formulae to calculate GFR using Cys C serum levels were suggested for application in patients with various renal diseases [ 8 , 9 ]. These equations were developed on the basis of an immunonephelometric Cys C determination and showed a good diagnostic performance. The aim of the current study was to evaluate the diagnostic accuracy of two Cys C-based equations (referred to as the Hoek and Larsson equation, respectively) in comparison with the creatinine-based Cockcroft & Gault (C&G) and modification of diet in renal disease (MDRD) equations. For this purpose we retrospectively analyzed a cohort of liver cirrhotics in which we had previously correlated concentrations of creatinine and Cys C to steady state inulin clearance [ 5 ].
Subjects and methods
Patients
A total of 44 patients (14 females, 30 males) with a mean age of 52.9 (95% CI 49.1–56.8) years underwent GFR measurements. According to the Child-Pugh classification, six patients were in group Child A (mean Child score: 5.5 points), 20 patients in group Child B (mean score: 8 points), and 18 patients in group Child C (mean score: 11.1 points). The causes of liver disease were alcoholism ( n = 31), viral hepatitis ( n = 10) and other liver disease ( n = 3). Ascites was present in 36 of 44 patients. Furthermore, encephalopathy was found in 11 patients. Detailed clinical and demographic characteristics of the patient cohort are given in Table 1 . All patients presented evidence of portal hypertension as indicated by ascites and/or oesophageal varices. Informed consent was obtained from all patients enrolled in the study.
Patients characteristics
| Mean±SD | Median (Range) | |
|---|---|---|
| Age (years) | 52.9±12.5 | 55.5 (20–71) |
| Body weight (kg) | 71.5±13.1 | 70.8 (48.6–102) |
| Height (cm) | 173±8.0 | 172 (160–194) |
| Body mass index (kg/m 2 ) | 23.8±3.8 | 24 (15.8–31.8) |
| Bilirubin (mg/dl) | 3.42±5.14 | 1.70 (0.4–24.3) |
| Prothrombin time (%) | 73.7±20.7 | 70 (38–130) |
| Albumin (g/dl) | 3.02±0.66 | 3.1 (1.4–4.7) |
| Child score | 9.07±2.04 | 9 (5–14) |
| Serum creatinine (mg/dl) | 1.07±0.48 | 0.99 (0.5–3.41) |
| Serum cystatin C (mg/l) | 1.21±0.41 | 1.15 (0.67–3.14) |
To convert serum creatinine in mg/dl to µmol/l, multiply by 88.4, bilirubin in mg/dl to µmol/l, multiply by 17.1.
Inulin clearance
After an overnight fasting period, GFR was determined in the supine position by a steady state inulin clearance technique. Studies on urine and blood samples were conducted as described elsewhere [ 10 ]. All results were adjusted to a standard body surface of 1.73 m 2 .
GFR, creatinine and cystatin C measurement
Serum creatinine and Cys C were measured from the same blood samples. Cystatin C in serum was analysed by a fully automated latex-enhanced immunonephelometric method covering the range of 0.3–8 mg/l (N Latex Cystatin C Nephelometer II, Dade-Behring). The sensitivity of the assay was 0.05 mg/l. The intraassay coefficient of variation (CV) for Cys C was 1.9% (mean 0.6 mg/l; n = 20), the interassay CV was 3.6% (mean 0.6 mg/l; n = 20).
Serum creatinine was determined on the Dimension™ clinical chemistry system (Dade Behring, Marburg, Germany) with a commercially available assay based on the modified Jaffé method reported by Larsen [ 11 ]. This method has been reported to be less vulnerable than conventional methods to interferences from non-creatinine, Jaffé-positive compounds. Furthermore, since bilirubin is oxidized by potassium ferricyanide, the method is insensitive to bilirubin concentrations below 60 mg/dl [ 17 ]. The sensitivity of the creatinine method was 4 µmol/l. This sensitivity is defined as the concentration of two standard deviations above the CHEM I calibrator (Dade Behring) at 0 µmol/l creatinine ( n = 20). The intraassay coefficient of variation was 0.01 (mean: 61 µmol/l, n = 20), while the interassay coefficient of variation was 0.025 (mean: 79.4 µmol/l, n = 20).
Equations
Statistics
All results are given as mean and 95% confidence interval (95% CI) unless indicated otherwise.
Pearson's correlation was used to correlate inulin clearance and estimates of GFR. Bias was calculated by the mean difference between the true GFR and the calculated GFR. Comparisons of the differences between measured and estimated GFR were performed by t- tests. The precision of the estimates is expressed in terms of the root mean square error (standard deviation of the mean difference between real GFR and estimated GFR) [ 14 ].
The Medcalc® software (Mariakerke, Belgium) was used for Bland and Altman analysis of the GFR estimates as compared to the true GFR. In this graphical analysis method, accuracy and precision are determined by relating the difference between the estimated and measured GFR to the average of the measured and estimated GFR in each patient. The limits of agreement are given by the mean±1.96 SD, containing 95% of the values [ 15 ]. P values below 0.05 were considered significant.
Results
Results for the different methods of GFR determination are depicted in Figure 1 . Mean inulin clearance was 35.3 (95% CI 29.2–41.3) ml/min/1.73 m 2 . The calculated values were 68.6 (95% CI 62.2–74.9), 69.2 (95% CI 61.6–76.8), 87.0 (95% CI 75.7–98.3) and 83.6 (95% CI 73.0–94.2) ml/min/1.73 m 2 for Hoek, Larsson, C&G and MDRD, respectively.
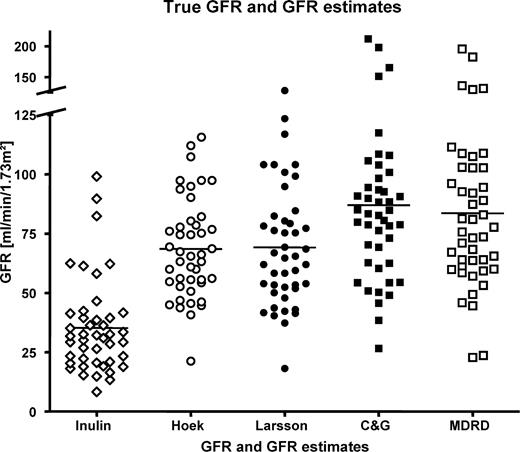
Each symbol reflects a measured or calculated GFR of an individual patient. Mean inulin clearance was 35.3 (95% CI: 29.2–41.3) ml/min/1.73 m 2 . The calculated values were 68.6 (95% CI: 62.2–74.9), 69.2 (95% CI: 61.6–76.8), 87.0 (95% CI: 75.7–98.3), and 83.6 (95% CI: 73.0–94.2) ml/min/1.73 m 2 for Hoek, Larsson, CG and MDRD, respectively.
All calculated GFR estimates overestimated inulin clearance significantly ( P <0.0001).
Bias
A considerable overestimation of GFR was noted for both creatinine-based methods: C&G: 51.7 (95% CI 42.0–61.5) ml/min/1.73m 2 ; MDRD: 48.3 (95% CI 39.3–57.4) ml/min/1.73 m 2 . The mean difference between both creatinine-based formulae was not significant ( P = 0.2). In contrast, the Hoek formula showed a significantly lower bias (33.3, 95% CI 27.8–38.3 ml/min/1.73 m 2 ) when compared to C&G ( P = 0.0002) and MDRD ( P = 0.0004). Similarly, the bias of the Larsson formula (33.9, 95% CI 27.7–40.1 ml/min/1.73 m 2 ) was significantly smaller than that of C&G ( P = 0.0003) and MDRD ( P = 0.0007).
Correlation
All tests describing GFR correlated well with inulin clearance and with each other ( P <0.01). However, the correlation coefficients were low and found to be 0.51 for C&G, 0.52 for MDRD and 0.61 for the Larsson and Hoek formula, respectively. The differences between the correlation coefficients did not reach significance.
Precision
The comparison between the different formulae showed marked discrepancies ( Table 2 ). The precision of the Hoek equation was significantly better than the precision of C&G ( P = 0.0001; F statistics: 3.11) and MDRD ( P = 0.001; F statistics: 2.70), respectively. Also, the precision of the Larsson formula was superior to both C&G ( P = 0.002; F statistics: 2.46) and MDRD ( P = 0.007; F statistics: 2.13), respectively. The precision of the MDRD equation did not differ significantly from C&G, nor the Hoek and Larsson formula from each other.
Accuracy
The method described by Bland and Altman determines accuracy combining bias and precision. These plots are used to demonstrate the agreement between calculated and measured GFR values by determining the span between +1.96 SD and −1.96 SD of the mean difference.
The absolute values are 71.2 and 80 ml/min/1.73 m 2 for the Hoek and the Larsson equation, respectively. The creatinine-based formulae showed a considerably wider span (MDRD and C&G: 116.9 and 125.4 ml/min/1.73 m 2 ). In other words, 95% of the values of the C&G formula can be up to 147% higher or 26% lower than the values of the inulin clearance. The corresponding values for the MDRD, the Hoek and the Larsson equation were 145 and 22%, 136 and 2.6%, 136 and 1.3%, respectively. A second method calculates the percentage of GFR estimates that fall within 10, 30, and 50% above or below the measured GFR according to the National Kidney Foundation guidelines [ 16 ]. The data ( Table 2 ) clearly indicate that, despite superiority of the Cys C-based methods, all GFR estimates show only a poor identity with the gold standard GFR. Even the best performing GFR equation showed a proportion of less than 21% within the 50% boundary of the true GFR. Despite the fact that this was nearly three times higher than the proportion for the MDRD equation within the 50% of true GFR, the difference between the methods did not reach significance due to the size of the cohort.
Correlation, difference, accuracy and precision of GFR estimates
| R2 | P value | Median difference (ml/min/1.73 m 2 ) | Median% difference (ml/min/1.73 m 2 ) | RMSE (ml/min/1.73 m 2 ) | Accuracy% within | |||||
|---|---|---|---|---|---|---|---|---|---|---|
| 10% | 30% | 50% | ||||||||
| Cockcroft–Gault | 0.258 | 0.0004 | 46.5 | 153.9 | 31.64 | 0 | 4.5 | 9.1 | ||
| MDRD | 0.267 | 0.0003 | 44.0 | 146.0 | 29.48 | 2.3 | 6.8 | 6.8 | ||
| Larsson | 0.366 | 0.00001 | 32.9 | 105.1 | 20.18 | 0 | 13.6 | 20.5 | ||
| Hoek | 0.367 | 0.00001 | 32.9 | 111.4 | 17.94 | 2.3 | 11.4 | 15.9 | ||
R2 = Square of correlation coefficient as a value of variability of predicted GFR account for variability of measured GFR; RMSE = root mean square error.
P value for correlation is not zero.
To notify, an accuracy of 21% within 50% of true GFR means that four out of five GFR estimations of the best performing Cys C based equation differed more than 50% from true GFR. From this point of view the MDRD equation needs around 15 calculations to meet the true GFR value one time within a 50% deviation.
Discussion
Although creatinine-based GFR estimates are known to overestimate true GFR to a high degree in patients with liver disease, to date no simple alternative method has become available to appropriately characterize renal function in these patients. Equations estimating GFR on the basis of serum parameters would have the advantage of being independent of urine flow collection errors. We therefore tested the hypothesis that a Cys C-derived formula shows a better agreement with true GFR than creatinine-based estimates, and found a significant improvement of GFR estimation in liver cirrhotics by means of the Cys C-based Hoek and Larsson formulae. However, all estimates overestimate true GFR considerably and cannot replace invasive gold standard methods.
Throughout the literature, creatinine-based GFR estimates have been reported to overestimate GFR in patients with liver cirrhosis [ 2 , 3 , 18 , 19 ]. Various factors contribute to reduce the creatinine serum levels to lower than expected from a known GFR level. Besides malnutrition and reduced muscle mass, it has been shown that creatinine synthesis itself may be reduced by 40–50% in liver cirrhosis [ 3 , 4 ]. Tubular creatinine secretion additionally reduces serum creatinine concentration [ 2 ].
According to our results, a slight but insignificant improvement of GFR estimation in comparison with C&G was seen for the MDRD equation. The MDRD equation has recently been evaluated in a large cohort of patients awaiting liver transplantation [ 20 ].
In a sub-analysis of patients with similar GFR results, as in our patients, an overestimation of GFR by the C&G and MDRD formulae was observed (46.1 and 44.5 vs I 125 -iothalamate clearance 22.6 ml/min/1.73 m 2 ). Taken together, we may conclude that in cirrhotic patients with considerably reduced kidney function, the MDRD formula fails to characterize GFR more precisely than the C&G formula.
The equations from Hoek and Larsson have been mainly derived from adult cohorts with different renal diseases showing a wide range of (true) GFR (12–157 ml/min and 10–115 ml/min, respectively). Neither equation required additional parameters for calculation of GFR. Despite divergent patient characteristics and the simplicity of both equations, the differences in diagnostic performance between both Cys C-based estimates in our cohort were small. Nevertheless, the Larsson formula tended to be more accurate, whereas Hoek-derived estimates were more precise, albeit not significantly.
Irrespective of better bias, correlation, accuracy and precision than creatinine-based methods, a considerable lack of agreement with inulin clearance was seen for both Cys C-based formulae. In terms of accuracy, the K/DOQI recommended the use of the MDRD formula in patients with chronic kidney disease due to an accuracy of 92%, within 30% and 98% within 50% of true GFR [ 16 ]. This is not comparable with our results and emphasizes the difficulties of GFR estimation in cirrhotics. Nevertheless, the rather disappointing results are mainly related to the enormous overestimation of true GFR. This does not necessarily imply that all Cys C-based formulae will result in such an overestimation, since the tested equations were derived from non-cirrhotic cohorts. Further studies designing more appropriate equations for GFR estimation in cirrhotic patients should develop correction factors to improve diagnostic performance.
Some drawbacks of our study must also be taken into account when interpreting data: first, the data were derived from a retrospective analysis; second, the study comprised only a small number of patients: and third, although creatinine has been used for decades, no standardization of creatinine measurement could be established. Thus, considerable differences in diagnostic accuracy may be found between different assays [ 21 ]. Since we did not use the same system as in the MDRD study (Beckman CX3 vs Dimension system) a methodical bias cannot be ruled out. Finally, it should be mentioned that all tested equations in this analysis were derived from studies that used the Dade immunonephelometric assay for Cys C determination. Other available turbidimetric immunoassays have not been included in our analysis.
Additionally, there is an ongoing controversy regarding the biological variation of Cys C. It has been suggested that Cys C serum concentrations may exhibit a high within-subject variation [ 22 , 23 ]. In contrast, other investigators found a higher biological variation for creatinine than for Cys C [ 24 , 25 ]. A considerable biological variation of Cys C could further bias the results of our study.
In summary, our results demonstrate that the two recently proposed Cys C-based GFR formulae may improve the calculation of GFR in patients with moderate and advanced liver disease. However, none of the tested formulae reaches a satisfying level of agreement with the inulin clearance and thus none can replace the gold standard method.
The authors are indebted to Doris Ehlert for the technical assistance. They also thank Martina Schmidt and Anke Carstensen for their excellent technical assistance in performing the creatinine and cystatin C assays.
Conflict of interest statement. None declared.
References
Llach J, Gines P, Arroyo V et al . Prognostic value of arterial pressure, endogenous vasoactive systems, and renal function in cirrhotic patients admitted to the hospital for the treatment of ascites.
Caregaro L, Menon F, Angeli P et al . Limitations of serum creatinine level and creatinine clearance as filtration markers in cirrhosis.
Papadakis MA, Arieff AI. Unpredictability of clinical evaluation of renal function in cirrhosis. Prospective study.
Sherman DS, Fish DN, Teitelbaum I. Assessing renal function in cirrhotic patients: problems and pitfalls.
Woitas RP, Stoffel-Wagner B, Flommersfeld S et al . Correlation of serum concentrations of cystatin C and creatinine to inulin clearance in liver cirrhosis.
Gerbes AL, Gulberg V, Bilzer M, Vogeser M. Evaluation of serum cystatin C concentration as a marker of renal function in patients with cirrhosis of the liver.
Orlando R, Mussap M, Plebani M et al . Diagnostic value of plasma cystatin C as a glomerular filtration marker in decompensated liver cirrhosis.
Hoek FJ, Kemperman FA, Krediet RT. A comparison between cystatin C, plasma creatinine and the Cockcroft and Gault formula for the estimation of glomerular filtration rate.
Larsson A, Malm J, Grubb A, Hansson LO. Calculation of glomerular filtration rate expressed in mL/min from plasma cystatin C values in mg/L.
Woitas RP, Heller J, Stoffel-Wagner B, Spengler U, Sauerbruch T. Renal functional reserve and nitric oxide in patients with compensated liver cirrhosis.
Cockcroft DW, Gault MH. Prediction of creatinine clearance from serum creatinine.
Levey AS, Greene T, Kusek JW, Beck GJ and MDRD Study Group. A simplified equation to predict glomerular filtration rate from serum creatinine.
Walser M. Assessing renal function from creatinine measurements in adults with chronic renal failure.
Bland JM, Altman DG. Comparing methods of measurement: why plotting difference against standard method is misleading.
National Kidney Foundation. K/DOQI clinical practice guidelines for chronic kidney disease: evaluation, classification, and stratification.
Knapp ML, Mayne PD. Development of an automated kinetic Jaffe method designed to minimise bilirubin interference in plasma creatinine assays.
Roy L, Legault L, Pomier-Layrargues G. Glomerular filtration rate measurement in cirrhotic patients with renal failure.
Takabatake T, Ohta H, Ishida Y, Hara H, Ushiogi Y, Hattori N. Low serum creatinine levels in severe hepatic disease.
Gonwa TA, Jennings L, Mai ML, Stark PC, Levey AS, Klintmalm GB. Estimation of glomerular filtration rates before and after orthotopic liver transplantation: evaluation of current equations.
Wuyts B, Bernard D, Van den Noortgate N et al . Reevaluation of formulas for predicting creatinine clearance in adults and children, using compensated creatinine methods.
Keevil BG, Kilpatrick ES, Nichols SP, Maylor PW. Biological variation of cystatin C: implications for the assessment of glomerular filtration rate.
Cimerman N, Brguljan PM, Krasovec M, Suskovic S, Kos J. Twenty-four hour variations of cystatin C and total cysteine proteinase inhibitory activity in sera from healthy subjects.
Tan GD, Lewis AV, James TJ, Altmann P, Taylor RP, Levy JC. Clinical usefulness of cystatin C for the estimation of glomerular filtration rate in type 1 diabetes: reproducibility and accuracy compared with standard measures and iohexol clearance.
Author notes
1Department of Internal Medicine I, University of Bonn, Germany and 2Department of Clinical Biochemistry, University of Bonn, Germany


Comments