


Abstract
Exercise increases pressure pain thresholds (PPTs) in exercising and nonexercising muscles, known as exercise-induced hypoalgesia (EIH). No studies have investigated the test-retest reliability of change in PPTs after aerobic exercise. Primary objectives were to compare the effect on PPTs after an incremental bicycling exercise compared with quiet rest and to investigate the relative and absolute test-retest reliability of the test stimulus (PPT) and the absolute and relative EIH response in exercising and nonexercising muscles.
Laboratory.
In two sessions, PPTs in the quadriceps and trapezius muscles were assessed before and after 15 minutes of quiet rest and 15 minutes of bicycling in 34 healthy subjects. Habitual physical activity was assessed by the International Physical Activity Questionnaire (IPAQ).
Bicycling increased PPTs in exercising and nonexercising muscles in both sessions (P < 0.05). The magnitude of the EIH response in the exercising muscle was, however, larger in the second compared with the first session (P < 0.015). PPTs showed excellent (intraclass correlation [ICC] ≥ 0.84) within-session and between-session test-retest reliability. The EIH response in exercising and nonexercising muscles demonstrated fair (ICC = 0.45) between-session relative test-retest reliability, but agreement in EIH responders between sessions was not significant (quadriceps: κ = 0.24, P = 0.15; trapezius: κ = 0.01, P = 0.97). Positive correlations between the IPAQ score and PPTs were found (quadriceps: r = 0.44, P = 0.009; trapezius: r = 0.31, P = 0.07) before exercise. No significant association was found between IPAQ and EIH.
Incremental bicycling exercise increased PPTs with fair relative and absolute reliability of the EIH response. These data might have an impact on future studies investigating EIH and for clinicians designing exercise programs for pain relief.
Introduction
The effect of exercise on pain perception in humans is of growing interest [1]. Several experimental studies have demonstrated a robust decrease in pain sensitivity in exercising and nonexercising muscles during and following different exercise protocols in healthy subjects [2]. This phenomenon has been referred to as exercise-induced hypoalgesia (EIH) [3]. Several protocols assessing the effect of exercise have been described. Aerobic exercise conditions (e.g., bicycling) produce a hypoalgesic response when performed at moderate to high intensities [4], whereas isometric exercise conditions (i.e., a muscle contraction without joint movement) produce EIH at both low and high intensities [5]. Experimentally, EIH can be assessed using thermal, electrical, or pressure stimuli as test stimulus before and during or after the exercise condition. The EIH response is typically calculated as the absolute or relative difference in the test stimulus during or after the exercise condition compared with the test stimulus before the exercise condition. To date, the mechanisms underlying EIH are not clear, but recent studies have indicated that mechanisms relevant to descending pain control assessed by conditioned pain modulation (CPM) may contribute to the EIH response due to the painful experience during exercise [6,7].
Although EIH has been investigated extensively in healthy volunteers, at present, there is no consensus as to whether a certain EIH protocol is preferable over others. To explore clinical applicability of EIH after an exercise condition, an analysis of the test-retest reliability in healthy subjects is an essential prerequisite. No studies have analyzed the test-retest reliability of the commonly used method with pressure pain thresholds (PPTs) as the test stimulus and bicycling as the exercise condition [4], although this protocol seems to provide clinically relevant information on the capacity of endogenous pain modulation in patients with chronic pain [8] and a predictor of treatment response [9]. As exercise is commonly used as part of treatment programs for chronic pain, further knowledge on the between-session reliability is important.
In addition to acute exercise, habitual physical activity has been linked to alterations in pain perception, and athletes have decreased pain sensitivity compared with normally active controls [10]. Few studies in healthy subjects have examined the relationship between habitual physical activity and EIH. Interestingly, impaired EIH is often found in chronic pain patients [2], in whom physical activity is also often reduced [11].
This study aimed to 1) compare the effect on PPTs after an incremental bicycling exercise compared with quiet rest in healthy subjects, 2) investigate the test-retest reliability of the test stimulus (PPT) and the EIH response in exercising and nonexercising muscles, and 3) investigate the influence of habitual physical activity on PPTs and EIH. It was hypothesised that 1) the bicycling exercise would produce an increase in PPTs in exercising and nonexercising muscles compared with quiet rest, 2) PPTs and EIH would demonstrate acceptable test-retest reliability, and 3) greater habitual physical activity would be associated with higher PPTs and EIH.
Methods
Subjects
Thirty-four healthy subjects (mean age = 25.8 ± 3.4 years, range = 21–39 years, average body mass index [BMI] = 25.1 ± 3.8 kg/m2, range = 18.4–34.7 kg/m2, five left-handed, 13 females) were included in this study, which was conducted in accordance with the Declaration of Helsinki, approved by the local ethical committee (S-20160189), and all subjects provided written informed consent. The subjects were recruited by advertisement at the local university college and through social media. None of the included subjects suffered from neurological, psychological, or cardiovascular diseases, had any pain, or used any pain medication during the weeks prior to participation. All subjects were asked to refrain from physical exercise, coffee, and nicotine on the days of participation. An a priori power analysis determined that with a power of 0.80, an alpha of ≤0.05, and a paired t test, 34 participants were required to detect a difference in EIH with a moderate effect size (d = 0.50) between session 1 and session 2.
Procedure
Subjects participated in two identical sessions at the same time of the day, separated by one week (Figure 1). This time frame was chosen to minimize potential carry-over effects from the pain sensitivity assessments and exertion after physical exercise between sessions, as well as avoiding extensive changes in physical fitness levels within subjects. In the beginning of session 1, all subjects completed the short-version International Physical Activity Questionnaire (IPAQ) and were verbally introduced to the procedures and familiarized with the assessment of PPT on the nondominant thigh, which was not used for further assessments. In each session, PPTs were initially recorded from the dominant thigh and the nondominant shoulder. In addition, all subjects performed a 15-minute quiet rest condition and 15 minutes of bicycling exercise in each session. PPTs were assessed before and immediately after the quiet rest and exercise.
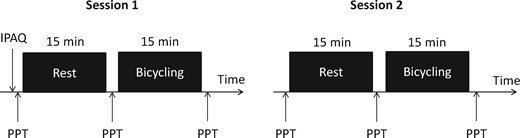
Illustration of the experimental procedure performed on both testing days. Pressure pain thresholds were assessed on two assessment sites (quadriceps and trapezius) before and immediately after rest and exercise. IPAQ = International Physical Activity Questionnaire; PPT = pressure pain threshold.
Pressure Pain Threshold Assessment
A handheld pressure algometer (Somedic Sales AB, Horby, Sweden) with a stimulation area of 1 cm2 was used to assess PPTs at two assessment sites. Site 1 was located in the middle of the dominant quadriceps muscle (exercising muscle), 15 cm proximal to the base of patella. Site 2 was located in the nondominant upper trapezius muscle (nonexercising muscle), 10 cm from the acromion in direct line with the neck. The pressure from the algometer was increased at approximately 30 kPa/s, and the first time the pressure was perceived as minimal pain, the subject pressed a button and the pressure intensity defined the PPT. Two assessments were completed for each site, and the average was used for analysis.
Quiet Rest and Bicycling Conditions
In the quiet rest condition, subjects were instructed to relax in a seated position in a comfortable armchair for 15 minutes in a 21ºC temperate and undisturbed room.
Subjects performed 15-minute incremental bicycling exercise conditions. The seat post of the stationary cycle (Ergomedic 928E, Monark Exercise AB, Vansbro, Sweden) was adjusted so that the subject had a five-degree bend at the knee during the bottom phase of the pedal stroke. A heart rate monitor (Monark Heart Rate Monitor) was strapped around the subject’s chest. Just before the exercise condition, the subject was instructed to rate pain intensity in the legs on a 0–10 numerical rating scale (NRS), with 0 defined as “no pain” and 10 “as worst imaginable pain,” and to rate perceived exertion (RPE) on Borg’s 6–20 scale, with 6 defined as “no exertion at all” and 20 as “maximal exertion.” Heart rate was also assessed. The start intensity was set to 20 Watts, and resistance was then increased by 20 Watts per minute, until an RPE of 16 was achieved, whereafter the subject continued bicycling at that intensity for the remaining time. Subjects were instructed to maintain a pedal rate as close to 70 rounds per min (RPM) as possible throughout the 15 minutes of bicycling exercise. Heart rate was monitored constantly, pain intensity in the legs and RPE were assessed after 2, 3, 6, 9, 12 and 15 minutes, and maximum intensity in Watts was recorded. The exercise condition in session 2 was identical in terms of increase in Watts despite potential differences in heart rate, pain intensity, or RPE. This was chosen to ensure that the objective intensity of the exercise sessions did not differ between the two sessions.
International Physical Activity Questionnaire
The short-version International Physical Activity Questionnaire was used to assess frequency and duration of vigorous, moderate, and light physical activity undertaken during the last seven days. In addition, time spent with sedentary activity was also assessed with the questionnaire. For each of the domains, the metabolic equivalent (MET) per minutes was calculated, and the domains were summed for a total MET score [12].
Statistics
Results are presented as mean and standard deviation in the text and as mean and standard error of the mean (SEM) in figures. The distribution of PPTs, peak NRS scores, and heart rate did not deviate significantly from normality (Shapiro-Wilks test, P > 0.15). The effect of sessions and gender on baseline (prerest) PPTs was analyzed, with a mixed-model analysis of variance (ANOVA) with session (session 1 and session 2) and assessment site (quadriceps and trapezius) as the within-subject factor and gender as the between-subject factor. The effects of exercise and rest on PPTs were analyzed with mixed-model ANOVAs with session (session 1 and session 2), condition (exercise and rest), assessment site (quadriceps and trapezius), and time (before and after) as within-subject factors and gender as the between-subject factor. Furthermore, absolute (PPT after exercise minus PPT before exercise) and relative (percentage increase of the PPT after vs the PPT before) differences in PPTs after exercise were calculated (defined as EIH). Potential differences in absolute and relative EIH between women and men were investigated with independent t tests. Changes in heart rate, RPE, and NRS scores during exercise were analyzed with ANOVAs with session (session 1 and session 2) and time (0, 2, 3, 6, 9, 12, and 15 minutes) as within-subject factors and gender as the between-subject factor. P values of less than 0.05 were considered significant. In case of significant factors or interactions in ANOVAs, Bonferroni-corrected post hoc tests were used to correct for multiple comparisons. Spearman correlational analyses were performed to determine possible associations between the total IPAQ score, baseline PPTs, and absolute and relative EIH.
For assessment of test-retest reliability of PPTs and the EIH response, the systematic errors between sets of PPT assessments (within-session: PPTs before and after rest for each assessment site separately; between-session: baseline PPTs for the first and second session for each assessment site separately) and absolute and relative EIH responses between sessions were determined using repeated-measures ANOVA. Pearsons r and intraclass correlations (ICCs) based on a single rating, consistency, two-way mixed-effect model (ICC3, 1) were used to assess the reliability of the assessment of baseline PPTs and EIH responses to differentiate between subjects based on how their PPTs and EIH values ranked compared with the other subjects. An ICC above 0.75 was taken as excellent reliability, 0.40–0.75 was fair to good reliability, and less than 0.40 defined poor reliability [13]. In addition, the within-subject test-retest reliability based on responders and nonresponders was investigated. To classify subjects as EIH responders or nonresponders in session 1 and session 2, respectively, the standard errors of measurement of repeated PPT assessments (before and after rest) in each session were estimated. SEM was calculated as the square root of the mean square error term in the repeated-measures ANOVA output [14]. Subjects who had an increase in PPTs after exercise that was larger than the SEM were classified as EIH responders, and subjects who did not have an increase in PPT that was larger than the SEM was classified as EIH nonresponders. The frequency of EIH responders and nonresponders was investigated, and agreement between sessions was assessed with Cohen’s kappa coefficient. Data were analyzed using SPSS Statistics, version 24 (IBM, Armonk, NY, USA).
Results
Pain Thresholds at Baseline
PPTs had a tendency to being increased in men (quadriceps: 640 ± 141 kPa, trapezius: 349 ± 94 kPa) compared with women (quadriceps: 510 ± 220 kPa, trapezius: 299 ± 132 kPa; F(1, 32) = 3.60, P = 0.067). A main effect of assessment site was found for baseline PPTs (F(1, 32) = 156.94, P < 0.001), with a post hoc test showing that the PPT at the quadriceps site was significantly higher compared with PPTs at the trapezius site in both men and women (P < 0.001). No significant differences in baseline PPTs were found between sessions (F(1, 32) = 2.52, P = 0.12).
Comparison of Exercise and Quiet Rest
The ANOVA of the PPTs demonstrated a significant interaction between conditions, assessment sites, and time (F(1, 33) = 10.75, P = 0.002) (Figure 2), with a post hoc test showing increased PPTs after bicycling in session 1 and session 2 compared with before bicycling (quadriceps mean increase = 18.5 ± 17.2%; trapezius mean increase = 12.7 ± 27.3%, P < 0.03). In both sessions, the increase in PPT in the quadriceps was larger compared with the PPT increase in the trapezius (P < 0.001). No significant differences in PPTs after rest were found (P > 0.45).
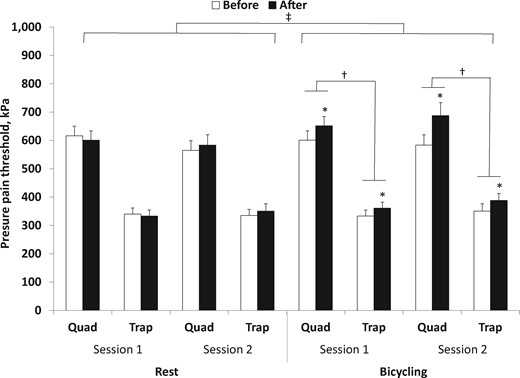
Mean (+SEM) pressure pain threshold (PPT) recorded at two assessment sites (quadriceps and trapezius) before and immediately after 15 minutes of quiet rest and 15 minutes of bicycling: significantly different compared with baseline (*P < 0.05), significantly different compared with other assessment site (†P < 0.05), and significantly different compared with rest condition (‡P < 0.05). Quad = m. quadriceps dominant side; Trap = upper trapezius muscle nondominant side.
No significant gender differences in absolute or relative change in PPTs (t(32) < 1.54, P > 0.13) after exercise were found.
Comparison of Exercise Parameters Between Sessions
All subjects completed the exercise conditions during session 1 and session 2. Obviously the intensity of bicycling did not differ significantly between the two sessions as identical protocols were used; however, a significant effect of gender was found (F(1, 32) = 20.27, P < 0.001) (Figure 3A), with men reaching a higher exercise intensity than women. Exercise intensity increased significantly over time (F(15, 480) = 347.24, P < 0.001), with the post hoc test showing higher intensity at each time point compared with the previous time point (P < 0.001), except between the last five assessments (11 to 15 minutes).
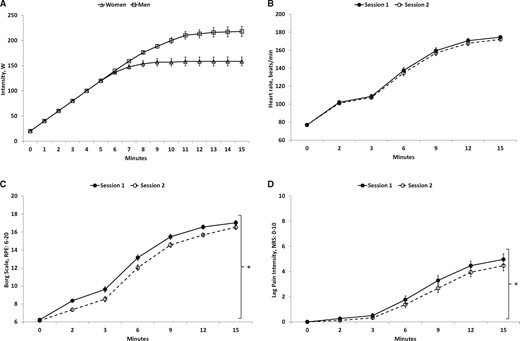
Mean (+/− SEM, N = 34) exercise intensity over time performed by women (triangle) and men (square) (A), heart rate (B), rating of perceived exertion (C), and numerical rating scale scores of pain intensity (D) assessed during exercise in session 1 and session 2: significantly different compared with other session (*P < 0.05). NRS = numerical rating scale; RPE = rating of perceived exertion.
The heart rate during exercise increased significantly over time (F(6, 192) = 787.37, P < 0.001) (Figure 3B), with the post hoc test showing a significantly higher heart rate at each time point compared with the previous time point (P < 0.001), except between the last two assessments (12 and 15 minutes). Moreover, the heart rate was higher during exercise in women compared with men (F(1, 32) = 7.70, P = 0.009). No significant difference in heart rate between sessions was found (F(1, 32) = 3.09, P = 0.089).
Ratings of perceived exertion were increased over time (F(6, 192) = 633.88, P < 0.001) (Figure 3C), with the post hoc test showing higher RPE at each time point compared with the previous time point (P < 0.001), except between the last two assessments (12 and 15 minutes). Moreover, a significant difference was found between session 1 and session 2 (F(1, 32) = 26.45, P < 0.001), with higher RPE during exercise in session 1 compared with session 2 (P < 0.001). In addition, RPE was significantly higher during exercise in women compared with men (F(1, 32) = 4.38, P = 0.044).
The NRS ratings of pain intensity in the legs reported during bicycling increased over time (F(6, 192) = 85.38, P < 0.001) (Figure 3D), with the post hoc test showing higher pain scores at each time point compared with the previous time point (P < 0.001), except between the first two assessments (0 and 2 minutes) and the last two assessments (12 and 15 minutes). Moreover, a difference was found in reported pain scores between session 1 and session 2 (F(1, 32) = 9.03, P = 0.005), with higher pain intensity during exercise in session 1 compared with session 2. No significant difference in pain intensity between men and women was found (F(1, 32) = 0.21, P = 0.65).
Influence of Habitual Physical Activity on Baseline PPTs and EIH
A positive correlation was found between the total IPAQ score and baseline PPT in the quadriceps muscle (r = 0.44, P = 0.009) and almost between the total IPAQ score and baseline PPT in the trapezius (r = 0.31, P = 0.07). No significant associations were found between the total IPAQ score and absolute or relative change in PPTs after exercise (P > 0.20).
Test-Retest Reliability of PPTs and EIH
Within-session test-retest reliability of PPT in the quadriceps (session 1: F(1, 33) = 0.83, P = 0.37; session 2: F(1, 33) = 1.22, P = 0.28) and trapezius (session 1: F(1, 33) = 0.52, P = 0.48; session 2: F(1, 33) = 2.32, P = 0.14) muscles, respectively, showed no systematic errors between assessments; assessments were strongly correlated (r ≥ 0.87), and ICCs were excellent, with values ≥0.93 for both sites (Table 1).
Within-session test-retest reliability for pressure pain threshold in the dominant quadriceps and nondominant upper trapezius muscles
| Variable | Before Rest, Mean ± SD (95% CI), kPa | After Rest, Mean ± SD (95% CI), kPa | Absolute Within-Session Difference, Mean ± SD (95% CI), kPa | Relative Within-Session Difference, Mean ± SD (95% CI), % | P Value | Effect Size | Pearson r | ICC3, 1 (95% CI) | Standard Error of Measurement, kPa |
|---|---|---|---|---|---|---|---|---|---|
| Quad session 1 | 616 ± 198 (547–685) | 601 ± 190 (534–667) | 15 ± 99 (−19 to 50) | 1.6 ± 15.9 (−3.9 to 7.1) | 0.368 | 0.025 | 0.87 | 0.93 (0.86–0.97) | 70 |
| P < 0.001 | |||||||||
| Quad session 2 | 565 ± 198 (496–634) | 583 ± 213 (509–658) | −18 ± 98 (−52 to 16) | −4.9 ± 18.0 (−11.1 to 1.4) | 0.277 | 0.036 | 0.89 | 0.94 (0.88–0.97) | 70 |
| P < 0.001 | |||||||||
| Trap session 1 | 340 ± 127 (295–384) | 333 ± 124 (289–376) | 7 ± 54 (−12 to 26) | 0.7 ± 15.7 (−4.7 to 6.2) | 0.477 | 0.015 | 0.91 | 0.95 (0.90–0.98) | 38 |
| P < 0.001 | |||||||||
| Trap session 2 | 335 ± 125 (291–378) | 350 ± 154 (297–404) | −15 ± 59 (−36 to 5) | −3.4 ± 15.4 (−8.7 to 2.0) | 0.137 | 0.066 | 0.93 | 0.95 (0.91–0.98) | 42 |
| P < 0.001 |
CI = confidence interval.
Between-session test-retest reliability of PPT in the quadriceps (F(1, 33) = 4.12, P = 0.051) and trapezius muscles (F(1, 33) = 0.12, P = 0.73), respectively, showed no systematic errors (F(1, 33) < 4.124, P > 0.05), which was also reflected in the 95% confidence interval [CI] of the mean differences, where 0 lies within the interval. However, the difference in PPT in the quadriceps between sessions approached significance. Moreover, between-session assessments were moderately correlated (r ≥ 0.72), and ICCs were excellent, with values ≥0.84 for both sites (Table 2).
Between-session test-retest reliability for baseline pressure pain threshold and exercise-induced hypoalgesia assessed in the dominant quadriceps and nondominant upper trapezius muscles as absolute and relative change in PPT
| Variable | Session 1, Mean ± SD (95% CI) | Session 2, Mean ± SD (95% CI) | Absolute Between-Session Difference, Mean ± SD (95% CI) | Relative Between-Session Difference, Mean ± SD (95% CI) | P Value | Effect Size | Pearson r | ICC3, 1 (95% CI) | Standard Error of Measurement |
|---|---|---|---|---|---|---|---|---|---|
| Quad baseline | 616 ± 198 kPa (547–685) | 565 ± 198 kPa (496–634) | 51 ± 148 kPa (−0.1 to 103) | 7.1 ± 24.0 (−1.3 to 15.5) | 0.051 | 0.11 | 0.72 | 0.84 (0.68–0.92) | 105 kPa |
| P < 0.001 | |||||||||
| Trap baseline | 340 ± 127 kPa (295–384) | 335 ± 125 kPa (291–378) | 5 ± 85 kPa (−25 to 35) | −1.5 ± 24.9 (−10.2 to 7.2) | 0.73 | 0.004 | 0.77 | 0.87 (0.74–0.94) | 60 kPa |
| P < 0.001 | |||||||||
| EIH quad (absolute) | 51 ± 84 kPa (22–80) | 104 ± 117 kPa (63–145) | −53 ± 121 kPa (−96 to −11) | −43.2 ± 1,216.1 (−467.5 to 381.1) | 0.015 | 0.166 | 0.31 | 0.45 (−0.1 to 0.73) | 86 kPa |
| P = 0.076 | |||||||||
| EIH quad (relative) | 10.6 ± 15.9% (5.1–16.1) | 18.5 ± 17.2% (12.5–24.5) | −7.9 ± 20.3% (−15 to −0.8) | −9.1 ± 1,378.9 (−490.2 to 472.1) | 0.03 | 0.135 | 0.15 | 0.40 (−0.1 to 0.70) | 14% |
| P = 0.149 | |||||||||
| EIH trap (absolute) | 18 ± 54 kPa (−1 to 36) | 27 ± 96 kPa (−6 to 61) | −10 ± 92 kPa (−42 to 22) | 2.3 ± 216.3 (−73.2 to 77.7) | 0.55 | 0.011 | 0.35 | 0.46 (−0.1 to 0.73) | 65 kPa |
| P = 0.042 | |||||||||
| EIH trap (relative) | 7.3 ± 17.6% (1.2–13.5) | 12.7 ± 27.3% (3.2–22.2) | −5.4 ± 29.9% (−15.8 to 5.1) | 0.6 ± 245.1 (−84.9 to 86.1) | 0.30 | 0.032 | 0.17 | 0.27 (−0.4 to 0.64) | 21% |
| P = 0.335 |
CI = confidence interval; EIH = exercise-induced hypoalgesia; PPT = pressure pain threshold.
The between-session test-retest reliability of EIH in the quadriceps (local EIH) and trapezius (remote EIH) sites were fair, with ICCs of 0.45 and 0.46, respectively (Table 2). However, significant systematic error in EIH in the quadriceps between sessions was found (F(1, 33) = 6.575, P = 0.015), with larger EIH response in session 2 compared with session 1. No systematic error in EIH in the trapezius site between sessions was found (F(1, 33) = 0.373, P = 0.546). Moreover, correlations between the EIH responses in the quadriceps and trapezius between sessions were generally not significant.
Difference in PPTs After Exercise Considered to Be Real
The minimal differences needed between separate PPT assessments in a subject for the difference in the PPT to be considered real were 70 kPa and 70 kPa for quadriceps and 38 kPa and 42 kPa for trapezius in session 1 and session 2, respectively (Table 1). Sixteen and 19 subjects demonstrated increases in PPT in the quadriceps muscle larger than the SEM in session 1 and session 2, respectively, with 11 subjects demonstrating larger increases in both sessions (κ = 0.24, 95% CI = −0.08 to 0.56, P = 0.15) (Table 3). Fourteen and 12 subjects demonstrated increases in PPT in the trapezius muscle larger than the SEM at session 1 and session 2, respectively, with five subjects demonstrating larger increases in both sessions (κ = 0.007, 95% CI = −0.33 to 0.34, P = 0.97).
Crosstabulations of the EIH responders and nonresponders at session 1 and session 2 in the quadriceps muscle (A) and the trapezius muscle (B), respectively
A) EIH Response in Quadriceps Muscle | EIH Response ≥ SEM in Session 2 | ||
Yes | No | ||
| EIH response ≥ SEM in session 1 | Yes | 11 | 5 |
| No | 8 | 10 | |
B) EIH Response in Trapezius Muscle | EIH Response ≥ SEM in Session 2 | ||
Yes | No | ||
| EIH response ≥ SEM in session 1 | Yes | 5 | 9 |
| No | 7 | 13 | |
EIH = exercise-induced hypoalgesia; SEM = standard error of measurement.
Discussion
This study is the first to investigate the relative and absolute between-session test-retest reliability of exercise-induced hypoalgesia in healthy subjects. As hypothesized, the incremental bicycling exercise significantly increased PPTs in exercising and nonexercising muscles in both sessions. No significant differences in PPTs were found after quiet rest. Assessment of PPTs showed excellent within-session and between-session test-retest reliability. The EIH response in exercising and nonexercising muscles demonstrated fair between-session test-retest reliability; however, the magnitude of the EIH response in the exercising muscle was significantly larger in session 2 compared with session 1. Moreover, the agreement in EIH responders and nonresponders between sessions was not significant. Finally, the self-reported time spent on physical activity was positively associated with PPT in the quadriceps, but not with the EIH response.
The Effect of Exercise on Pressure Pain Sensitivity
In agreement with previous research [15,16], the current study demonstrated increases in manual PPTs at exercising and nonexercising muscles immediately after high-intensity aerobic exercise. Moreover, the increase in PPT was higher in the exercising muscles compared with nonexercising muscles, which is in accordance with the findings from the only other study directly comparing local vs remote effects after aerobic exercise [4]. These findings indicate that hypoalgesia after exercise is related to activation of systemic pain inhibitory mechanisms, with widespread antinociceptive effects in concert with local or segmental pain inhibitory mechanisms. This finding could be related to the Gate Control Theory [17], where limb movement during exercise may excite large diameter afferent nerve fibers, inhibiting nociception. Interestingly, in healthy subjects, passive movements induced local hypoalgesia compared with a control condition, indicating a potential role of joint movement or proprioception in EIH [18]. Still, if this was a primary mechanism, low-intensity aerobic exercise would be expected to produce a local EIH response in the exercising body parts, which is often not the case [4]. A reduced EIH response after aerobic exercise has been related to increased widespread pressure pain sensitivity in patients with chronic musculoskeletal pain [8], and the difference in EIH between the quadriceps muscle and trapezius muscle could be related to different baseline pain sensitivity at the two assessment sites.
The most studied mechanism of the EIH response involves the endogenous opioid system, which may account for the multisegmental manifestations of EIH demonstrated in this study. Aerobic exercise results in an increased level of systemic β-endorphin [19,20], although it is not directly correlated to the reduction in pain sensitivity [19,21]. Moreover, the effect on EIH after administration of naloxone, an opioid antagonist, prior to aerobic exercise has demonstrated reduced EIH responses [22], although conflicting results have been demonstrated after aerobic exercise [21], and further research on the involvement of opiordergic mechanisms in EIH after aerobic exercise in warranted.
The multisegmental hypoalgesic response after exercise in this study may also be related to the experience of moderately intense pain during the exercise condition. To support the link between EIH and the “pain inhibits pain” mechanisms, a study including 16 healthy women found that the hypoalgesic response after aerobic exercise was greater following painful exercise than nonpainful exercise [6]. In addition, previous studies in subjects with chronic pain have demonstrated an association between EIH and CPM [8,23], indicating that subjects who demonstrate a greater ability to activate the descending inhibitory systems following a painful stimulus report greater hypoalgesia following exercise. However, if “pain inhibits pain” was the primary mechanism responsible for EIH in this study, greater EIH in session 1 would have been expected as more intense pain was reported during exercise in this session. In contrast, the EIH response was significantly larger in session 2. The experience of pain and discomfort during intense exercise is well recognized, and there is an association between rating of muscle pain intensity and exercise work intensity [24]; however, it has previously been demonstrated that muscle pain intensity decreases over repeated bicycling trials, as was also shown in the current study [25]. As power output and cadence were kept constant between sessions, it is possible that the reduced muscle pain rating in session 2 may be associated with the greater exercise-induced hypoalgesia in session 2 than session 1.
No significant difference in EIH was found between women and men. Recent studies on the influence of gender on the EIH response have demonstrated mixed results. Some studies have shown comparable EIH responses in men and women [26–28], while other studies have shown larger EIH responses in women [29,30]. Limitations regarding the gender effects should be considered. Although different phases of the menstrual cycle do not appear to influence the magnitude of the EIH response in women [31], data were not collected in the current experiments on the use of contraceptives, status of menopause, or menstrual cycle, which may affect the pain perception in the female participants [32]. Despite a massive increase in the number of studies investigating EIH, no studies have considered measurement error of the test stimulus, as some of the change in test stimulus may be due to measurement error when quantifying the EIH response, and no information on EIH responders and nonresponders considering these measurement errors has previously been reported. It is noteworthy that approximately 30% of healthy subjects included in this study were classified as EIH nonresponders, which warrants further studies investigating how exercise can be optimized to decrease pain sensitivity. Although PPTs demonstrated excellent within-session reliability, the variation between repeated assessments is approximately 10%, which is somewhat similar to the change in PPTs after exercise demonstrated in this study. Assessment methods with less within-session variation could improve the reliability of the exercise.
Finally, regular exercise has been linked with alterations in pain sensitivity, and athletes have significantly higher pain tolerance [10], report less pain intensity during experimental pain [30], and demonstrate a higher nociceptive withdrawal reflex threshold compared with normally active controls [33]. These findings are supported by the results of the current study, where a significant association between time spent on physical activity reported on the IPAQ and PPT in the quadriceps was found, indicating that physical activity involving the lower extremity decreases the pain sensitivity in the lower limb. No significant association between time spent on physical activity and the EIH response was found, which is in agreement with previous studies [28,34].
Test-Retest Reliability of PPT and EIH
Within-session (rest) and between-session test-retest reliability for PPTs demonstrated excellent ICC values (>0.8), confirming previous studies reporting ICCs above 0.7 [35], suggesting that PPT is a reliable quantitative method to assess pain sensitivity in humans. In addition, the SEM was reported for PPTs in the quadriceps and trapezius muscles within a retest period of 15 minutes, an interval that might be more relevant in terms of evaluation of EIH in future studies. It should be noted that SEM for the PPTs was determined based on the rest condition, which was always performed before the exercise condition. In case the variability in PPTs decreases over time due to a training effect, the SEM could be overestimated.
Although multisegmental EIH was produced after the incremental aerobic exercise condition in both sessions, the between-session test-retest reliability for EIH only demonstrated fair reliability for both exercising and nonexercising muscles. Moreover, the agreement in EIH responders and nonresponders between sessions was not significant. These findings could indicate that although aerobic exercise decreases pain sensitivity, considerable interindividual difference in the magnitude of EIH between sessions exists. There may be several reasons for the discrepancies in EIH between days. Subjects may improve their EIH response simply due to training effects (e.g., performing the first test serves as practice for subsequent tests) or due to the experience of EIH during the first session, which could induce expectations about EIH in the second session. This could potentially have a great impact on the effect of exercise on pain sensitivity in patients with chronic pain, as physical activity is often reduced [11], and where expectations about pain relief in response to exercise could be low. Interestingly, a smaller part of subjects were classified as EIH responders in session 1, but as EIH nonresponders in session 2. Significant differences between sessions in self-reported ratings of exertion and leg pain intensity during exercise may also have influenced the within-subject test-retest reliability. Standardization of these factors in EIH protocols should be investigated in the future.
In patients with chronic pain, several studies have demonstrated impaired EIH compared with asymptomatic controls [36,37]; however, the reliability of this response is unknown. However, the response may be expected to be even less reliable, as pain patients presented higher variability in PPT compared with healthy participants [38], further increasing the SEM.
The current between-session EIH reliability shows similar ICCs to what have been demonstrated for CPM responses. Although a recent systematic review on the test-retest reliability of CPM concluded that the intrasession reliability was good to excellent, only 50% of the included studies had good to excellent between-session reliability [39]. Strict standardization procedures and reduced bias induced by the person assessing pain sensitivity seem to increase the reliability of CPM protocols [35,40], and this should be considered in future EIH studies. The main limitations of this study were 1) the nonrandomized order between quiet rest and exercise; 2) lack of blinding of the assessor; 3) the inclusion of only two test sessions as a plateau in EIH was not reached, and it could be hypothesized that the EIH response would become more stable over time due to stabilization of yet unknown physiological or psychological mechanisms affecting the EIH response; and 4) the lack of assessment of expectations about the effect of exercise on PPTs, as the reliability measures of change in PPT could be the reliability of such expectations and not necessarily the specific effects of exercise.
Conclusion
An incremental aerobic bicycling exercise consistently increased PPTs compared with a control condition in healthy subjects. The test-retest reliability of PPTs was excellent; however, the relative and absolute reliability of the EIH response in exercising and nonexercising muscles were rather low. Subjects who spent more time on physical activity involving the lower extremities had higher PPTs in the quadriceps, but time spent on physical activity was not associated with the EIH response. These data may have an impact on future studies investigating EIH in subjects with and without pain, and potentially for the practitioner who designs exercise programs for pain relief.
Future research is warranted to investigate 1) the reliability of different exercise protocols, 2) whether the EIH response can be further increased over time, and 3) the applicability of these findings in a clinical pain population.
Funding sources: No funding was received for this study. TGN is a part of the Center for Neuroplasticity and Pain (CNAP), supported by the Danish National Research Foundation (DNRF121).
Conflicts of interest: There are no actual or potential conflicts of interest for any of the authors.
