


Abstract
A reexamination of the genome of the tomato (renamed Solanum lycopersicum L.) indicates that it contains five, or at most perhaps six, phytochrome genes (PHY), each encoding a different apoprotein (PHY). Five previously identified tomato PHY genes have been designated PHYA, PHYB1, PHYB2, PHYE, and PHYF. A molecular phylogenetic analysis is consistent with the hypothesis that the angiosperm PHY family is composed of four subfamilies (A, B, C/F, and E). Southern analyses indicate that the tomato genome does not contain both a PHYC and a PHYF. Molecular phylogenetic analyses presented here, which utilize for the first time full-length PHY sequences from two completely characterized angiosperm gene families, indicate that tomato PHYF is probably an ortholog of Arabidopsis PHYC. They also confirm that the angiosperm PHY family is undergoing relatively rapid differential evolution. Assuming PHYF is an ortholog of PHYC, PHY genes in eudicots are evolving (Ka/site) at 1.52–2.79 times the rate calculated as average for other plant nuclear genes. Again assuming PHYF is an ortholog of PHYC, the rate of evolution of the C and E subfamilies is at least 1.33 times the rate of the A and B subfamilies. PHYA and PHYB in eudicots are evolving at least 1.45 times as fast as their counterparts in the Poaceae. PHY functional domains also exhibit different evolutionary rates. The C-terminal region of angiosperm PHY (codons 800–1105) is evolving at least 2.11 times as fast as the photosensory domain (codons 200–500). The central region of a domain essential for phytochrome signal transduction (codons 652–712) is also evolving rapidly. Nonsynonymous substitutions occur in this region at 2.03–3.75 times the average rate for plant nuclear genes. It is not known if this rapid evolution results from selective pressure or from the absence of evolutionary constraint.
Introduction
Plants are immobile organisms that use solar radiation as a source of energy for metabolic processes, growth, and reproduction. It is therefore not surprising that during evolution they have acquired an array of photosensory mechanisms that allow them to detect light quantity, quality, directionality, and photoperiodicity. Nor is it surprising that these plant photosensory mechanisms directly control changes in metabolism and development. Phytochromes, the best characterized of these plant photosensors, are chromoproteins that regulate the expression of a large number of light-responsive genes and many photomorphogenic events, including seed germination, photoperiodic flowering, fruit ripening, stem elongation, and chloroplast development (Kendrick and Kronenberg 1994 ).
Convincing evidence now confirms the early hypothesis (Hillman 1967 ) that individual plants contain multiple functional phytochromes. All angiosperms rigorously characterized to date contain a small number of different PHY apoproteins encoded by a small PHY family. For example, Arabidopsis contains five PHY genes (PHYA, PHYB, PHYC, PHYD, and PHYE), all of which are expressed (Clack, Mathews, and Sharrock 1994 ; Sharrock and Quail 1989 ). PHYA, PHYB, PHYC, and PHYE encode evolutionarily divergent proteins sharing only 46%–53% amino acid sequence identity (Clack, Mathews, and Sharrock 1994 ). PHYD encodes an apoprotein (PHYD) that shares 80% amino acid sequence identity with PHYB and is a member of the same subfamily (Clack, Mathews, and Sharrock 1994 ). Thus, the Arabidopsis PHY family consists of five members that fall into four subfamilies (A, B, C, and E). The monophyly of these four PHY subfamilies is strongly supported by phylogenetic analyses that include sequences of PHY from many angiosperm and nonangiosperm species (Mathews, Lavin, and Sharrock 1995 ).
Comparisons of angiosperm PHY genes with those in nonflowering plants indicate that this gene family has increased in both size and complexity during the evolution of flowering plants (Kolukisaoglu et al. 1995 ; Mathews and Sharrock 1997 ). Furthermore, research assessing the divergence of the PHY gene family within the angiosperms led to the hypothesis that PHY family size and complexity differ significantly among flowering plant families. Specifically, the initial characterization of the tomato PHY family suggested that it was both larger and more complex than the Arabidopsis PHY family, containing some 9–13 PHY genes (Hauser et al. 1995 ). To date, five PHY genes have been cloned from the tomato. Four of them (PHYA, PHYB1, PHYB2, and PHYE) encode apoproteins that share with their Arabidopsis counterparts 88%–98% amino acid sequence identity in a conserved photosensory domain (Hauser et al. 1995 ). A fifth (PHYF) encodes an apoprotein that shares with its closest Arabidopsis relative (PHYC) only 74% amino acid sequence identity in this conserved domain. For this and other reasons, it was initially identified as a member of a new PHY subfamily (Hauser et al. 1995 ; Pratt et al. 1997 ).
Five additional data sets support the hypothesis that the complexity of this gene family differs among angiosperms. First, PCR-based surveys of eudicots indicate that PHYB and PHYD derive from a gene duplication event in angiosperms, while comparable surveys for monocotyledons failed to detect multiple members of the PHYB subfamily (Mathews, Lavin, and Sharrock 1995 ). Second, a PCR-based survey of the grasses and Southern hybridization of rice genomic DNA led to the conclusion that the Poaceae contain only members of the A, B, and C subfamilies (Mathews and Sharrock 1996 ). Third, genomic Southern and molecular phylogenetic analyses establish that black cottonwood (Populus trichocarpa) has one PHYA locus and two PHYB loci, but these analyses strongly suggest that this species lacks members corresponding to PHYC, PHYE, and PHYF (Howe et al. 1998 ). Fourth, PCR-based surveys of the legume tribe Millettieae revealed multiple PHYA genes but failed to detect PHYC (Lavin et al. 1998 ). Fifth, molecular phylogenetic evidence suggests that PHYB and PHYD in Arabidopsis, PHYB1 and PHYB2 in the tomato, and PHYB1 and PHYB2 in the black cottonwood all arose from parallel, independent duplication events (Mathews, Lavin, and Sharrock 1995 ; Pratt et al. 1995 ; Howe et al. 1998 ).
These investigations of PHY family complexity raise questions about the evolution of the angiosperm PHY family. In part to provide a foundation for addressing these questions, we report here data clarifying the size and complexity of the PHY family in the tomato. With this second complete set of full-length PHY sequences, we are then able to present a comprehensive, comparative analysis of the absolute rates of evolution of individual PHY genes, of different PHY subfamilies, and of PHY genes from major angiosperm clades. Furthermore, we are also able to report a rigorous comparative analysis of the evolution of structural/functional domains in angiosperm PHY genes.
Materials and Methods
Plant Materials
Tomato (cv. UC-82B, Lycopersicon esculentum Miller, redesignated Solanum lycopersicum L. by Spooner, Anderson, and Jansen 1993 ) seed was purchased from Sunseeds Genetics Inc. (Hollister, Calif.). Plants were cultivated in a greenhouse using standard horticultural practices without supplemental lighting. Immature green leaves were harvested from plants 1–3 months old, frozen in liquid N2, and either processed immediately or stored at −80°C.
Riboprobes
Tomato PHY templates (encoding amino acids KPFYA through DIPQA, corresponding to codons 159–271 in the numbering system used here) and methods for transcribing 32P-labeled complementary RNA probes are detailed in Hauser et al. (1995) . Using previously described primers and reaction conditions (Hauser et al. 1995 ), the homologous template (encoding amino acids KPFYA through DIPQA) of Arabidopsis PHYC was amplified by PCR from a lambda-phage PHYC clone kindly provided by Joanne Chory (the Salk Institute). This homologous Arabidopsis PHYC template was subsequently ligated into the modified pBluescript vector described in Hauser et al. (1995) . Except for the PHYF riboprobe, which is 68 nt shorter (Hauser et al. 1995 ), these riboprobes are 338 nt long. Richard Meagher (University of Georgia) generously provided the Arabidopsis actin template. Methods for transcribing 32P-labeled complementary RNA actin probes are detailed in Hauser, Pratt, and Cordonnier-Pratt (1997) .
Genomic DNA Blots
Tomato genomic DNA was extracted and purified from immature green leaves as described previously (Hauser et al. 1995 ). Purified genomic DNA was digested twice with 5 U of endonuclease per μg of DNA according to the manufacturer's instructions (Gibco BRL, Grand Island, N.Y.). Plasmids used as templates for preparing PHYA, PHYB1, PHYB2, PHYE, and PHYF riboprobes (Hauser et al. 1995 ) were linearized with a site-specific endonuclease, diluted in TE (10 mM Tris-Cl, 1 mM EDTA [pH 8]) with 50 μg/ml tRNA, and included as single-gene molar equivalents in all genomic DNA gels. These linearized plasmids were about 3.3 kb in size. Molar equivalent loads were determined assuming a 1C genome weight for tomato of 0.9875 pg (Arumuganathan and Earle 1991 ). A size ladder to which PHY probes hybridize was included on all genomic DNA gels. The ladder was constructed by mixing NotI, EcoRI/NotI, and EcoRI/XbaI digests of a PHYF genomic clone with a linearized plasmid containing a portion of PHYF (about 3.3 kb, described above) and a PHYA PCR product of 654 nt. The NotI, EcoRI/NotI, and EcoRI/XbaI digests produced PHY fragments of 14.9, 9.8, and 5.4 kb, respectively. All five radioactive PHY probes remain hybridized to the PHY fragments in this size ladder after medium-stringency washes, thus facilitating accurate size determination of genomic DNA fragments.
Genomic DNA was separated in 0.6% agarose gels, and blots were prepared and hybridized as described previously (Hauser et al. 1995 ). Following hybridization, membranes were washed for 3 × 10 min at one of five stringencies (Sambrook, Fritsch, and Maniatis 1989 ): 1.0 × SSC + 1.0% SDS at 50°C (low), 1.0 × SSC + 1.0% SDS at 55°C (medium low), 1.0 × SSC + 1.0% SDS at 65°C (medium), 0.2 × SSC + 0.1% SDS at 50°C (medium high), or 0.2 × SSC + 0.1% SDS at 68°C (high). Images of washed membranes were obtained with a PhosphorImager (Model 425F, Molecular Dynamics, Inc., Sunnyvale, Calif.) and analyzed with ImageQuant, version 4.2a, software. Exposures ranged from 1.5 to 8 days, depending on wash stringency and probe signal intensity.
Molecular Evolution and Phylogenetic Analysis of PHY Sequences
Twenty-eight PHY sequences (table 1 ), including five from the tomato, were aligned using the GCG programs LINEUP and PILEUP (Devereux 1989 ). Full-length sequences were edited (see fig. 6A ) as described by, and for reasons given by, Kolukisaoglu et al. (1995). Specifically, the hypervariable region that is up to 33 codons in length and is located approximately 30 codons downstream from the site of chromophore attachment, nucleotides encoding the N-terminal extensions present in only some PHYB apoproteins, and all 3′ codons exceeding the shortest sequence were eliminated from the aligned sequences (see fig. 6A ). Short indels (one to four codons) were also eliminated from the alignments. Gaps created during nucleotide alignments were edited by hand with reference to amino acid sequence alignments. The final alignments consisted of 1,105 amino acid or 3,315 nucleotide characters, which are a minimum of 85% and an average of 91% of all characters possible. The codon numbering system used here is based on this alignment.
Unrooted molecular phylogenies and bootstrap values (100 bootstrap replicates) were obtained with PAUP, version 3.1.1, using a heuristic search with multiple random taxon addition (25 replicates) and the TBR branch-swapping options (Swofford 1993 ). Molecular phylogenies generated in a similar fashion, but using the moss Physcomitrella patens as a root, yield identical results. Molecular phylogenies and bootstrap values obtained with PHYLIP (Felsenstein 1995 ) are highly consistent with those presented here (data not shown).
Numbers of nonsynonymous substitutions (Ka; table 2 ) were determined with the GCG program NEWDIVERGE (Wisconsin Package, Genetics Computer Group, Madison, Wis.), which uses the algorithm of Li, Wu, and Luo (1985) as modified by Li (1993) . Absolute rates of nonsynonymous substitution (Ka/year; table 3 ) are mean values derived from all possible pairwise comparisons in the specified category. Divergence dates (fig. 1 ) used to calculate absolute rates of nonsynonymous substitution are derived from the fossil record and molecular data (see references in Chaw et al. 1997 ).
Intra- and intersequence identities within and among phytochrome amino acid sequences were determined with the GCG program PLOTSIMILARITY using the Identity program option and a scanning window of 30 aa.
Results
Reevaluation of Tomato PHY Family Size and Complexity
At low stringency (1.0 × SSC + 1.0% SDS at 50°C), all five tomato PHY riboprobes, as a mixture (fig. 2A ) and individually (fig. 3 and data not shown), hybridize to genomic fragments that comigrate with abundant fragments visible in the ethidium bromide–stained gel prior to DNA transfer. At this stringency, riboprobe signal due to nonspecific adsorption to the nylon filter is greater than that from specific hybridization to PHY genomic fragments or to single-gene molar equivalents. At medium stringency (1.0 × SSC + 1.0% SDS at 65°C), all genomic fragments detected after low- and high-stringency washes are observed (fig. 2 ). At this stringency, signals from single-gene reconstructions are greater than background signal and equal in intensity to most genomic fragments visualized after high-stringency washes. At high stringency (0.2 × SSC + 0.1% SDS at 68°C), the mix of five PHY riboprobes identifies a minimum of five genomic fragments (fig. 2A and B, Bam HI and EcoRI lanes; PHYF signal in the BamHI lane is weak, and PHYB1 and PHYB2 comigrate after digestion with EcoRI). At high stringency (fig. 2A ), no more than seven genomic fragments are detected (EcoRV lane). Genomic fragments containing sequence homologous to the PHY probes were subsequently identified (fig. 2 , schematic) by sequential hybridization of the five individual PHY riboprobes to an equivalent DNA blot (fig. 2B ). The sizes of these identified PHY fragments are as predicted from restriction maps of the five tomato PHY genes (data not shown). Results identical to those shown here were obtained independently using three different genomic DNA blots.
At low stringency, the Arabidopsis PHYC riboprobe hybridizes with one (HindIII lane) to six (BamHI lane) tomato genomic fragments (fig. 3 ). At this stringency, all tomato PHY riboprobes (only PHYB2 data shown) and an Arabidopsis actin riboprobe also hybridize to these same genomic fragments. Increases in wash stringency did not reveal any additional tomato genomic fragments to which the Arabidopsis PHYC probe hybridizes (data not shown), nor did they reveal cross-hybridization of this PHYC riboprobe to the tomato PHYF genomic fragments.
A molecular phylogeny (fig. 4 ) generated using 26 full-length nucleotide sequences for angiosperm PHY (table 1 ) indicates that the basic topology of the tomato PHY family does not differ from that described for the Arabidopsis PHY family (Mathews and Sharrock 1997 ).
Variation of Evolutionary Rate Within and Among Phytochrome Sequences
Sequence divergence at both nonsynonymous sites (Ka) and synonymous sites (Ks), as well as absolute rates of divergence (Ka/year), were determined for all full-length PHY sequences collectively and for all full-length PHY sequences within each subfamily. Due to the frequent saturation of synonymous sites in PHY sequences, Ks and Ka/Ks values were uninformative and are not considered here.
Table 3 indicates that angiosperm phytochromes are evolving (Ka/year) at 1.44–2.57 times the rate calculated as average (Wolfe, Sharp, and Li 1989 ) for other plant nuclear genes (N ≥ 4, P < 0.01). In addition, Ka and Ka/year were determined for different PHY subfamilies, eudicots versus grasses, and different phytochrome functional domains (tables 2 and 3) . Based on the divergence times shown in figure 1 , these data demonstrate that (1) the C/F clade and the E subfamily are evolving at least 1.33 times as fast as the A and B subfamilies (N ≥ 5, P < 0.01), (2) A and B subfamilies in eudicots are evolving 1.45 times as fast as their equivalents in the Poaceae (N ≥ 5, P < 0.001), (3) the phytochrome signal transduction/dimerization domain is evolving at least 2.11 times as fast as the photosensory domain (N = 4, P < 0.05), and (4) much of a domain (amino acids 652–712) that is essential in phytochrome A and phytochrome B for signal transduction (Wagner and Quail 1995 ) is evolving at least 2.03 times as fast as the photosensory domain (N = 4, P < 0.05).
Sequence Divergence (Ka) as a Function of Divergence Time
Evaluation of Ka as a function of presumed sequence divergence time demonstrates that the evolution of the A and B subfamilies is characterized by a near-linear rate of sequence divergence (fig. 5 ). The evolution of the C/F clade and the E subfamily is not characterized by a nearly constant rate of divergence, indicating that these PHY genes are under different evolutionary constraints than the A and B subfamilies. For codons 200–500, the highest Ka value observed (Kamax) for each of the four subfamilies ranges from 0.208 to 0.264 (fig. 5A ; mean = 0.238 ± 0.025). For codons 652–712, Kamax for the C/F clade and the E subfamily ranges from 0.458 to 0.513 (mean = 0.486 ± 0.039), while the Kamax for the A and B subfamilies ranges from 0.398 to 0.411 (fig. 5B ; mean = 0.404 ± 0.010). For codons 800–1105, Kamax for the C/F clade and the A and E subfamilies ranges from 0.493 to 0.515 (mean = 0.502 ± 0.011), while Kamax for the B subfamily is 0.383 (fig. 5C ). These data strongly support the hypothesis that angiosperm PHY subfamilies and different regions of the phytochrome protein are evolving differentially (Mathews, Lavin, and Sharrock 1995 ; Mathews and Sharrock 1997 ).
Differential Evolution of Phytochrome Proteins
A comprehensive investigation of primary amino acid sequence divergence in angiosperm phytochromes also strongly supports the hypothesis (Mathews and Sharrock 1997 ) that phytochrome protein domains are evolving at different rates (fig. 6 ). The site of chromophore attachment and three or four other regions located between amino acids 200 and 550 are the most conserved regions of the entire protein. Amino acids 610–775 contain two direct repeats (PAS domains) that are highly conserved among angiosperm phytochromes and share sequence similarity with a variety of proteins involved in circadian rhythms or signal transduction pathways (Borgstahl, Williams, and Getzoff 1995;Lagarias, Wu, and Lagarias 1995 ). In Drosophila, a similar domain mediates specific protein-protein interactions that occur in signal transduction pathways involving the per, arnt, and sim loci (Crews, Thomas, and Goodman 1988 ; Huang, Edery, and Rosbash 1993 ; Lindebro, Poellinger, and Whitelaw 1995 ). The first of these two direct repeats (amino acids 610–630) might also be involved in phytochrome dimerization (Edgerton and Jones 1992 ). The primary sequence encoding the structural ‘hinge’ domain (amino acids 585–615; Manabe and Nakazawa 1997 ) is highly divergent. The C-terminal domain with slight similarity to bacterial sensor proteins (amino acids 800–1050; Schneider-Poetsch 1992 ) and much of a domain that is essential in phytochrome A and phytochrome B for signal transduction (amino acids 610–750; Wagner and Quail 1995 ; Xu et al. 1995 ) also contain extensive sequence divergence.
Discussion
The Tomato PHY Family
Hybridization of all five PHY riboprobes, either as a mixture or independently, to blotted tomato genomic DNA identifies 8–12 genomic restriction fragments, depending on the endonuclease used and the stringency with which the blot was washed (fig. 2A ). Although these data imply that the tomato PHY family might be as large as 12 members, four observations indicate that this is not the case. First, most genomic fragments identified after low-stringency washes comigrate with repetitive DNA visible in ethidium bromide–stained genomic DNA gels (fig. 2A ), indicating that at this stringency the PHY probes are probably hybridizing nonspecifically with abundant, repetitive DNA fragments. The observation that PHY riboprobes are easily stripped from these genomic fragments under more stringent conditions is consistent with this hypothesis. As expected, however, the probes are not stripped from their corresponding targets at high stringency (fig. 2A and B ). Second, after low-stringency washes, the signals from hybridization to these genomic fragments far exceed those obtained from the PHY single-gene reconstructions, confirming that these genomic fragments are highly abundant in the tomato genome (fig. 2A ). Third, an Arabidopsis actin riboprobe hybridizes equally well with these genomic fragments, again consistent with the hypothesis that these fragments derive from repetitive DNA (fig. 3 and data not shown). Fourth, the EcoRV restriction fragment labeled strongly at low stringency is the same size as a high-copy rRNA EcoRV fragment cloned by Vallejos, Tanksley, and Bernatzky (1986). These observations lead to the conclusion that all genomic fragments visualized after low-stringency washes are artifacts of nonspecific hybridization with repetitive DNA fragments (figs. 2 and 3 ). Assuming this conclusion to be true, we find five, or at most six, tomato PHY genes. All five of the PHY genes cloned from the tomato have been mapped to the nuclear genome (van Tuinen et al. 1997 ).
Does the Tomato Genome Contain More Than Five PHY Genes?
To determine if any of the unidentified genomic fragments that hybridize with PHY riboprobes (fig. 2A, schematic; see “?”) derive from a tomato PHYC locus independent of that already identified as PHYF, Southern analyses were conducted with a PHYC riboprobe from Arabidopsis, the five PHY riboprobes from tomato individually, and an actin riboprobe from Arabidopsis (fig. 3 and data not shown). Data from these analyses indicate that the Arabidopsis PHYC riboprobe does not hybridize to any of these unidentified genomic fragments. In addition, the hybridization of the Arabidopsis PHYC riboprobe to genomic fragments containing known tomato PHY genes is not observed at any stringency (fig. 3 and data not shown), even though the riboprobe is from one of the most highly conserved regions of the gene (codons 159–271, fig. 6A ). This observation is consistent with the extensive divergence between the PHYC riboprobe and all of the tomato PHY genes, including PHYF. Finally, the Arabidopsis PHYC riboprobe hybridizes (presumably nonspecifically) to the abundant repetitive DNA fragments identified with all tomato PHY riboprobes (fig. 3 ), including those fragments identified by Hauser et al. (1995) as deriving from a putative PHYC gene. Collectively, these data demonstrate that the initial evidence for a tomato PHYC gene in addition to that identified as PHYF (Hauser et al. 1995 ) is artifactual, due to nonspecific hybridization of riboprobes to repetitive DNA fragments in the tomato genome.
The identities of the genomic fragments that hybridize weakly with PHY riboprobes (fig. 2A, “?”) have yet to be determined. Nonetheless, our data imply that these unidentified genomic fragments do not encode a sixth tomato PHY gene. If a sixth PHY gene exists in the tomato genome, one would predict that an unidentified genomic fragment (“?”) in the EcoRV lane and those in the HindIII and XbaI lanes would all hybridize preferentially to a single tomato PHY riboprobe. In fact, this is not the case. Results obtained by following hybridization with individual riboprobes as a function of stringency (data not shown) demonstrate that a tomato PHYA riboprobe hybridizes preferentially to two of these unidentified genomic fragments (EcoRV and XbaI lanes), a tomato PHYB2 riboprobe hybridizes preferentially to another (HindIII lane), and an Arabidopsis actin riboprobe hybridizes preferentially to the fourth (EcoRV lane). Moreover, if a sixth tomato PHY gene exists, one would expect that this PHY gene would yield an identifiable restriction fragment following digestion with most (if not all) endonucleases, which is not the case (see fig. 2 ). It therefore appears that the tomato, like Arabidopsis, contains only five PHY genes.
Is Tomato PHYF an Ortholog of Arabidopsis PHYC?
A molecular phylogeny generated using full-length nucleotide sequences is consistent with the hypothesis that PHYF belongs to the C subfamily (fig. 4 ). A phylogenetic analysis using partial sequence data (282 bp), including tomato PHYF and eight partial sequences from PHYC loci, provides strong evidence that PHYF belongs to the PHYC clade (Mathews and Sharrock 1997 ). Unfortunately, the fact that only three full-length PHYC/F sequences are currently available for the phylogenetic analysis of this clade makes it difficult, if not impossible, to determine whether PHYF is an ortholog or a paralog of Arabidopsis PHYC. Nonetheless, the most parsimonious conclusion from these results is that tomato PHYF is an ortholog of Arabidopsis PHYC and, thus, a member of the C subfamily. Additional full-length sequence data and subsequent phylogenetic analyses will be needed, however, to resolve this issue unambiguously.
Absolute Rates of Phytochrome Evolution in Angiosperms
Tables 2 and 3 present the first comprehensive analysis of subfamily-specific rates of evolution of the phytochrome coding sequence in angiosperms, made possible in part by resolving the complete PHY family of the tomato. Table 3 shows that PHY genes in eudicots are evolving at 1.52–2.79 times the rate defined as average for other plant nuclear genes (assuming PHYF is an ortholog of PHYC) (Wolfe, Sharp, and Li 1989 ). The most likely explanation for these elevated rates of nonsynonymous substitution is that PHY duplication allows one of the two resulting PHY genes to evolve new functions. A second explanation for the elevated rate of evolution among phytochromes is that only a small percentage of the phytochrome amino acid sequence is highly constrained, leaving a large percentage of the sequence to drift freely. Despite the attractiveness of these two explanations, it is also important to acknowledge that the evolutionary rates presented here are based on estimates of the dates of common ancestry of various taxa (fig. 1 ). Thus, because of uncertainty regarding divergence times of the species for which PHY data are available, absolute rates of evolution presented here might be inaccurate. Despite this uncertainty, assuming that the divergence dates applied here are reasonably accurate, these results indicate that the absolute rates of evolution (Ka/year) of PHY sequences from eudicots are greater than that defined as average for other plant nuclear genes (Wolfe, Sharp, and Li 1989 ). Currently, it is not known if this seemingly rapid evolution is due to some selective pressure or to a lack of evolutionary constraint.
Comparison of the rates of nonsynonymous substitution in PHY from grasses with their equivalents in the eudicots is also informative. These results strongly support the hypothesis that PHY genes in grasses are evolving more slowly than PHY genes in eudicots (Mathews and Sharrock 1996 ). Table 3 shows that full-length PHYA and PHYB genes in eudicots are evolving at least 1.45 times as fast as their counterparts in the grasses. Thus, not only is the grass PHY family apparently smaller than the PHY family in eudicots (Mathews and Sharrock 1997 ), but it also seems to be evolving more slowly. Whether these characteristics of grass PHY apply to other monocots is uncertain. Furthermore, because all comparisons derive from only a single estimate (60 MYA) of divergence time for the origin of the monocots (fig. 1 ), the evolutionary rates presented here may be erroneous. Nonetheless, if the evolutionary rates presented here are accurate, they indicate a decreased rate of phytochrome evolution in grasses.
PHY Divergence is Characterized by Subfamily-Specific Evolutionary Constraints
A summary of the first comprehensive investigation of absolute rates of subfamily-specific evolution in the phytochrome coding sequence (tables 2 and 3) confirms the hypothesis that phytochromes in different subfamilies evolve at different rates (Kolukisaoglu et al. 1995 ; Mathews, Lavin, and Sharrock 1995 ; Mathews and Sharrock 1996, 1997 ). Because these rates all derive from the same assumptions concerning divergence dates (fig. 1 ), comparisons among them remain valid even if there is some error in these dates. Assuming tomato PHYF is in the C subfamily, the rate of nonsynonymous substitution in full-length sequences from the A and B subfamilies is 36% slower than the rate in the C and E subfamilies. These subfamily-specific differences in evolutionary rates are observed when full-length or partial sequences (codons 200–500, 652–712, or 800–1105) are analyzed. Tables 2 and 3 and figure 5D are all consistent with the idea that the B subfamily is slightly more constrained than the A subfamily, which is more constrained than the C and E subfamilies (Mathews and Sharrock 1997 ). Furthermore, figure 5D demonstrates that the four PHY subfamilies in angiosperms have been constrained differentially throughout the evolution of flowering plants. It is not known why these subfamily-specific evolutionary constraints exist. Nonetheless, the apparently greater constraint on the evolution of the A and B subfamilies is consistent with the hypothesis that PHYA and PHYB encode phytochromes with more ancient functions (Kolukisaoglu et al. 1995 ), while PHYC and PHYE encode phytochromes whose functions arose more recently.
Molecular Evolution of Phytochrome Functional Domains
Variation in the rates of evolution of different regions of the PHY sequence vary from 2.11- to 3.72-fold (table 2 ; compare codons 200–500 with codons 800–1105). These domain-specific evolutionary rates can be ascribed to domain-specific evolutionary constraints (fig. 5 ). Specifically, codons 200–500, which encode the phytochrome photosensory domain, are highly constrained when compared with codons 652–712 and 800–1105 (fig. 5 ). Figure 5 also demonstrates that the domain-specific constraints are subfamily-specific in all regions analyzed except codons 200–500.
Two observations imply that the phytochrome photosensory domain is ancient and under significant evolutionary constraint. First, cyanobacterial genomes (Synechocystis sp. PCC6803 and Fremyella) contain sequence with similarity to this domain in angiosperms (Kehoe and Grossman 1996 ; Hughes et al. 1997 ). Second, results presented here (table 2 and figs. 5 and 6 ) confirm an earlier observation (Mathews, Lavin, and Sharrock 1995 ) that the amino acid sequences that fold into this photosensory domain are evolving slowly in angiosperms. We presume that this sequence constraint is due to the tertiary structural requirements of this light-sensory mechanism and the adaptive value of this photosensory trait.
These data provide the most comprehensive evidence to date that most of the phytochrome signal transduction/dimerization domain is evolving quickly and therefore is highly divergent. Perhaps most surprisingly, the central region (codons 652–712) of a domain essential for regulatory activity in A- and B-type phytochromes (Quail 1997 ) is evolving rapidly. Nonsynonymous substitutions have occurred in this region 2.03–3.75 times more frequently than in average plant nuclear genes (table 3 ). In addition, the acceleration of the evolutionary rate of this apparently essential PHY domain differs among subfamilies. Furthermore, in complete agreement with previous findings (Mathews, Lavin, and Sharrock 1995 ; Mathews and Sharrock 1996, 1997 ), figures 5 and 6 provide novel evidence that most of the sequences encoding the C-terminal half of angiosperm PHY (codons 600–1105) are significantly more divergent than those sequences encoding the photosensory domain (codons 1–550). Figure 6 also provides novel data that demonstrate the extent of divergence of all regions within the PHY coding sequence. Three observations are consistent with the hypothesis that the rapid divergence of the C-terminal half of PHY is associated with a functional divergence of these photoreceptors. First, although it is likely that this region of PHY is derived from a prokaryotic histidine kinase (Schneider-Poetsch 1992 ; Yeh et al. 1997 ), evidence demonstrating that angiosperm phytochromes function as histidine kinases is lacking. Yeh and Lagarias (1998) have, however, proposed that eukaryotic phytochromes are histidine kinase paralogs that have evolved serine/threonine specificity from a prokaryotic ancestor with histidine specificity. Consistent with this proposal is the report of Fankhauser et al. (1999) that a protein involved in phytochrome signaling is phosphorylated in a phytochrome-dependent manner. Nonetheless, the observation that at least one phytochrome probably signals via serine/threonine phosphorylation does not yet permit one to conclude that all phytochromes function in the same way. Second, the moss Ceratodon purpureus encodes two PHY apoproteins, of which one contains a C-terminal domain similar to those found in angiosperms, while the other contains a C-terminal domain with sequence similarity to tyrosine kinases (Thümmler et al. 1992 ; Hughes, Lamparter, and Mittmann 1996 ). Third, the fern Adiantum capillus-veneris encodes two PHY apoproteins similar to those found in angiosperms and a third PHY apoprotein composed of a photosensory domain linked to a serine/threonine kinase domain (Wada et al. 1997 ). If the hypothesis that the rapid divergence of the signal transduction/dimerization domain is associated with PHY functional divergence is correct, it would in part explain the long-standing difficulty in defining the signal transduction mechanism(s) of angiosperm phytochromes, because those mechanisms would differ among phytochromes.
Collectively, these data clearly support the hypothesis that the evolution of phytochromes is characterized by the conservation of an ancient photosensory domain and a rapidly evolving signal transduction/dimerization domain. The elevated rates of evolution for this latter domain are presumably related to acquisition of new molecular functions. Confirmation of this hypothesis will require a thorough understanding of phytochrome signal transduction/dimerization domains, continued acquisition and analysis of phytochrome mutants, and additional PHY sequence data from the genomes of prokaryotes, nonflowering plants, and angiosperms.
Pamela S. Soltis, Reviewing Editor
Present address: Department of Biology, Colorado College.
Abbreviations: PHY, phytochrome gene; PHY, phytochrome apoprotein. A specific PHY or PHY is designated by an appended letter and, where appropriate, a numeral is added (e.g., PHYB1, PHYB1).
Keywords: tomato (Solanum lycopersicum L.) phytochrome photoreceptor gene family molecular evolution
Address for correspondence and reprints: L. H. Pratt or M.-M. Cordonnier-Pratt, Department of Botany, University of Georgia, Athens, Georgia 30602-7271. E-mail: leepratt@uga.edu or mmpratt@uga.edu.
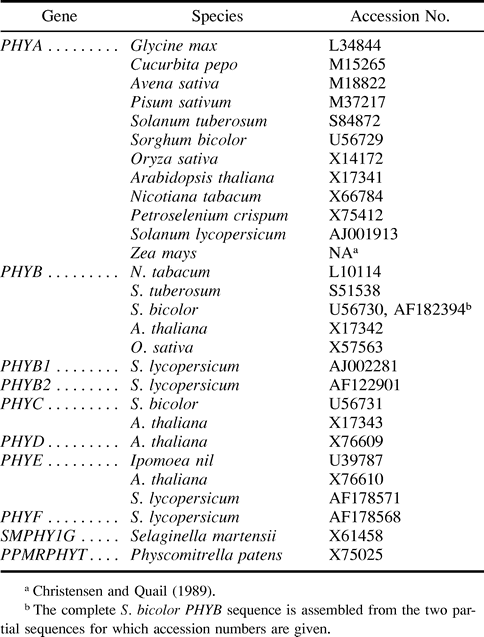
Table 2 Nonsynonymous Substitutions Per Nonsynonymous Site (Ka) in Different Regions of the Angiosperm Phytochrome Coding Sequence
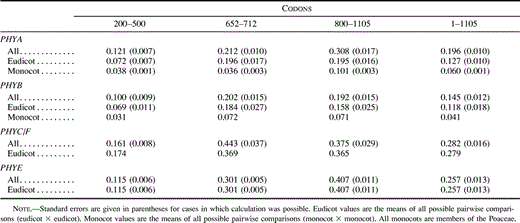
Table 2 Nonsynonymous Substitutions Per Nonsynonymous Site (Ka) in Different Regions of the Angiosperm Phytochrome Coding Sequence
Table 3 Absolute Rates of Nonsynonymous Substitutions (Ka/Year × 10−9) in Different Regions of the Angiosperm Phytochrome Coding Sequence
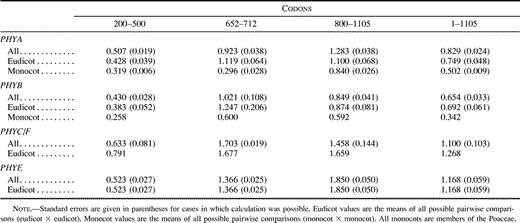
Table 3 Absolute Rates of Nonsynonymous Substitutions (Ka/Year × 10−9) in Different Regions of the Angiosperm Phytochrome Coding Sequence
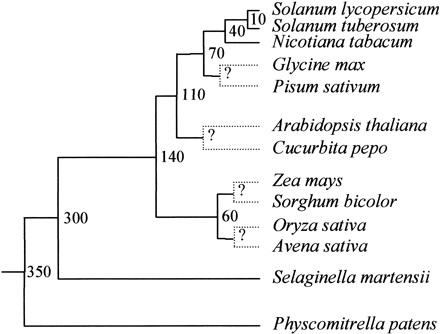
Fig. 1.—Divergence dates assumed in this study. The approximate divergence dates (MYA) shown at each node were used for all evolutionary rate calculations reported here. Dotted lines indicate unknown divergence dates
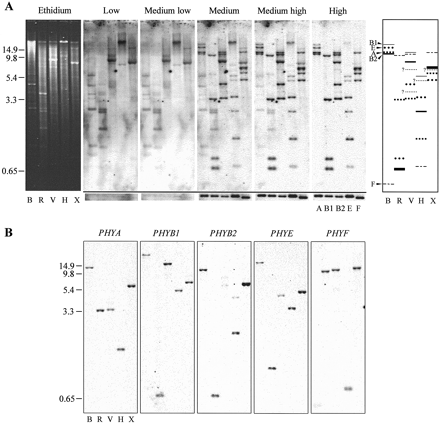
Fig. 2.—Determination of tomato PHY family size. Prior to electrophoresis, genomic DNA was digested with BamHI (B), EcoRI (R), EcoRV (V), HindIII (H), or XbaI (X). PHY single-copy reconstructions were run on the same gel. After electrophoresis, a single genomic DNA blot prepared from an ethidium bromide–stained gel, part of which is shown at the left, was hybridized with a mix of all five tomato PHY probes and washed at increasing stringencies. The region of the phosphorimage showing hybridization to single-copy reconstructions is shown in panel A below the black bar. (The labels A, B1, B2, E, and F refer only to these ‘excised’ single-gene reconstructions.) The schematic identifying individual fragments (A, at right) summarizes data from sequential hybridization of a second blot with individual PHY probes (B). The extra-thick bar in the EcoRI and XbaI lanes in the schematic indicates comigration of PHYB1 and PHYB2 fragments. Locations of PHY size standards (kb) are shown at the left. Abbreviations: A, PHYA; B1, PHYB1; B2, PHYB2; E, PHYE; F, PHYF.
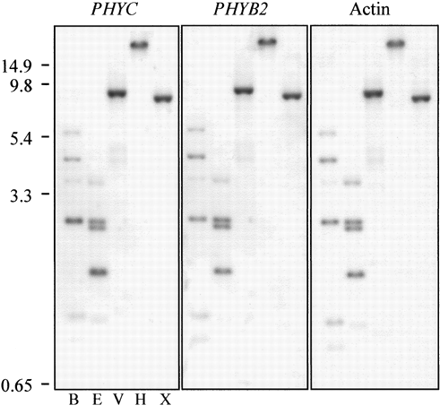
Fig. 3.—Low-stringency hybridization of Arabidopsis PHYC, tomato PHYB2, and actin riboprobes with tomato genomic DNA fragments. Prior to electrophoresis, genomic DNA was digested with BamHI (B), EcoRI (R), EcoRV (V), HindIII (H), or XbaI (X). Replicate genomic DNA blots were hybridized with the probe indicated and washed at 1.0 × SSC + 1.0% SDS at 50°C (the left and middle panels show independent hybridization to the same blot). Locations of PHY size standards (kb) are shown at the left
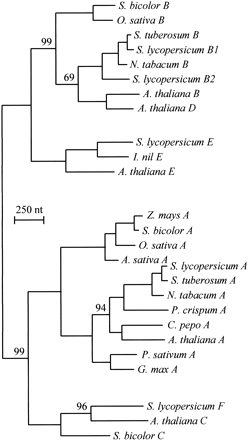
Fig. 4.—Molecular phylogeny of the angiosperm PHY family. This phylogeny was constructed with PAUP using 27 full-length PHY nucleotide sequences from angiosperms. Only bootstrap values less than 100% are shown; all other branches receive bootstrap values of 100% (100 bootstrap replicates)
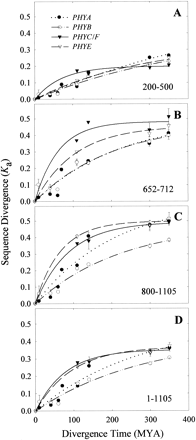
Fig. 5.—Phytochrome sequence divergence (Ka) as a function of divergence time (MYA). Ka values were determined for PHY sequences encoding amino acids 200–500 (A), 652–712 (B), and 800–1105 (C), as well as for the entire amino acid sequence alignment (D). Plotted Ka values are the means of all possible pairwise comparisons at particular time points. Dotted black line and filled circles = PHYA sequences. Dashed/dotted black line and open circles = PHYB sequences. Dashed black line and open triangles = PHYE sequences. Solid black line and filled triangles = PHYC/F sequences. Regressions were calculated on the assumption of an exponential rise to a maximum, using a two-parameter model (SigmaPlot ver. 4.0, SPSS Inc., Chicago, Ill.). Standard error bars are shown when the calculation is possible and the error is greater than the size of the symbol
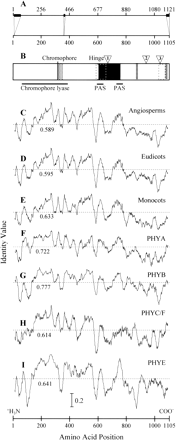
Fig. 6.—Sequence identity of phytochrome functional domains. A, The relationship between the numbering system for PHY amino acids used by Mathews, Lavin, and Sharrock (1995) and that used here (upper and lower scales, respectively). The three relatively large regions of sequence not included in the final alignments are indicated by black boxes along the sequence. B, A schematic of a prototypical PHY sequence and its putative functional domains. The chromophore attachment site and the hinge domain are labeled above the schematic. Triangles identify intron locations found in most angiosperm PHY genes. The chromophore lyase and PAS domains are shown below. Stippled box = PEST domain; dotted rectangles = dimerization domains; black box = signal transduction domain; horizontal-dash boxes = nuclear localization domains. C–I, Amino acid sequence identity along angiosperm PHY sequences, determined with a window of 30 residues. C, All angiosperm PHY sequences. D, All eudicotyledonous PHY sequences. E, All monocotyledonous (Poaceae) PHY sequences. F, All PHYA sequences. G, All PHYB sequences, including Arabidopsis thaliana PHYD. H, All PHYC sequences, including tomato PHYF. I, All PHYE sequences. Sequence identity values range from 0 to 1.0, with 1.0 representing complete identity. The mean sequence identity value for each group is shown (dashed line, with numerical value immediately below each line). The scale on the vertical axis is indicated by the scale bar in I.
We gratefully acknowledge Glenn Howe, Richard Meagher, and Robert Price for useful discussions during the preparation of this manuscript. We also thank Joanne Chory for providing the lambda-phage PHYC clone and Richard Meagher for providing the Arabidopsis actin template. This research was financially supported by a grant from the National Science Foundation (IBN-9630195).
literature cited
Arumuganathan, K., and E. D. Earle.
Borgstahl, G. E. O., D. R. Williams, and E. D. Getzoff.
Chaw, S. M., A. Zharkikh, H.-M. Sung, T.-C. Lau, and W.-H. Li.
Christensen, A. H., and P. H. Quail.
Clack, T., S. Mathews, and R. A. Sharrock.
Crews, S. T., J. B. Thomas, and C. S. Goodman.
Devereux, J.
Edgerton, M. D., and A. M. Jones.
Fankhauser, C., K.-C. Yeh, J. C. Lagarias, T. D. Elich, and J. Chory.
Felsenstein, J.
Hauser, B. A., M.-M. Cordonnier-Pratt, F. Daniel-Vedele, and L. H. Pratt.
Hauser, B. A., L. H. Pratt, and M.-M. Cordonnier-Pratt.
Howe, G. T., P. A. Bucciaglia, W. P. Hackett, G. R. Furnier, M.-M. Cordonnier-Pratt, and G. Gardner.
Huang, Z. J., I. Edery, and M. Rosbash.
Hughes, J. E., T. Lamparter, and F. Mittmann.
Hughes, J. E., T. Lamparter, F. Mittmann, and E. Hartmann.
Kehoe, D. M., and A. R. Grossman.
Kendrick, R. E., and G. H. M. Kronenberg.
Kolukisaoglu, H. Ü., S. Marx, C. Wiegmann, S. Hanelt, and H. A. W. Schneider-Poetsch.
Lagarias, D. M., S.-H. Wu, and J. C. Lagarias.
Lavin, M., E. Eshbaugh, J.-M. Hu, S. Mathews, and R. A. Sharrock.
Li, W.-H.
Li, W.-H., C.-I. Wu, and C.-C. Luo.
Lindebro, M. C., L. Poellinger, and M. L. Whitelaw.
Manabe, K., and M. Nakazawa.
Mathews, S., M. Lavin, and R. A. Sharrock.
Mathews, S., and R. A. Sharrock.
Pratt, L. H., M.-M. Cordonnier-Pratt, B. Hauser, and M. Caboche.
Pratt, L. H., M.-M. Cordonnier-Pratt, P. M. Kelmenson, G. I. Lazarova, T. Kubota, and R. M. Alba.
Sambrook, J., E. F. Fritsch, and T. Maniatis.
Schneider-Poetsch, H. A. W.
Sharrock, R. A., and P. H. Quail.
Spooner, D. M., G. J. Anderson, and R. K. Jansen.
Swofford, D. L.
Thümmler, F., M. Dufner, P. Kreisl, and P. Dittrich.
Vallejos, C. E., S. D. Tanksley, and R. Bernatzky.
Van Tuinen, A., M.-M. Cordonnier-Pratt, L. H. Pratt, R. Verkerk, P. Zabel, and M. Koornneef.
Wada, M., T. Kanegae, K. Nozue, and S. Fukuda.
Wagner, D., and P. H. Quail.
Wolfe, K. H., P. M. Sharp, and W.-H. Li.
Xu, Y., B. M. Parks, T. W. Short, and P. H. Quail.
Yeh, K.-C., S.-H. Wu, J. T. Murphy, and J. C. Lagarias.
