


Abstract
We present a detailed two-dimensional stellar dynamical analysis of a sample of 44 cosmological hydrodynamical simulations of individual central galaxies with stellar masses of 2 × 10¹⁰ M⊙ ≲ M* ≲ 6 × 10¹¹ M⊙. Kinematic maps of the stellar line-of-sight velocity, velocity dispersion and higher order Gauss–Hermite moments h3 and h4 are constructed for each central galaxy and for the most massive satellites. The amount of rotation is quantified using the λR-parameter. The velocity, velocity dispersion, h3 and h4 fields of the simulated galaxies show a diversity similar to observed kinematic maps of early-type galaxies in the ATLAS3D survey. This includes fast (regular), slow and misaligned rotation, hot spheroids with embedded cold disc components as well as galaxies with counter-rotating cores or central depressions in the velocity dispersion. We link the present-day kinematic properties to the individual cosmological formation histories of the galaxies. In general, major galaxy mergers have a significant influence on the rotation properties resulting in both a spin-down as well as a spin-up of the merger remnant. Lower mass galaxies with significant (≳18 per cent) in situ formation of stars since z ≈ 2, or with additional gas-rich major mergers – resulting in a spin-up – in their formation history, form elongated (ϵ ∼ 0.45) fast rotators (λR ∼ 0.46) with a clear anticorrelation of h3 and v/σ. An additional formation path for fast rotators includes gas-poor major mergers leading to a spin-up of the remnants (λR ∼ 0.43). This formation path does not result in anticorrelated h3 and v/σ. The formation histories of slow rotators can include late major mergers. If the merger is gas rich, the remnant typically is a less flattened slow rotator with a central dip in the velocity dispersion. If the merger is gas poor, the remnant is very elongated (ϵ ∼ 0.43) and slowly rotating (λR ∼ 0.11). The galaxies most consistent with the rare class of non-rotating round early-type galaxies grow by gas-poor minor mergers alone. In general, more massive galaxies have less in situ star formation since z ∼ 2, rotate slower and have older stellar populations. We discuss general implications for the formation of fast and slowly rotating galaxies as well as the weaknesses and strengths of the underlying models.
1 INTRODUCTION
Observationally, the ATLAS3D survey (Cappellari et al. 2011a) provides the most complete panoramic view on the properties of 260 local early-type galaxies in a volume-limited sample covering different environments within a distance of ∼42 Mpc. This includes a complete inventory of the central (Emsellem et al. 2011; Krajnović et al. 2011) and extended (Duc et al. 2011; Alatalo et al. 2013) baryonic galactic building blocks such as stars, molecular gas (Davis et al. 2011; Young et al. 2011), neutral gas (Serra et al. 2012) and ionized gas (Davis et al. 2011), as well as high-density gas tracers (Crocker et al. 2012). This is combined with unique two-dimensional information about the stellar (Emsellem et al. 2011; Krajnović et al. 2011) and gaseous (Davis et al. 2011) kinematics as well as photometry (Krajnović et al. 2011, 2013a,b) within the main body of the galaxies.
The theoretical effort within the survey is twofold. Based on the observed photometry and kinematics, we aim at understanding the underlying three-dimensional dynamical structure (Cappellari et al. 2012, 2013a,b; Lablanche et al. 2012) as well as the spatially resolved chemical composition and ages of the stellar populations (Kuntschner et al. 2013, in preparation; McDermid et al. 2013, in preparation; Scott et al. 2013). With an – backwards – archaeological approach, we can then put tentative constraints on the formation histories of early-type galaxies. Using semi-analytical models (Khochfar et al. 2011) and direct numerical simulations, we also investigate possible – forward – formation scenarios and check their success in predicting the observed present-day galaxy properties. The simulations cover different levels of complexity: idealized high-resolution simulations of mergers between two or more galaxies including (or not) star formation (Bois et al. 2010, 2011), simulations of model realizations of observed galaxies (Martig et al. 2013) and simulations of the entire formation history of galaxies in a full cosmological context as presented here.
One of the striking results from ATLAS3D, which is also the focus of this paper, is that only a small fraction (12 per cent, 32/260) of the galaxies rotate slowly with no indication of embedded disc components. In contrast, the majority (86 per cent, 224/260) of early-type galaxies shows significant (disc-like) rotation with regular velocity fields (Emsellem et al. 2011; Krajnović et al. 2011). Galaxies with corresponding properties were coined slow rotators and fast rotators, respectively, by the preceding SAURON survey (Bacon et al. 2001; de Zeeuw et al. 2002; Emsellem et al. 2004) based on the λR-parameter (λR ≳ 0.1: fast rotator, λR < 0.1: slow rotator), which gives an approximate measure of the specific angular momentum of galaxies from their two-dimensional line-of-sight velocity field (Emsellem et al. 2007). This definition was improved by ATLAS3D due to the larger sample size (Emsellem et al. 2011). Fast rotators dominate the low- and intermediate-mass field population (Cappellari et al. 2011b) and form a quite homogeneous family of flattened, oblate systems with regular velocity fields. Typical slow rotators dominate in high-density environments, are among the most massive and round galaxies, and have peculiar properties such as kinematic twists and kinematically decoupled components (Emsellem et al. 2011; Krajnović et al. 2011). The results from ATLAS3D demonstrate the power of two-dimensional integral field measurements which complements our understanding of the properties and the origins of early-type galaxies. A comprehensive summary of the current state, but without including integral field kinematics, can be found in Kormendy et al. (2009) and Kormendy & Bender (2012).
It is the aim of the present study to take the next step, include the observed two-dimensional kinematics and investigate how the wealth of kinematic features observed in nearby elliptical galaxies compares to high-resolution simulations of massive galaxies evolving in a full Λ cold dark matter (ΛCDM) context. We also investigate how the results compare to previous results which are mainly based on idealized major merger simulations. For this purpose, we present the first detailed two-dimensional kinematic analysis of a large sample of 44 individual zoom simulations of galaxies. To put our simulations in a proper theoretical context we first give a brief overview of the information on the formation and evolution scenarios from previously published studies (Section 2). In Section 3, we describe the numerical simulations of the galaxies which are used to construct the two-dimensional kinematic maps (Section 4). The detailed properties and the origin of the kinematic features are presented in Section 5 followed by a discussion of projection effects and satellite properties (Section 6). We then summarize and discuss our results in Section 7.
2 THE THEORETICAL CONTEXT
Interestingly, one of the first theories, even before the advent of modern hierarchical cosmologies, was motivated by what were then new measurements of the kinematics of stars in the outer halo of the Milky Way. The radial orbits of old, non-rotating, halo stars were explained by their rapid formation in collapsing protogalactic cold gas streams, followed by the formation of stars on circular orbits in a thin cold gas disc (Eggen, Lynden-Bell & Sandage 1962). If this simple formation scenario were similar for all old spheroidal systems, they would consist of a spherical bulge with stars on radial orbits and a rotating disc component whose relative mass would depend on the efficiency of star formation (i.e. gas consumption) during the collapse and on the ability of the gas to cool. The amount of turbulent viscosity, caused by large inhomogeneities in the infalling gas clouds, and the angular momentum of the infalling gas would then determine the predicted galaxy properties such as isophotal shapes, rotation, age and metallicity gradients, and even the formation of disc-like substructures in elliptical galaxies (Partridge & Peebles 1967; Larson 1969, 1974; Searle, Sargent & Bagnuolo 1973; Larson 1975). In the pre-merger-scenario and pre-ΛCDM model for the formation of slow and fast rotators, the bulk of the stars in slow rotators would form in rapidly collapsing gaseous systems with efficient star formation and efficient gas heating. Fast rotators would form in more settled systems with inefficient star formation in the absence of strong heating processes.
An alternative (or supplementary) scenario was provided by Toomre & Toomre (1972) and Toomre (1974, 1977) who investigated tidal interactions between disc galaxies and the possible formation of spheroidal systems by the morphological transformation of disc galaxies in major mergers, rare but spectacular events that can be observed to large distances. This scenario became particularly attractive as mergers play an important role during the formation and/or evolution of every dark matter halo and almost every massive galaxy in modern hierarchical cosmological models (White & Rees 1978; Khochfar & Silk 2006; De Lucia & Blaizot 2007). The first merger simulations triggered a whole industry of simulations of mergers of discs with discs or spheroids with spheroids. It is worth noting that a significant fraction of the theoretical understanding on the formation and evolution of early-type galaxies (kinematic features in particular, which is the basis for this study also) is largely based on results from idealized merger simulations and it is therefore necessary to briefly summarize the most important findings.
Early collisionless simulations of the evolution of already existing elliptical galaxies by mergers with other spheroids were mainly used to assess the evolution of abundance gradients, shapes and kinematics (White 1978, 1979a). Later investigations of spheroid mergers tested in more detail the evolution of scaling relations, also including the effect of different merger mass-ratios (Makino & Hut 1997; Nipoti, Londrillo & Ciotti 2003; Boylan-Kolchin, Ma & Quataert 2005, 2006, 2008; Naab, Khochfar & Burkert 2006b; Di Matteo et al. 2009; Nipoti, Treu & Bolton 2009a; Nipoti et al. 2009b, 2012; Hilz et al. 2012; Hilz, Naab & Ostriker 2013; Taranu, Dubinski & Yee 2013). These studies received particular attention since it became clear that major collisionless ‘dry’ stellar mergers actually happen in the Universe, i.e. they can be directly observed in significant numbers up to high redshifts (Tran et al. 2005; van Dokkum 2005; Bell et al. 2006a,b; Lotz et al. 2008; McIntosh et al. 2008; Jogee et al. 2009; Bluck et al. 2012; Man et al. 2012; Newman et al. 2012; Xu et al. 2012) in combination with the fact that the late mass assembly of massive galaxies by collisionless mergers is theoretically expected in hierarchical cosmological models (Kauffmann 1996; Kauffmann, Charlot & White 1996; Khochfar & Burkert 2003; De Lucia et al. 2006; Khochfar & Silk 2006; De Lucia & Blaizot 2007; Guo & White 2008; Kormendy et al. 2009; Hopkins et al. 2010). The terms collisionless or ‘dry’ are of course, an oversimplification as they imply the absence of gas in these system. In reality, gas is present in almost every galaxy but sometimes it can be considered dynamically unimportant (Donovan, Hibbard & van Gorkom 2007; Sánchez-Blázquez et al. 2009; Serra & Oosterloo 2010).
However, the difficulty of forming the observed family of slowly rotating early-type galaxies in major mergers of spheroids was pointed out early-on (White 1979b), a problem that has been confirmed with modern high-resolution simulations. In general, collisionless major mergers produce remnants that are either fast rotating – even if the progenitors did not rotate – or are intrinsically too flattened to be consistent with observed slow rotators (Di Matteo et al. 2009; Bois et al. 2010, 2011).
A separate process that was investigated using idealized merger simulations was the formation of elliptical galaxies by the morphological transformation of disc galaxies in major spiral galaxy mergers. The advantage of this idealized approach was the ability to study fundamental dynamical and gas-dynamical processes at high spatial resolution with well-controlled initial conditions. The first self-consistent disc merger simulations clearly demonstrated that major mergers can indeed transform kinematically cold discs into a kinematically hot spheroid with elliptical-like properties (Gerhard 1981; Farouki & Shapiro 1982; Negroponte & White 1983; Barnes 1988, 1992; Barnes & Hernquist 1992; Hernquist 1992, 1993; Heyl, Hernquist & Spergel 1994). Here, the mass-ratio has a significant impact on the remnant properties with remnants of more unequal-mass mergers showing faster rotation and being more flattened with more discy isophotes (Barnes 1998; Bekki 1998; Naab, Burkert & Hernquist 1999; Bendo & Barnes 2000; Naab & Burkert 2003; Bournaud, Combes & Jog 2004; Bournaud, Jog & Combes 2005, 2007; González-García & Balcells 2005; Jesseit, Naab & Burkert 2005; Naab & Trujillo 2006; Jesseit et al. 2009). Mergers also have a dramatic impact on the extended gas components in the progenitor discs. The gas is torqued, loses its angular momentum and is driven to the central regions. Therefore, mergers were early-on considered to trigger starbursts as observed in local interacting galaxies (Mihos & Hernquist 1994a, 1996; Barnes 2004; Di Matteo et al. 2007, 2008b; Karl et al. 2010; Teyssier, Chapon & Bournaud 2010) and eventually feed central supermassive black holes (Hernquist 1989; Di Matteo, Springel & Hernquist 2005; Springel, Di Matteo & Hernquist 2005; Johansson, Naab & Burkert 2009a; Younger et al. 2009). In addition, it was shown originally by Barnes & Hernquist (1996) that a dissipational component has a significant impact on the properties of the stellar remnant. In general, gas makes the centres of the remnants rounder, less boxy, more centrally concentrated with well studied and plausible effects on the star formation efficiencies and scaling relations (Mihos & Hernquist 1994b; Bekki & Shioya 1997; Springel 2000; Cox et al. 2006; Dekel & Cox 2006; Robertson et al. 2006a; Hopkins et al. 2008, 2009a,b,c; Johansson et al. 2009a; Debuhr et al. 2010; Moster et al. 2011). Inflowing gas also changes the shape of the central potential which determines the availability of orbital families for the stars (Barnes & Hernquist 1996; Jesseit et al. 2005; González-García, Balcells & Olshevsky 2006; Naab, Jesseit & Burkert 2006a; Hoffman et al. 2009, 2010). It was shown by Naab et al. (2006a) that the presence of a dissipational component changes the asymmetry of the observable line-of-sight velocity distributions towards steep leading wings in agreement with observed rotating early-type galaxies.
Bendo & Barnes (2000) presented the first two-dimensional analysis of line-of-sight velocity distributions of simulated disc mergers remnants for a direct comparison with observational results from integral field spectroscopy. For equal-mass merger remnants, they identified a variety of observed kinematic features such as counter-rotating cores and misaligned rotation. Unequal-mass merger remnants on the other hand showed relatively regular rotation. This was confirmed by the first quantitative studies by Jesseit, Naab & Burkert (2007); Jesseit et al. (2009) who compared the kinematic features of a sample of simulated remnants to results from the SAURON survey. Interestingly, depending only on the relative initial orientation of the progenitor discs, almost every observed kinematic peculiarity was found in one of the equal-mass merger remnants including major axis rotation, kinematic twists, dumbbell features (a feature in the stellar dispersion) and counter-rotating cores which have long been considered to originate from galaxy mergers (Balcells & Quinn 1990; Hernquist & Barnes 1991; Di Matteo et al. 2008a; Bois et al. 2010). From the studies of Jesseit et al. (2009), Bois et al. (2010) and Bois et al. (2011) it became clear that only major disc mergers – depending on the initial disc orientation – can form slow rotators which mostly have counter rotating cores. Still, the problem remains that most of the slow rotators formed in this way are too flat to be consistent with observed slowly rotating early-type galaxies. The kinematics of observed fast rotating early-type galaxies, on the other hand, seems to be in very good agreement with remnants of ‘minor’ disc mergers with varying mass-ratios (Jesseit et al. 2009; Bois et al. 2011).
Despite the apparently overwhelming successes of binary merger simulations in explaining photometric and kinematic properties of early-type galaxies, this approach comprises considerable limitations. Simulations of mergers of bulges only address aspects of early-type galaxy evolution and not their formation. Mergers of disc galaxies do form new spheroids but in general the stellar populations of present-day disc galaxies and their progenitors have too low masses and are too young and too metal poor to account for the bulk of the present-day massive early-type galaxy population (Naab & Ostriker 2009). Even more striking is the fact that assembly histories of massive galaxies in currently favoured hierarchical cosmological models are significantly more complex than a single binary merger. They grow – in particular at high redshift – by smooth accretion of gas, major mergers but also numerous minor mergers covering a large range of mass-ratios which can dominate the mass of assembled stars (De Lucia & Blaizot 2007; Genel et al. 2008; Feldmann et al. 2010; Oser et al. 2010; Feldmann, Carollo & Mayer 2011; Hirschmann et al. 2012). This conceptual difference is illustrated in Fig. 1, where we represent in the left-hand panel the idealized assembly history of a binary disc merger by an artificially constructed merger tree. At some redshift which is high enough so that the stellar population has enough time to age and become red a merger turns two ‘blue’ disc galaxies into a ‘red and dead’ elliptical. In the right-hand panel, we show the complete merger tree of a cosmological hydrodynamical zoom simulation (Oser et al. 2010) of a massive galaxy (see Hirschmann et al. 2012 for details on the construction of the tree). The differences are obvious.
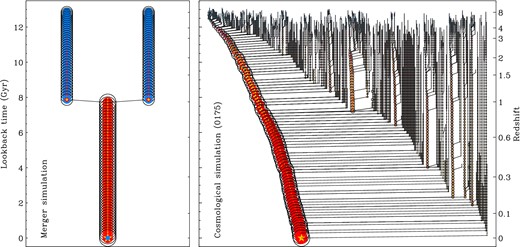
Left panel: Schematic ‘merger-tree’ representation of a binary disc merger simulation. Two gas-rich (blue) stellar (yellow) discs with little hot gas (red) merge at z ≈ 1 and form an elliptical galaxy. Right panel: merger tree from a cosmological zoom simulation of the formation of a halo (0175) and its galaxy within the concordance cosmology. The black circles indicate the dark matter halo mass at every redshift with the symbol size proportional to the square root of the normalized halo mass at z = 0. The yellow stars indicate stellar mass, the blue and red filled circles show the cold and hot gas mass within the virial radius (Hirschmann et al. 2012). It is evident that continuous infall of matter in small and large units is an important characteristic of the assembly of massive galaxies (see e.g. De Lucia & Blaizot 2007). The galaxy shown (0175) has no major merger since z ≈ 3. Others galaxies of similar mass can have up to three major mergers. The mass growth, however, is always accompanied by minor mergers (see Section 5).
The picture emerging from recent high-resolution cosmological zoom-in simulations on the formation of massive galaxies comprises characteristic features of both the ‘monolithic’ dissipative collapse models of the early 70's and the merger scenario of the 80's and 90's. Massive early-type galaxies appear to grow in two main phases. The early assembly (2 < z < 6) is dominated by significant gas inflows (Kereš et al. 2005; Dekel et al. 2009) and the in situ formation of stars whereas the late evolution is dominated by the assembly of stars which have formed in other galaxies and have then been accreted on to the system at lower redshifts (3 < z < 0) (Meza et al. 2003; Naab et al. 2007; Feldmann, Mayer & Carollo 2008; Naab, Johansson & Ostriker 2009; Feldmann et al. 2010; Oser et al. 2010; Feldmann, Carollo & Mayer 2011; Johansson, Naab & Ostriker 2012; Lackner et al. 2012). So far it has been demonstrated that properties of the spheroidal galaxies from cosmological simulations are in reasonable global agreement with observations of the cosmological evolution of scaling relations and present-day properties of early-type galaxies (Naab et al. 2007; Naab et al. 2009; Feldmann et al. 2011; Johansson et al. 2012; Oser et al. 2012). However, a more detailed kinematic analysis was presented only for a few fast rotating low-mass cases revealing e.g. the presence of discy isophotes and line-of-sight velocity distributions with steep leading wings (Meza et al. 2003; Naab et al. 2007). In this paper, we will close this gap and present a detailed two-dimensional analysis for a much larger galaxy sample also covering galaxies with significantly higher stellar masses.
3 HIGH-RESOLUTION COSMOLOGICAL SIMULATIONS OF INDIVIDUAL GALAXIES
The analysis presented in this paper is based on 44 ‘zoom-in’ cosmological hydrodynamic simulations of individual massive galaxy haloes selected from a sample presented in Oser et al. (2010, 2012). The haloes considered for re-simulation were chosen from a 5123 particle dark matter only simulation of a 1003 Mpc3 volume using a Wilkinson Microwave Anisotropy Probe 3 cosmology (Spergel et al. 2007): h = 0.72, Ωb = 0.044, Ωdm = 0.216, ΩΛ = 0.74, σ8 = 0.77, and an initial slope of the power spectrum of ns = 0.95. More details of the parent simulation are presented in Moster et al. (2010) and Oser et al. (2010, 2012), but we briefly review the simulation setup relevant for the galaxy re-simulations presented here. All particles that are inside a sphere with radius 2 × R200 centred on a halo of interest in any of our 95 snapshots were identified. We then selected a coherent convex volume in the initial conditions that contains all those particles and replaced them by high-resolution gas and dark matter particles including the relevant small-scale fluctuations. The original dark matter distribution at larger radii was down-sampled to provide the proper tidal field at a low computational cost. These initial conditions were then evolved from redshift z = 43 to z = 0 using the parallel treesph code gadget (Springel 2005) including star formation, supernova feedback (Springel & Hernquist 2003) and cooling for a primordial composition of hydrogen and helium. The simulations also include a redshift-dependent UV background radiation field with a modified Haardt & Madau (1996) spectrum.
Here, we consider a sample of massive haloes with masses in the range of 2.2 × 10¹¹ M⊙ ≲ Mvir ≲ 3.7 × 10¹³ M⊙. The haloes host massive galaxies with present-day stellar masses between 2.6 × 10¹⁰ M⊙ ≲ M* ≲ 5.7 × 10¹¹ M⊙ and projected half-mass radii of 1.2 < R1/2 < 6.6 kpc. The host haloes were randomly chosen to evenly cover the above halo mass range. It is therefore important to note that the simulated galaxies do not represent a statistically significant sample of the whole galaxy populations in this mass range. It is beyond the scope of this paper to address the galaxy properties as a population. We rather investigate the possible variations in individual formation histories and global trends with mass.
All galaxies are well resolved with ≈1.4 × 10⁴ − 2 × 10⁶ particles within the virial radius. The masses of individual gas and star particles are m*, gas = 4.2 × 10⁶ M⊙ (one star particle per gas particle is spawned), and the dark matter particles have a mass of mdm = 2.5 × 10⁷ M⊙. The comoving gravitational softening lengths are ϵgas, star = 400 pc h− 1 for gas and star particles and ϵhalo = 890 pc h− 1 for dark matter particles. This guarantees that the simulated half-mass radii of all galaxies presented here are well resolved (see e.g. Christensen et al. 2010).
In Table 1, we list some of the basic properties of the central galaxies that we find in these simulations. We use subfind (Springel et al. 2001) to identify the central galaxies and determine stellar masses and projected half-mass radii inside of 0.1 × R200. This cut-off may yield slightly lower radii than in observed galaxies of the same mass but it provides us with a well-defined fiducial value for galaxies that are spread over more than an order of magnitude in mass.
Global properties of central galaxies.
| ID | Mvir | M* | R1/2 | λR | ϵ | q | s | Mins/M* | λH | MWMR | NWMR | Class | |
|---|---|---|---|---|---|---|---|---|---|---|---|---|---|
| (1) | (2) | (3) | (4) | (5) | (6) | (7) | (8) | (9) | (10) | (11) | (12) | (13) | |
| M0040 | 3716 | 42.42 | 6.55 | 0.13 | 0.36 | 0.87 | 0.80 | 0.11 | 0.053 | 0.30 | 0.038 | D | |
| M0053 | 2327 | 56.89 | 6.36 | 0.093 | 0.44 | 0.87 | 0.74 | 0.19 | 0.013 | 0.11 | 0.020 | E | |
| M0069 | 2466 | 41.72 | 4.56 | 0.15 | 0.41 | 0.81 | 0.70 | 0.15 | 0.082 | 0.18 | 0.032 | E | |
| M0089 | 1478 | 38.97 | 4.65 | 0.074 | 0.44 | 0.80 | 0.70 | 0.09 | 0.023 | 0.19 | 0.042 | E | |
| M0094 | 1394 | 42.11 | 4.13 | 0.098 | 0.41 | 0.84 | 0.71 | 0.16 | 0.034 | 0.29 | 0.029 | E | |
| M0125 | 1273 | 38.23 | 5.40 | 0.078 | 0.27 | 0.85 | 0.83 | 0.12 | 0.035 | 0.11 | 0.021 | F | |
| M0162 | 875.1 | 28.13 | 4.32 | 0.074 | 0.53 | 0.71 | 0.62 | 0.081 | 0.039 | 0.59 | 0.072 | E | |
| M0163 | 956.3 | 27.90 | 4.86 | 0.31 | 0.44 | 0.80 | 0.72 | 0.098 | 0.028 | 0.22 | 0.046 | D | |
| M0175 | 970.2 | 32.57 | 4.28 | 0.058 | 0.31 | 0.89 | 0.79 | 0.14 | 0.043 | 0.076 | 0.020 | F | |
| M0190 | 709.3 | 27.74 | 4.09 | 0.083 | 0.56 | 0.70 | 0.59 | 0.093 | 0.045 | 0.41 | 0.072 | E | |
| M0204 | 746.5 | 23.57 | 3.61 | 0.100 | 0.23 | 0.94 | 0.84 | 0.12 | 0.046 | 0.25 | 0.056 | F | |
| M0209 | 826.4 | 18.54 | 2.49 | 0.14 | 0.40 | 0.92 | 0.72 | 0.17 | 0.079 | 0.17 | 0.038 | E | |
| M0215 | 701.0 | 24.79 | 3.31 | 0.14 | 0.28 | 0.91 | 0.79 | 0.16 | 0.028 | 0.11 | 0.027 | E | |
| M0224 | 663.8 | 21.40 | 3.01 | 0.16 | 0.35 | 0.95 | 0.75 | 0.14 | 0.040 | 0.26 | 0.053 | D | |
| M0227 | 707.0 | 26.61 | 4.07 | 0.24 | 0.33 | 0.88 | 0.76 | 0.10 | 0.057 | 0.31 | 0.047 | D | |
| M0259 | 606.5 | 17.93 | 2.81 | 0.40 | 0.40 | 0.99 | 0.70 | 0.15 | 0.045 | 0.34 | 0.049 | A | |
| M0290 | 581.7 | 19.78 | 2.05 | 0.48 | 0.30 | 0.97 | 0.75 | 0.19 | 0.036 | 0.22 | 0.062 | B | |
| M0300 | 507.3 | 17.01 | 2.72 | 0.19 | 0.50 | 0.90 | 0.64 | 0.12 | 0.069 | 0.21 | 0.056 | E | |
| M0329 | 486.5 | 19.70 | 2.96 | 0.071 | 0.34 | 0.90 | 0.79 | 0.16 | 0.033 | 0.10 | 0.026 | F | |
| M0380 | 455.8 | 15.72 | 2.61 | 0.46 | 0.42 | 0.84 | 0.68 | 0.17 | 0.038 | 0.021 | 0.014 | A | |
| M0408 | 350.8 | 16.36 | 2.13 | 0.37 | 0.38 | 0.98 | 0.73 | 0.20 | 0.047 | 0.22 | 0.063 | B | |
| M0443 | 371.7 | 21.30 | 1.95 | 0.088 | 0.32 | 0.91 | 0.77 | 0.24 | 0.027 | 0.20 | 0.035 | C | |
| M0501 | 319.4 | 13.70 | 2.46 | 0.075 | 0.38 | 0.87 | 0.72 | 0.16 | 0.051 | 0.11 | 0.030 | E | |
| M0549 | 300.1 | 10.13 | 2.53 | 0.46 | 0.35 | 0.93 | 0.71 | 0.17 | 0.056 | 0.074 | 0.032 | A | |
| M0616 | 262.9 | 12.13 | 2.95 | 0.077 | 0.40 | 0.84 | 0.75 | 0.16 | 0.040 | 0.11 | 0.044 | E | |
| M0664 | 249.1 | 9.58 | 2.03 | 0.14 | 0.30 | 0.87 | 0.78 | 0.17 | 0.012 | 0.13 | 0.043 | C | |
| M0721 | 204.7 | 12.69 | 1.64 | 0.40 | 0.50 | 0.97 | 0.71 | 0.38 | 0.043 | 0.24 | 0.075 | A | |
| M0763 | 208.0 | 11.77 | 2.34 | 0.32 | 0.34 | 0.91 | 0.74 | 0.099 | 0.066 | 0.39 | 0.13 | D | |
| M0858 | 193.1 | 13.48 | 1.94 | 0.52 | 0.51 | 0.90 | 0.65 | 0.32 | 0.024 | 0.29 | 0.15 | A | |
| M0908 | 173.1 | 12.90 | 1.96 | 0.44 | 0.44 | 0.98 | 0.70 | 0.38 | 0.013 | 0.41 | 0.20 | A | |
| M0948 | 167.9 | 7.77 | 2.83 | 0.088 | 0.19 | 0.94 | 0.88 | 0.12 | 0.014 | 0.099 | 0.045 | F | |
| M0959 | 166.6 | 7.79 | 2.13 | 0.091 | 0.25 | 0.83 | 0.81 | 0.18 | 0.040 | 0.15 | 0.043 | C | |
| M0977 | 131.0 | 5.63 | 1.93 | 0.35 | 0.53 | 0.91 | 0.66 | 0.37 | 0.085 | 0.24 | 0.095 | B | |
| M1017 | 147.1 | 8.49 | 1.68 | 0.084 | 0.43 | 0.86 | 0.71 | 0.29 | 0.017 | 0.10 | 0.046 | C | |
| M1071 | 146.9 | 10.09 | 1.69 | 0.14 | 0.20 | 0.95 | 0.85 | 0.21 | 0.008 | 0.19 | 0.081 | C | |
| M1167 | 129.1 | 9.38 | 1.59 | 0.062 | 0.40 | 0.84 | 0.69 | 0.26 | 0.027 | 0.36 | 0.14 | C | |
| M1192 | 108.3 | 5.53 | 1.87 | 0.50 | 0.52 | 0.75 | 0.58 | 0.20 | 0.038 | 0.17 | 0.086 | A | |
| M1196 | 132.4 | 10.27 | 2.04 | 0.45 | 0.49 | 0.97 | 0.69 | 0.33 | 0.048 | 0.20 | 0.056 | B | |
| M1306 | 108.8 | 8.53 | 1.35 | 0.59 | 0.39 | 0.96 | 0.65 | 0.28 | 0.024 | 0.16 | 0.075 | A | |
| M1646 | 99.01 | 7.20 | 1.86 | 0.28 | 0.52 | 0.99 | 0.68 | 0.35 | 0.015 | 0.092 | 0.034 | A | |
| M2665 | 53.90 | 4.18 | 1.57 | 0.098 | 0.26 | 0.89 | 0.83 | 0.29 | 0.028 | 0.21 | 0.11 | C | |
| M3852 | 42.33 | 3.49 | 1.21 | 0.57 | 0.42 | 0.96 | 0.63 | 0.29 | 0.092 | 0.35 | 0.13 | B | |
| M5014 | 32.46 | 3.00 | 1.22 | 0.51 | 0.46 | 0.98 | 0.67 | 0.38 | 0.069 | 0.36 | 0.41 | B | |
| M6782 | 21.97 | 2.55 | 1.21 | 0.55 | 0.54 | 0.84 | 0.52 | 0.27 | 0.077 | 0.85 | 0.48 | B |
Note. (1) ID of the galaxy. (2) Virial Mass in 1010 M⊙. (3) Stellar mass inside r10 in 1010 M⊙. (4) Projected half-mass radius kpc. (5) λR-parameter. (6) Projected ellipticity at R1/2. (7) Intermediate to major axis ratio. (8) Minor to major axis ratio (9). Ratio of in situ formed (since z = 2) to total stellar mass (at z = 0). (10) Halo spin parameter. (11) Mass-weighted merger ratio. (12) Number-weighted merger ratio. (13) Assembly class (see Section 5).
In order to investigate the assembly histories of the central galaxies, we identify every satellite inside 0.15 × R200 using a friends-of-friends (FOF) finder with a minimum number of 20 stellar particles (≈1.2 × 10⁸ M⊙, i.e. for all the galaxies in our sample we can identify mergers down to a mass-ratio of 1:5 for redshifts below 2) at which time we set the mass-ratio of the merger. As the point in time when the merger actually takes place, we use the first snapshot in which the most bound stellar particle of the satellite can be found in the same FOF group as the central galaxy. This allows us to compute an average number weighted merger ratio for all merger events between redshift of 2 and the present day (NWMR). Since all galaxies encounter many minor mergers which do not necessarily account for the majority of the final accreted mass, we also define the mass-weighted merger ratio (MWMR) where every merger ratio is weighted with the stellar mass of the accreted system.
The additional present-day parameters presented in Table 1 are the galaxy mass (M⋆) which we define as the stellar mass enclosed in 0.1 × R200, the edge-on projected half-mass radius R1/2, and the projected ellipticity at R1/2. Furthermore, we calculate the three-dimensional moment-of-inertia tensor for all particles inside R1/2 and determine the ratios of its principle axes (b/a, c/a). As a measure for the importance of dissipation in the formation of the galaxies, we present the ratio of stars that formed in situ to the total stellar mass at the present day (Mins/M⋆). Finally, we quantify the rotation of the halo with the dimensionless spin parameter λH as defined in Bullock et al. (2001).
4 CONSTRUCTION OF TWO-DIMENSIONAL KINEMATIC MAPS AND DATA ANALYSIS
Until now two-dimensional velocity fields from numerical galaxy simulations have only been constructed and analysed for remnants of binary merger simulations which provided the necessary resolution for a reliable analysis (Bendo & Barnes 2000; Jesseit et al. 2007, 2009; Hoffman et al. 2009, 2010; Bois et al. 2010, 2011). The high spatial and mass resolution of modern cosmological simulations of individual galaxies makes it now possible to extend the two-dimensional analysis to simulated galaxies that form and evolve in a full cosmological context.
The two-dimensional kinematic maps presented here are constructed in a similar way as described in Jesseit et al. (2007, 2009), with a few notable differences in order to follow as closely as possible the data analysis for the galaxies in the ATLAS3D sample. In a first step, we identify the main galaxy of each simulated halo and shift all positions and velocities to its baryonic centre using a shrinking sphere technique. The stellar component of the galaxy is rotated according to the principal axes of the moment-of-inertia tensor of the 50 per cent most tightly bound stellar particles. As a reference measure and for comparison with the directly observable stellar half-light radius, or effective radius re, we compute the edge-on projected (along the minor-axis) circular stellar half-mass radius, R1/2, within 10 per cent of the virial radius of the galaxy (Oser et al. 2012). For every projected stellar particle residing in a box of two half-mass radii side length, centred on the galaxy, we create a set of 60 pseudo-particles with identical line-of-sight velocities and 1/60th the original particle mass. The pseudo-particles are distributed in the plane of the sky following a two-dimensional Gaussian with a standard deviation of 0.3 kpc. In this way, we account for seeing effects on the projected mass and velocity distributions and the limited spatial resolution of the simulations.
All pseudo-particles are then binned on a spatial grid, centred on the projected particle position with four half-mass radii side length and a pixel size of 200pc. The grid has variable dimensions depending on the projected size of the galaxy. Our chosen pixel size approximately corresponds to the spatial coverage of one lens-let of the SAURON instrument (Bacon et al. 2001) at a distance of 20 Mpc. In contrast to simulations, real galaxies are observed with an instrument of fixed angular coverage and the spatial coverage varies between 0.5 and 3 effective radii depending on the physical size and distance of the galaxies (Cappellari et al. 2011a).
Using the regularly binned spatial data we group, whenever necessary, adjacent bins into larger bins with a comparable pre-defined signal-to-noise ratio using a Voronoi tessellation method as described in Cappellari & Copin (2003). This results in an irregular grid structure but guarantees that all bins contain approximately the same number of particles. From the velocity data, we construct line-of-sight velocity profiles for each Voronoi bin along the two-dimensional grid.
To get a quantitative measurement for the deviations of the line-of-sight velocity distribution (LOSVD) from the Gaussian shape the velocity profile P(v) can be parametrized in accordance with Gerhard (1993) and van der Marel & Franx (1993) by a Gaussian plus third- and fourth-order Gauss–Hermite functions (see Bender, Saglia & Gerhard 1994). The third- and fourth-order amplitudes h3 and h4 are related to the skewness and the kurtosis of the velocity profile but the skewness/kurtosis and h3/h4 are not identical. The skewness and kurtosis are the normalized third- and fourth-order moments of the LOSVD and are more susceptible to the wings of the line profile which are ill-constrained by the observations (see van der Marel & Franx 1993), here γ is a normalization constant. If the LOSVDs deviate from a Gaussian, the fit parameters vfit and σfit correspond only to first order to the real first (vlos) and second (σlos) moment of the velocity distribution (differences can be up to 15 per cent, see Bender et al. 1994; Magorrian & Binney 1994). For h3 = 0 and h4 = 0 the velocity profile is a Gaussian. The values of h3 and vfit have opposite signs for asymmetric profiles with the pro-grade (leading) wing being steeper than the retrograde (trailing) wing, which can be indicative of an embedded disc structure (van der Marel & Franx 1993; Bender et al. 1994; Fisher 1997; Krajnović et al. 2008). When vfit and h3 have the same sign, the leading wing is broad and the trailing wing is narrow. LOSVDs with h4 > 0 have a peaked shape, where the distribution's peak is narrow with broad wings. Flat-top LOSVDs have h4 < 0, where the peak is broad and the wings are narrow. The kinematic parameters of the LOSVD in each Voronoi bin (vfit, σfit, h3, h4) are determined from the discrete in a maximum likelihood as in van de Ven et al. (2006) which is particularly suitable for our purposes. The signal-to-noise value in the simulations is driven by the particle number and the numerical noise is significantly reduced by the pseudo-particle procedure. Whenever indicated, we repeat the above analysis for different projections of the galaxies on the plane of the sky.
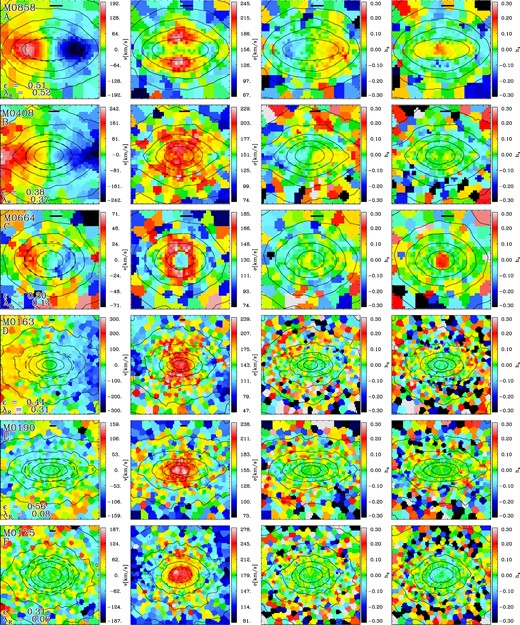
Two-dimensional maps of the stellar kinematics for edge-on projections of six simulated galaxies M0858, M0408, M0664, M0163, M0190 and M0175 (from top to bottom). These galaxies are representatives of galaxy classes (discussed in the text). A: fast rotators with central dissipation, B: dissipative fast rotators, C: dissipational slow rotators, D: dissipationless fast rotators, E: elongated dissipationless slow-rotators and F: dissipationless round slow rotators. The box length is three projected stellar half-mass radii (R1/2). The contour lines show the projected stellar mass surface density. The galaxy ID, the λR parameter, the ellipticity at R1/2 and the physical scale of 1 kpc (black bar) are given in the leftmost panels. The λR parameter is calculated within the effective elliptical radius (dotted line). From the left to the right, we show line-of-sight velocity (v), line-of-sight velocity dispersion (σ), a measure for the asymmetric (h3) and symmetric (h4) deviations from a Gaussian LOSVD shape. The maps of all simulated galaxies can be found in Appendix A.
5 LINKING ASSEMBLY HISTORIES TO PRESENT-DAY SHAPES AND KINEMATICS
We have grouped all central galaxies into six classes with distinct evolutionary paths which can be directly linked to their present-day shapes and kinematics. For this classification, we have used the two-dimensional kinematic maps – one typical example for each class is shown in Fig. 2 – in combination with the corresponding histories of mass assembly, specific angular momentum and galaxy mergers which are shown in Fig. 3. The fraction of the total stellar mass at z = 0 that formed in situ since z = 2 has emerged as a good measure for the importance of dissipation during the late assembly of the galaxies (Fig. 4). Galaxies with an in situ fraction higher than a fiducial value of 18 per cent show distinct kinematic features in the kinematic maps. In our simulations, the assembly of galaxies with lower in situ fractions is dominated by stellar mergers and dissipationless accretion events with clear signatures of these processes in their present-day properties consistent with the trend for the overall population seen in Khochfar et al. (2011). The radial profiles of the λR-parameter and the global values inside one effective radius (as shown in Figs 5 and 7) reveal details about the angular momentum distribution of the stars. In addition, we analyse for all galaxies the correlation between the individual pixel values of v/σ and h3 inside one effective radius, which is a measure of the local asymmetry in the line-of-sight velocity distribution (Fig. 9). In the following, we first present the global properties of these six classes (summarized for each galaxy in Table 1) followed by a more detailed analysis.
Class A: fast rotators with gas-rich minor mergers and gradual dissipation. These galaxies have late (z < 2) assembly histories which are dominated by minor – and occasionally early (z ≳ 1) major mergers (see the example galaxy M0858 in Fig. 3) and a significant amount (up to ∼40 per cent) of central in situ, dissipative, star formation (dark blue dots in Fig. 4). All these galaxies are regular fast rotators with 0.26 ≲ λR ≲ 0.6 and edge-on ellipticities 0.3 ≲ ϵ ≲ 0.55 (Fig. 7). They are special in showing peaked λR profiles (Fig. 5) resulting from fast rotating central disc-like stellar configurations. A typical example (M0858) is shown in the first row of Fig. 2. The line-of-sight velocity is enhanced towards the centre coinciding with a clear kinematic signature of a dynamically cold disc, i.e. a depression of the stellar line-of-sight velocity dispersion along the major axis. The enhanced dispersion above and below the disc plane results in a characteristic dumbbell feature which is typical for this class. This galaxy class also shows the most asymmetric line-of-sight velocity profiles with a clear anticorrelation (steep leading wings) of the local pixel values of v/σ and h3 (blue dots in Fig. 9). Additional members of this group are M0259, M0380, M0549, M0721, M0908, M1192, M1306 and M1646 (see section A for all kinematic maps).
Class B: fast rotators with late gas-rich major mergers. Similar to class A the assembly of galaxies in class B has involved significant in situ star formation with fractions ≳0.18 (light blue dots in Fig. 4). In general, these galaxies have experienced a late gas-rich major merger leading to a net spin-up of the merger remnant or leaving a previously rapidly rotating system unchanged (see e.g. M0408, second row of Fig. 3). The λR values and ellipticities (light blue dots in Fig. 7) are in the same range as those of class A but the λR profiles (light blue lines in Fig. 5) are constantly rising beyond re. Galaxies of class A and class B have the youngest mass-weighted stellar populations (∼9.5 Gyr) of the whole sample. Similar to class A, h3 and v/σ are anticorrelated (light blue dots in the left-hand panel of Fig. 9). All galaxies in this class have additional signatures, but not as strong as class A, of embedded stellar disc components including disc-like velocity fields, mid-plane depressions in the stellar velocity dispersions, and, occasionally, pointy isophotes. Additional members of this class are M0290, M0977, M1196, M3852, M5014 and M6782.
Class C: slow rotators with late gas-rich major mergers. This class contains all galaxies that have experienced a late gas-rich major merger leading to a spin-down of the stellar remnant or leaving the spin of a slowly rotating progenitor unchanged. A typical example is M0664 (third row of Fig. 2 and Fig. 3). Class C galaxies also have high in situ fractions (similar to classes A and B, green dots in Fig. 4) with typical central depressions in the stellar velocity dispersion. This feature originates from stars that have formed from gas driven to the centre of the galaxy during the merger, a process well studied in isolated binary mergers (Barnes & Hernquist 1996). The galaxies rotate slowly (green lines in Fig. 5) and are among the roundest in our sample with edge-on ellipticities of ϵ ∼ 0.3 (green dots in Fig. 7), again an effect of gas dissipation (Barnes & Hernquist 1996; Robertson et al. 2006a). Additional galaxies in this group are M0443, M0959, M1017, M1071, M1167 and M2665.
Class D: fast rotators with late gas-poor major mergers. All galaxies in this class have, in addition to minor mergers, experienced a recent collisionless major merger leading to a significant spin-up of the stellar remnant or leaving the properties of a previously fast rotating galaxy unchanged (0.1 ≲ λR ≲ 0.3). An example (M0163) is shown in the fourth row of Figs 2 and 3. In contrast to galaxies of class B, the late assembly and the merger did not involve significant amounts of gas resulting in a low global in situ fraction (yellow dots in Fig. 4). Despite their fast rotation, galaxies in this class show no additional signatures for embedded disc-like components and the LOSVDs do not have steep leading wings (no clear anticorrelation of vlos and h3 in the second panel of Fig. 9). This particular feature has been investigated in detail for binary mergers and is characteristic for fast rotating remnants of mergers without gas (Naab & Burkert 2001; Naab et al. 2006b, 2006a; Jesseit et al. 2007). Additional galaxies in this class are M0040, M0163, M0224, M0227 and M0763.
Class E: elongated slow rotators with late gas-poor major mergers. Galaxies in this class have, in addition to minor mergers, undergone at least one recent major merger which has led to a significant spin-down of the remnant or has only mildly changed the properties of a previously slowly rotating galaxy (e.g. M0190, fifth row in Figs 2 and 3). Their late assembly involved little dissipation (orange dots in Fig. 4) and all galaxies in this class are slowly rotating λR ≲ 0.19 with slowly rising λR-profiles (orange lines in Fig. 5). Ellipticities are significantly higher than for galaxies in class C (which have similar merger histories but more dissipation) with 0.3 ≲ ϵ ≲ 0.5 (orange dots in Fig. 7). The properties are consistent with results from binary collisionless major merger simulations with remnants that are slowly rotating but have a prolate shape and, occasionally, show strong kinematic twists (M0215) minor-axis rotation like M0190 (Hernquist 1992; Cox et al. 2006). Other galaxies in this class are M0053, M0069, M0089, M0162, M0215, M0300, M0501, M0616, M0094 and M0209. The only clear counter-rotating core in our sample is a galaxy of this class (M0094).
Class F: round slow rotators with gas-poor minor mergers only. The z ≲ 2 assembly history of these galaxies is dominated by stellar minor mergers without any major mergers (e.g. M0175, see bottom row of Fig. 3) and little in situ star formation (red dots in Fig. 4). Galaxies of this class have the lowest angular momentum λR ≲ 0.09 with almost featureless velocity fields (bottom row of Fig 2) and are among the roundest galaxies in our sample with ϵ ∼ 0.27 (red dots in Fig. 4). We find four more galaxies with similar properties in our sample (M0125, M0204, M0329 and M0984).
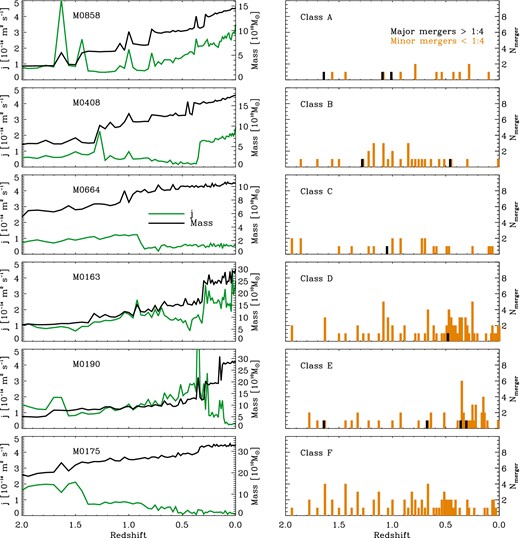
Left-hand panels: stellar mass assembly histories (black lines) and evolution of the specific angular momenta of the stellar components of the galaxies (green lines) M0858, M0408, M0664, M0163, M0190 and M0175, from top to bottom. Right-hand panels: Galaxy merger histories represented by the number Nmerger of major (black, mass-ratio ≥ 1:4) and minor (orange, mass-ratio < 1:4) stellar mergers, as a function of redshift for the same galaxies as in the respective left-hand panels. Most galaxies experience major mergers since z ≈ 2, only galaxies of class F grow by minor mergers alone (M0175, bottom panels, the halo merger tree of this galaxy is shown in Fig. 1).
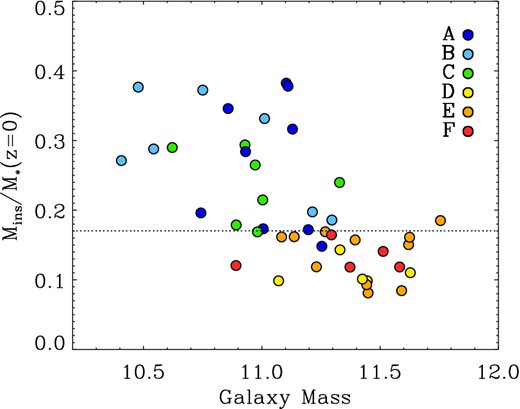
Fraction of stars formed in situ, Mins, since z = 2 to the total present-day stellar mass M*(z = 0) for all central galaxies sorted by their assembly classes. Galaxies with in situ fractions higher than a fiducial value of 18 per cent (horizontal dotted line) show distinct features of dissipative star formation in their present-day kinematic maps (classes A, B and C, see Fig. 2 and Figs A1–A8). The assembly of galaxies with lower in situ fractions (classes D, E and F) is dominated by accretion and merging of stellar systems. These systems are also more massive.
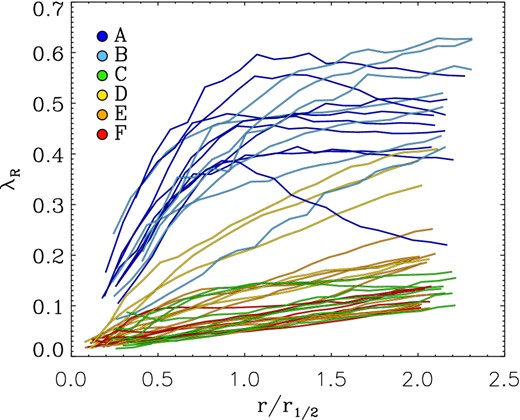
λR profiles for the simulated central galaxies up to two half-mass radii sorted by their assembly class. The profiles of class A (dark blue) peak at radii ≲ re with no further increase whereas class B profiles (light blue) continuously increase, similar to class D. The slow rotators (classes C: green, E: orange F: red) have flat or slowly rising profiles. The amplitudes of λR as well as the characteristic profile shapes are in agreement with observed early-type galaxies (Emsellem et al. 2004, 2011).
We have summarized the global properties of these classes in Table 2 and now present the detailed analysis on which this classification is based. In Fig. 2, we show characteristic examples of the two-dimensional maps for the line-of-sight velocity (v), line-of-sight velocity dispersion (σ), a measure for the asymmetric (h3) and symmetric (h4) deviations from a Gaussian LOSVD shape, within two R1/2 for one galaxy of each class described above (M0858, M0408, M0664, M0163, M0190 and M0175) from top to bottom, see Table 1 for individual galaxy properties. The kinematic maps for the central galaxies of the whole sample (including the galaxies shown here) are presented in Figs A1–A8 of Section A. For these maps rotation, kinematic substructure and higher order kinematic features are clearly visible, quantifiable and have similar amplitudes as in observed real galaxies.
Properties of galaxy classes.
| Class | M* | λR | λR-profile | ϵ | Mins/M* | 〈age〉 | Mergers | h3 – v/σ | Map-features | |
|---|---|---|---|---|---|---|---|---|---|---|
| (1) | (2) | (3) | (4) | (5) | (6) | (7) | (8) | (9) | ||
| A | 11 | 0.45 | Peaked | 0.45 | 0.27 | 9.7 | mj and mi | Strong | Dumbbell | |
| B | 8.7 | 0.47 | Rising | 0.45 | 0.29 | 9.3 | mj and mi | Strong | Discs | |
| C | 10 | 0.10 | Flat | 0.31 | 0.24 | 9.9 | mj and mi | No | Dispersion dip | |
| D | 26 | 0.23 | Rising | 0.36 | 0.11 | 10.6 | mj and mi | Very weak | Fast rotation | |
| E | 29 | 0.11 | Slowly rising | 0.43 | 0.14 | 10.7 | mj and mi | No | Slow rotation | |
| F | 24 | 0.08 | Flat | 0.27 | 0.13 | 10.9 | mi only | No | No rotation |
Note. (1) Assembly class as discussed in the text. (2) Mean stellar mass inside R10 in 1010 M⊙. (3) Mean value of λR. (4) Shape of the λR-profile. (5) Mean ellipticity. (6) Mean in situ mass fraction; dissipative assembly for galaxies with a fiducial value larger than 18 per cent. (7) Mean mass-weighted stellar age in Gyrs. (8) Mergers relevant for galaxy assembly; mj: major mergers, mi: minor mergers. (9) Strength of the anticorrelation between h3 and v/σ. (10) Special features in the kinematic maps.
M0858 (top row in Fig. 2) is an example of a fast rotator of class A. The velocity field shows peaked regular rotation of a disc-like component, also visible as a depression (dumbbell-feature) of the stellar velocity dispersion along the major axis. The LOSVDs along the major axis show steep leading wings with a clear signature of an anticorrelation between vlos and h3 and h4 is predominantly positive in the disc region. M0408 (second row in Fig. 2) is also a fast rotator (class B). In contrast to M0858 rotation here extends to larger radii and the depressions in the velocity dispersion are only evident at >re. This disc-feature is accompanied by pointy, discy, isophotes and anticorrelated h3. A galaxy with only weak rotation in the inner part is M0646 (class C) with a central depression in the velocity dispersion, no features in h3 and positive central values for h4. M0163 (class D) is classified as a fast rotator but does not show disc-like rotation similar to M0858 or M0408. The dispersion profile is peaked and there are no (weak) features in the h3 and h4 maps. A very elongated but non-disc-like and slowly rotating system is M0190 (class E) which also has a centrally peaked velocity dispersion and no features in h3 and h4. One of the roundest, most slowly rotating and most featureless galaxies in the sample is M0175 (class F, bottom row of Fig. 2).
In the left-hand panels of Fig. 3, we show the stellar mass assembly histories (black) and the evolution of the specific angular momentum of all stars within the effective radius (green) (which correlates well with λR, i.e. Jesseit et al. 2009) since z ∼ 2. Fluctuations in the values can be attributed to ongoing mergers and interactions. The corresponding stellar merger histories (black: major mergers with mass-ratios >1:4, orange: minor mergers with mass-ratios <1:4) are presented in the right-hand panels. Every merger is caused by an increase of stellar mass. This is most obvious for major mergers but also visible for minor mergers. However, the angular momentum can both decrease (M0664, M0190) or increase during a major merger (M0408, M0163). The most extreme examples are M0190 and M0408. For the former two major mergers at z ∼ 0.3 cancel all rotation in a previously rapidly rotating galaxy with a concurrent mass increase by a factor of ∼2.5. The latter is almost non-rotating before the merger at z ∼ 0.4 and spins up significantly. In some cases, the mass increase is not accompanied by mergers and originates from gas accretion and in situ star formation which in general is accompanied by an increase of the stellar angular momentum (e.g. M0858). For some massive galaxies, the mass assembly history is dominated by minor mergers. The example presented here is M0175 (bottom panels of Fig. 3). This galaxy has no major mergers and the mass increase by a factor of ∼1.8 since z ∼ 2 is solely driven by minor mergers continuously transforming a fast rotating galaxy into a slow rotator at the present day.
To estimate the amount of dissipation involved in the assembly of the stellar bodies of the galaxies, we identify the stellar mass formed in situ, Mins, in the galaxy since z ∼ 2 (see Oser et al. 2010). The fraction of this mass to the total present-day stellar mass M*(z = 0) for all central galaxies (coloured by their assembly class) versus the present-day stellar mass is shown in Fig. 4. In general, more massive galaxies have fewer in situ assembled stars (Oser et al. 2010) and for most galaxies of classes D, E and F this value is below a fiducial value of 18 per cent. Their assembly is dominated by accretion and merging of stellar systems. Galaxies of classes A, B and C typically have lower masses and have more stars formed in situ since z ∼ 2. They also show distinct features of dissipative disc-like star formation in their present-day kinematic maps (classes A, B and C, see Fig. 2 and Figs A1–A8). Wu et al. (2012) also find trends for a correlation of the stellar velocity anisotropy with the in situ fraction.
These features are also apparent in the variation of λR as a function of radius for the edge-on projections of all simulated central galaxies up to two projected half-mass radii (Fig. 5, see Wu et al. 2012 for an analysis of the outer kinematics). Galaxies of class A and B have steeply rising profiles with peaks inside of one re for class A. Galaxies of class C (green) have lost their angular momentum in a gas-rich merger and have slowly rising profiles, similar to slowly rotating galaxies with purely collisionless histories (classes E and F). The exception are galaxies of class D that have gained angular momentum in a recent major merger. The amplitude of λR as well as the characteristic profile shapes are in good qualitative agreement with observed early-type galaxies (Emsellem et al. 2004, 2011). Based on the same simulations Wu et al. (2012) find that the trends in λR extend to even larger radii.
The distribution of galaxies in the λR–M* plane in shown in Fig. 6 for the galaxies seen edge-on (projection effects are discussed in Section 6). Galaxies with the highest stellar masses are all slowly rotating and mostly belong to classes E and F. At lower stellar masses, the distribution is bi-modal with a group of galaxies with slow rotation λR ≲ 0.15 all belonging to group C and another group of galaxies (mostly from group A and B) showing rapid rotation λR ≳ 0.25. These results indicate that slow rotators at low stellar masses have predominantly formed from dissipative major mergers whereas at high stellar masses the recent assembly history was essentially collisionless. Similar conclusions have been reached by Khochfar et al. (2011) looking at the fast and slow rotator demographics in semi-analytical models.
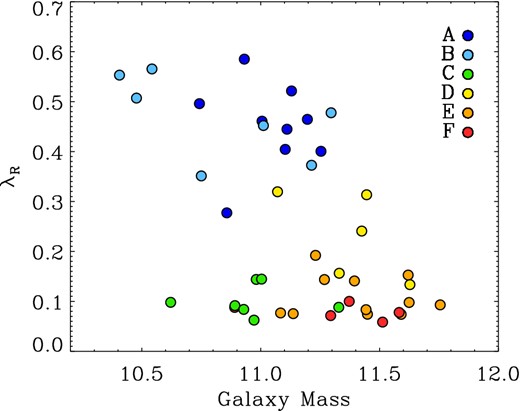
Global edge-on λR-parameter versus stellar galaxy mass. As in Fig. 4, the galaxies are colour coded by their assembly class. Galaxies involving dissipation in their late formation (class A, B and C) dominate lower masses. Galaxies with late dissipationless assembly (classes D, E and F) form the most massive systems with a lower specific angular momentum.
In Fig. 7, we show the location of the central galaxies in the λR–ϵ plane colour coded by their assembly classes. Here, the characteristic values of λR as well as ϵ have been determined at one effective radius. Galaxies with dissipative histories (classes A and B) are the fastest rotators with ellipticities 0.3 ≲ ϵ ≲ 0.58. Galaxies of class D have intermediate properties. The slowest rotators are classes C (gas-rich major merger), E (gas-poor major merger) and F (only minor mergers). The roundest (ϵ ∼ 0.27) and most slowly rotating (λR ∼ 0.08) galaxies are those of class F whose z < 2 mass assembly is dominated by minor mergers. Slow rotators with late gas-poor major mergers (class F) are the most flattened with ellipticities similar to fast rotators. Galaxies of this class are also the oldest at an average age of 10.9 Gyr. In Fig. 8, we show the mean age as a function of the in situ mass-fraction colour coded by assembly class. The overall correlation is almost by construction. Still, galaxies of classes D, E and F have consistently old ages (∼10.7 Gyr) whereas the age spread for classes A, B and C is significant (8.2 Gyr ≲ age ≲ 11.0 Gyr).
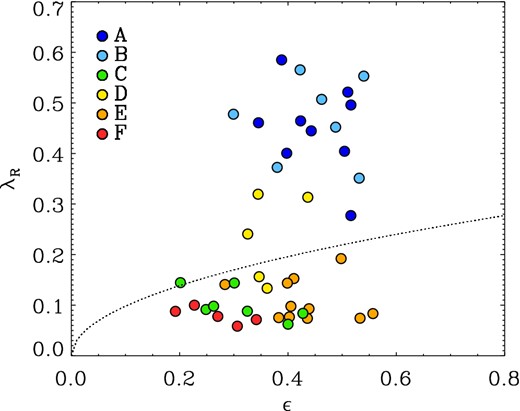
The λR-parameter versus projected edge-on ellipticities at re. As in Fig. 4, the galaxies are colour coded by their assembly class. Galaxies of class A and B (blue colours) are all elongated fast rotators. Galaxies of class D are rounder and rotate more slowly. The most elongated slow rotators are class E galaxies (orange). Galaxies of class C (green) show similarly low rotation but are rounder. The slowest rotators and roundest galaxies are those of class F (red), whose assembly history is dominated by minor mergers alone.
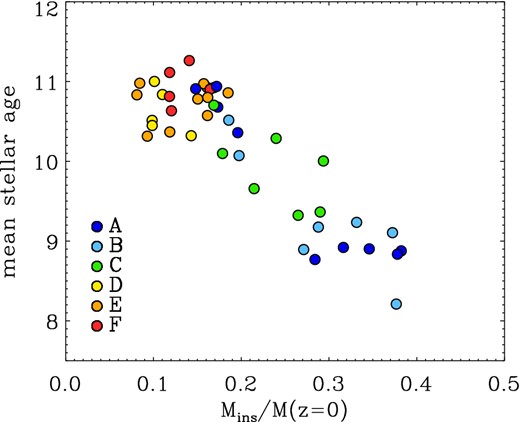
Mass-weighted stellar ages of the central galaxies versus the fraction of stars formed in situ, Mins, since z = 2. Galaxies of assembly classes D, E, and F with predominantly dissipationless recent assembly histories (see Fig. 4) are consistently old (∼10.7 Gyr). As expected galaxies of classes A, B, and C (whose late assembly involves more dissipation, see Fig. 4) in general are younger and show a larger spread in age (some have ages similar to classes D, E, and F, some are as young as ∼8.5 Gyr).
In addition, we present for all galaxies the correlation between the individual pixel values of v/σ and h3 as well as h4 inside one effective radius (Fig. 9). A strong anticorrelation of h3 and v/σ indicates line-of-sight velocity distributions with steep leading wings indicative of a rotating axisymmetric stellar body and, eventually, a stellar disc (see e.g. Bender et al. 1994). A positive (negative) value for h4 indicates a velocity distribution that is more (less) peaked than a Gaussian. We present the correlations for three galaxy groups separately. Galaxies of assembly class A and B show a similarly strong anticorrelation of v/σ and h3. These galaxies are also fast rotators and with respect to the anticorrelation, the absolute values of h3, and v/σ they are reminiscent of observed properties of regular rotators (Bender et al. 1994; Krajnović et al. 2008; and see fig. 9 in Krajnović et al. 2011). Galaxies of group D are also fast rotating but do not show a clear anticorrelation. This can be understood in terms of their formation history. Their fast rotation was caused by a recent gas-poor major merger which has been shown to have the ability to spin up galaxies (Di Matteo et al. 2009; Bois et al. 2011). However, due to the absence of a dissipative gas component during the merger, the remnant galaxies are typically not axisymmetric and neither support the population of stars on high angular momentum tube orbits nor the re-growth of a significant disc component. This explains the absence of a strong anticorrelation (Barnes & Hernquist 1996; Bendo & Barnes 2000; Naab & Burkert 2001; Naab et al. 2006a; Jesseit et al. 2007; Hoffman et al. 2009, 2010). All slow rotators (classes C, E and F) show no correlation with h3 in agreement with long-slit and integral-field observations (Bender et al. 1994; Krajnović et al. 2008, 2011).
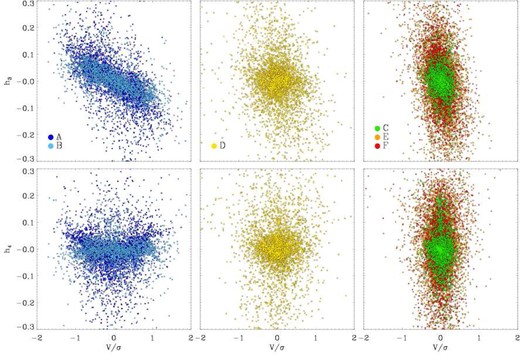
Local pixel values within re of h3 (upper panels) and h4 (lower panels) versus v/σ for all galaxies of assembly classes A and B (left-hand panels), class D (middle panels, and classes E, C and F (right-hand panels). Maps of fast rotating class A/B galaxies clearly show an anticorrelation indicating steep leading wings in the local line-of-sight velocity distributions caused by axisymmetry and/or the presence of a disc-like component. The amplitude of h4 is low and class A shows a V-shaped structure. Galaxies of class D can also be rotation dominated but show no correlation between h3 and v/σ – a signature of the recent gas poor major merger. Galaxies of classes E, C and F rotate slowly and show no correlations. The amplitude of h4 is in general higher than for classes A, B and C. These results are in good qualitative agreement with observed early-type galaxies (Krajnović et al. 2011).
6 PROJECTION EFFECTS AND SATELLITE PROPERTIES
So far we have only studied edge-on projections of the simulated central galaxies. However, both the λR parameter as well as the ellipticity ϵ change with varying viewing angles, i.e. edge-on galaxies with fast rotation and high ellipticities typically show a decrease in λR as well as ϵ as they are projected more face-on (Jesseit et al. 2009; Bois et al. 2010, 2011; Emsellem et al. 2011).
For an interpretation of projection effects, we consider the underlying three-dimensional shape of the galaxies. We compute the intrinsic shape of the central stellar component (50 per cent most tightly bound particles) from the principal axes of the moment of inertia tensor [(a) long axis, (b) intermediate axis, (c) short axis]. Fast rotating galaxies are significantly flattened (c/a < b/a) and nearly oblate with b/a ≳ 0.8 (Fig. 10). With a mean flattening c/a = q ∼ 0.6, the simulated fast rotators are significantly rounder than the inferred mean intrinsic shape of fast rotators in the ATLAS3D survey of q = 0.25 (Weijmans et al. 2013, submitted). Simulated slow rotators are significantly more round (q ∼ 0.75), but still triaxial (c/a ≲ b/a), when compared to their fast rotating counterparts. Again, the simulated galaxies are on average rounder than the observed (q ∼ 0.63). It is plausible to assume that the shape difference between model galaxies and observations originate from the assumed model for star formation. The employed model favours early conversion of gas into stars and therefore the formation of bulges. The observed disc-like properties, in this case the flattened shape, of most local early-type galaxies cannot be recovered accurately.
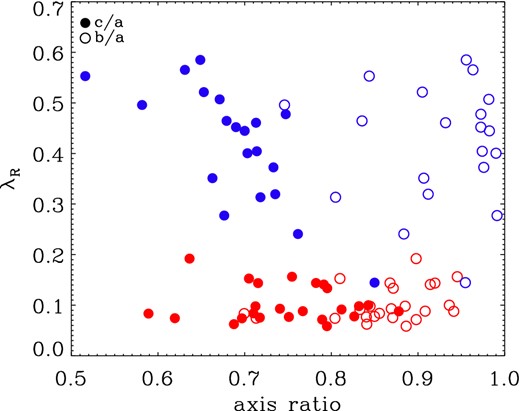
The λR-parameter versus the intrinsic shape of the inner region (50 per cent most tightly bound stars) of the simulated central galaxies. Here, c/a (filled circles) is the ratio of the short to the long axis and b/a (open circles) is the ratio of the intermediate to the long axis. Fast rotators (blue) are significantly flattened (c/a < b/a) and nearly oblate with b/a ≳ 0.8, whereas slow rotators (blue) tend to be more round or slightly triaxial (c/a ≲ b/a).
The difference in intrinsic shape is also reflected in the distribution of λR and the ellipticities, ϵ, for random projections. In the left-hand panel of Fig. 11 , we show the ‘observable’ projected ellipticities at the half-mass radius, R1/2, for projections along the intermediate axis (edge-on, filled circles), the long axis (open diamonds) and along the short axis (face-on, open circles) versus the corresponding λR-parameter. All points are colour coded according to their edge-on rotation properties. Galaxies above an empirical division line (dotted line in Fig. 11, Emsellem et al. 2011) are fast rotators (blue) and those below are slow rotators (red). The magenta solid line (Cappellari et al. 2007) shows the edge-on view integrated up to one effective radius for spheroids with an intrinsic anisotropy, β = 0.65 × ϵ, which (including projection effects) encompasses most observed fast rotating spheroids. The edge-on projections cover ‘observable’ ellipticities in the range 0.16 < ϵ < 0.58 and slow rotators on average have lower ellipticities than fast rotators (this corresponds to the slightly higher values of c/a in Fig. 10). As soon as the galaxies are projected along the long axis (blue open diamonds), the ellipticity and λR of the fast rotators, which are typically close to oblate, do not change much. In projection along the short axis (face-on, blue open circles), most fast rotators appear round with very low apparent angular momentum, as expected. For the slow rotators, the situation is slightly different. They are in general less axisymmetric and seen along the long axis (red open diamonds) the ellipticity already drops significantly to values around ϵ ∼ 0.2 whereas the low values for λR remain unchanged. The apparent ellipticities are even more reduced when ‘observed’ along the short axis (open red circles). In some cases, however, the ellipticity is even larger than in the projection along the long axis (i.e. red open circles are at higher ellipticities than red open diamonds).
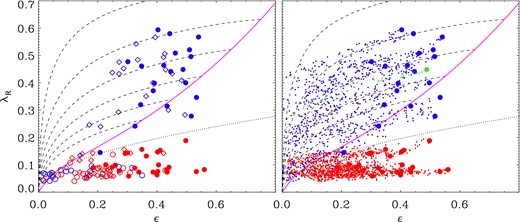
Left: the λR parameter for fast rotators (blue) and slow rotators (red) as defined from the edge-on projection (seen along the intermediate axis) versus projected ellipticities of the simulated early-type galaxies. The black dotted division line between fast and slow rotators is based on the empirical relation presented in Emsellem et al. (2011). Filled dots indicate the edge-on projections, diamonds show the projections along the long axis and open circles are face-on projections along the short axis. The magenta solid line (Cappellari et al. 2007) shows the edge-on view integrated up to one effective radius for spheroids with an intrinsic anisotropy, β = 0.65 × ϵ, which (including projection effects) encompasses most observed fast rotating spheroids. The black dashed lines indicate the effect of projection from edge-on to face-on for ellipticities ϵ = 0.82, 0.75, 0.65, 0.55, 0.45 and 0.35 from top to bottom. Most of our simulated fast rotators cover the same region. Right: similar to the left-hand panel but for 50 random projections of fast (blue) and slow (red) rotators. Oblate fast rotators project towards lower ellipticities in agreement with the analytic expectations (black dashed lines). The effect of projection in this plane is highlighted for one fast rotator (green dots). Slow rotators (red dots) do not change their rotation properties and just project towards rounder shapes.
In the right-hand panel of Fig. 11, we again show the location of the edge-on projection of the galaxies (solid circles) in combination with 50 random projections (small dots). As expected the projections populate the regions with lower ellipticities and lower values of λR. For the fast rotators (blue), the projections follow the theoretical predictions for oblate systems with edge-on projections starting on the magenta line (black dashed lines). The fact that λR never drops below a value of ∼0.05 is artificial and caused by the particle noise in the simulations. For projections with low apparent (or real) rotation adjacent Voronoi cells might have velocities that fluctuate around zero. As λR is a cumulative parameter of absolute values (bins with slightly negative as well as positive velocities contribute) of all these velocities will be added up creating a lower limit. If the galaxies are randomly projected (small dots), the fast rotators appear rounder with a mild decrease in λR followed by a rapid drop when the ellipticities approach zero. Projected slow rotators do not change their rotation properties significantly but have lower apparent ellipticities. The location of projected galaxies is in good agreement with predictions from isolated binary merger simulations (Jesseit et al. 2009; Bois et al. 2011).
Many of the central galaxies in our simulations have massive satellite galaxies. We have identified all satellite galaxies with masses above 1010 M⊙ and constructed their two-dimensional maps in the same way as for the central galaxies. In Appendix B, we have collected the maps of all galaxies sorted by their host galaxies IDs. In the left-hand panel of Fig. 12, we show the distribution of λR as a function of galaxy stellar mass for the central galaxies (solid circles) as well as the satellite galaxies (open circles) colour coded by their rotation properties. All satellite galaxies have masses below 1010.8 M⊙ and most of them are fast rotators and cover the same parameter space as the fast rotating central galaxies (see also Khochfar et al. 2011). Only three of the satellite galaxies are slow rotators. On the right-hand panel, we show the λR-ϵ plane but now including the satellite galaxies. In general, the trend for more massive galaxies (now including the satellites) to rotate slower is in qualitative agreement with the observed ATLAS3D galaxies (see Emsellem et al. 2011, Fig. 3).
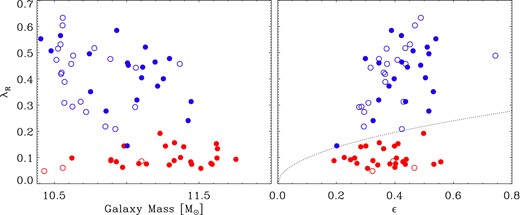
Left: the λR parameter measured in the edge-on projection for fast (blue) and slow rotators (red) versus the stellar mass of the simulated central galaxies (filled circles) and satellite galaxies (open circles). Massive galaxies tend to be slow rotators. Less massive galaxies can be slow as well as fast rotators with fast rotators dominating the lower masses. Satellite galaxies (open circles) follow a similar trend but are mainly fast rotators of lower mass. This is in qualitative agreement with ATLAS3D galaxies (Emsellem et al. 2011). Right: the λR-parameter versus the projected ellipticities of the simulated central galaxies and satellites (symbols as in the left-hand figure). The black dotted division line between fast and slow rotators is based on the empirical relation presented in Emsellem et al. (2011). Satellite galaxies (open circles) follow the same trends as centrals.
7 SUMMARY AND DISCUSSION
In this paper, we present the first detailed two-dimensional kinematic analysis of a sample of 44 cosmological zoom simulations of massive galaxies. We investigate central galaxies in haloes of 2.2 × 10¹¹ M⊙–3.7 × 10¹³ M⊙ with stellar masses from 2.6 × 10¹⁰ M⊙–5.7 × 10¹¹ M⊙ and their most massive satellites with a lower stellar mass limit of ×1010 M⊙. For every galaxy, we construct two-dimensional maps of the stellar line-of-sight velocity, velocity dispersion and higher order Gauss–Hermite moments h3 and h4 (Gerhard 1993; van der Marel & Franx 1993) of the line-of-sight velocity distribution. The analysis procedure is similar to the one used for the integral field spectroscopic surveys SAURON and ATLAS3D (de Zeeuw et al. 2002; Cappellari et al. 2011a).
The kinematic properties of the simulated galaxies – represented by the two-dimensional velocity and dispersion fields – are in good qualitative agreement with the kinematics of observed nearby elliptical galaxies in the ATLAS3D survey. We find a similar wealth of peculiar kinematic features as for observed galaxies such as counter-rotating cores (M0094), slow rotation (M0125), kinematic twists (M0215), minor axis rotation (M0190), dips in the central velocity dispersion (M0224), misaligned rotation (M0224), dumbbell features (M0858), enhanced dispersion along the major axis (2σ feature, M0209) and regular disc-like rotation (M0408). The kinematic maps for all galaxies and the most massive satellites can be found in Appendices A and B.
The global rotation properties are quantified with the λR-parameter. Some galaxies rotate slowly, some have significant rotation with disc-like velocity fields covering almost the full range of the observed λR values within the effective (projected half-mass) radius of the galaxies (0.05 < λR < 0.6), except for the fastest rotators, which do not form in the simulations presented here. However, the observed general trend for more massive galaxies to rotate more slowly is apparent in the simulation sample. The importance of this process for the present day early-type galaxy population is not entirely clear. But empirical evidence indeed suggests a continuity between the properties of spirals and fast rotator ETGs on scaling relations (Cappellari et al. 2013b).
A detailed analysis of the cosmological assembly (since z ∼ 2) of every individual galaxy enabled us to link the formation histories of fast and slow rotators directly to specific features which show up in the present-day two-dimensional kinematic maps. The massive galaxies in our sample can experience a larger number of mergers (up to 150 down to a mass-ratio of 1:100) and therefore a significant fraction (30 to 50 per cent) of the stars finally residing in these galaxies has been accreted and did not form inside the galaxies (Oser et al. 2010, 2012; Hirschmann et al. 2012). We find that the most prominent formation features characterizing the final rotation properties are the presence of late major mergers and the stellar in situ fraction, i.e. the ratio of stars that have formed in the galaxy (from the accreted dissipative gas component) to the total amount of stellar mass growth since z ∼ 2 (other stars have been accreted in mergers). All galaxies in our sample experience minor mergers, in particular the massive ones, but major mergers (although rare) have (in most cases) a more dramatic effect on the rotation properties. The effect of major mergers has been extensively investigated in the past with idealized simulations and the results of these studies are summarized in Section 2.
In a cosmological context, the formation histories of massive galaxies are more complex and there are no two unique formation histories for fast rotators and slow rotators, respectively. In fact we have to consider several factors like merger mass-ratio, the timing of major mergers and gas fraction to uncover the different formation paths and their present-day kinematic imprints. We have identified the following characteristic formation histories resulting in the formation of fast rotators.
Galaxies with gradual dissipation, a significant amount of stars formed in situ (up to ∼40 per cent), and some late minor mergers but no major mergers since z ∼ 1 (class A). All these galaxies show a peak in the λR-profile inside one re (a clear kinematic signature of dynamically cold discs), pointy isophotes, a depression of the stellar line-of-sight velocity dispersion along the major axis and characteristic dumbbell features. These fast rotators also have clearly asymmetric line-of-sight velocity profiles (steep leading wings) with anticorrelated v/σ and h3.
Galaxies with a late gas-rich major merger leading to a net spin-up of the merger remnant or leaving a previously high-spin galaxy unchanged (class B). These galaxies have constantly rising λR-profiles beyond re most likely caused by the efficient angular momentum transfer during the major merger (e.g. Barnes & Hernquist 1992). They also have disc-like velocity fields, mid-plane depressions in the velocity dispersion, anticorrelated h3 and v/σ, and, occasionally, pointy isophotes. This is generally consistent with studies of isolated binary disc mergers (see Section 2) indicating that under certain circumstances (e.g. proper orientation of progenitor discs with high gas fractions, re-accretion of tidally stripped gas, strong feedback from star formation or gas accretion on to black holes, cooling from a hot, gaseous halo) even major merger remnants can have disc-like properties (Barnes 2002; Robertson et al. 2004; Springel & Hernquist 2005; Robertson et al. 2006b; Moster et al. 2011).
Galaxies with one (or more) late (z ≲ 1) dissipationless (stellar) major mergers (in situ fraction ≲ 0.17) leading to a significant spin-up of the stellar remnant or leaving the properties of a previously fast rotating galaxy unchanged (class D). These galaxies show moderate rotation (〈λR〉 ∼ 0.23) but no additional signatures for embedded disc-like components and vlos and h3 are not anticorrelated. The absence of this anticorrelation is a generic feature of rotating collisionless galaxy merger remnants (Naab & Burkert 2001; Naab et al. 2006a) and the potential spin-up in major galaxy mergers has been studied in detail with idealized experiments with qualitatively similar results (Naab et al. 2006b; Di Matteo et al. 2009; Bois et al. 2010, 2011).
We also identify three different formation paths for slow rotators.
Galaxies with late (z ≲ 1) gas-rich major mergers leading to a net spin-down of the progenitor galaxies (class C). These galaxies have high fractions of in situ formed stars (∼ 0.24), rotate slowly (〈λR〉 ∼ 0.1) and show characteristic central dips in the stellar velocity dispersion. In the idealized picture, slowly rotating binary merger remnants of (gas-rich) disc galaxies have very similar properties to the galaxies in this class. Mergers like this have been traditionally considered (together with their collisionless counterparts, see below) as the origin of slow rotators (Barnes & Hernquist 1996; Cox et al. 2006; Naab et al. 2006a; Jesseit et al. 2007, 2009; Hoffman et al. 2009, 2010; Bois et al. 2010, 2011).
Galaxies that have undergone at least one recent gas-poor (collisionless, dry) major merger (in addition to minor mergers), which has led to a significant spin-down of the remnant or has only mildly changed the properties of a previously slowly rotating galaxy (class E). Despite their slow rotation (〈λR〉 ∼ 0.1, with slowly rising λR profiles at larger radii), the high ellipticities (〈ϵ〉 ∼ 0.43) potentially cause tension with observations. Similar idealized mergers have also been considered to form slowly rotating spheroids (Barnes 1992; Hernquist 1992; Naab et al. 2006b), but the potential tension with observed galaxies was realized early-on (Naab & Burkert 2003; Cox et al. 2006).
Galaxies for which the z ≲ 2 mass assembly histories are dominated by stellar minor mergers without any major mergers (class F). These galaxies are old (〈age〉 ∼ 10.9 Gyrs), have low in situ fractions (∼0.13) and are the roundest (〈ϵ〉 ∼ 0.27) and slowest (〈λR〉 ∼ 0.08) rotators in our sample with flat λR profiles and almost featureless velocity fields. They have continuously lost angular momentum since high redshift caused by repeated minor mergers, an interpretation that is supported by idealized minor merger simulations (Bournaud et al. 2007; Qu et al. 2010). Repeated minor mergers are also a natural explanation for a rapid increase in size, Sersic index and dark matter fraction (Hilz et al. 2012, 2013).
The above formation histories can be considered generic and are drawn from simulations in a full cosmological context. They clearly provide more complex scenarios and a more complete picture than previous studies based on idealized merger simulations. We have demonstrated that it is possible to connect cosmological galaxy assembly histories to the formation of fast and slow rotators with characteristic observable higher order kinematic features. Even though we consider the formation paths as generic, we cannot yet assess their full statistical significance. The host haloes (in which the simulated galaxies live) were chosen to evenly cover an initially specified mass range and the simulated sample is not large enough to represent the whole galaxy population in this mass range. We address population properties in the context of ATLAS3D using semi-analytical models in Khochfar et al. (2011). In particular, the sample is not large enough to finally interpret the observations of volume-limited surveys like ATLAS3D or upcoming larger surveys and it is beyond the scope of this paper to address galaxy population properties. We rather investigate the possible variations in individual formation histories, their impact on the kinematic features and global trends with mass. The results of the present study are in good agreement with a semi-analytical analysis presented in Khochfar et al. (2011). In particular, the role of dissipation and the complex formation histories proposed in the semi-analytical analysis are confirmed by the present study.
In addition to the successes of the models presented here, we would like to draw the attention to the model limitations. The simulated halo sample was randomly selected from a larger cosmological box and is inherently different to the volume-limited sample of observed galaxies. This is a potential source of systematic error. All cosmological simulations of galaxy formation either only include a subset of the relevant physical processes or make simplified assumptions about the unresolved physics of star formation, black hole formation and the respective feedback, background radiation, cooling etc. Therefore, the emerging results are inevitably, to some degree, model dependent and require careful interpretation. We would like to use this discussion to give the necessary critical review of our results.
As detailed in Section 3, our simulations use an algorithm for star formation which, by construction, favours the early formation of stars in small subunits and we form no bona fide late-type galaxies in our sample. Feedback from supernovae is included, but does not drive strong winds. Other studies with similar simulation parameters typically find simulated galaxies with photometric and kinematic properties similar to present-day early-type galaxies (Naab et al. 2007; Johansson, Naab & Ostriker 2009b; Naab et al. 2009; Feldmann et al. 2010; Johansson et al. 2012). The properties of the stellar components of the galaxies presented here agree with present-day early-type galaxy scaling relations of mass with radius and stellar velocity dispersion (Oser et al. 2012). In addition, they have close to isothermal total mass distributions (Lyskova et al. 2012; Remus et al. 2013), similar to observed early-type galaxies (e.g. Barnabè et al. 2011), and their observed size evolution between z ∼ 2 and z = 0 is in agreement with recent observational estimates (Lyskova et al. 2012; Oser et al. 2012). However, as the employed star formation model favours efficient star formation at high redshift, we preferentially form spheroidal systems with predominantly old stellar populations. There is growing theoretical and observational evidence that the suppression of early star formation by strong feedback processes (which are not included in the present study) leads to more realistic formation paths for disc-like galaxies at low as well as high redshift (e.g. Genel et al. 2012; Haas et al. 2013a,b; Anglés-Alcázar et al. 2013; Aumer et al. 2013; Kannan et al. 2013; Stinson et al. 2013). The importance of this process for the present-day early-type galaxy population is not entirely clear. Feedback can promote the formation of a population of highly flattened galaxies with very fast rotation (Aumer et al. 2013, Marinacci, Pakmor & Springel 2013). However, for these galaxies to become early-type they have to stop star formation. How this might work is poorly understood and can depend on environment and mass but also on details of the model implementation for supernova and active galactic nucleus (AGN) feedback. The galaxies studied here have on average old stellar populations (see Table 2) and late star formation is not a major problem. A good way of testing this particular aspect of the simulations (star formation, gas, quenching) is to compare the gas properties of simulated galaxies at z = 0 with the observed properties (including H i, CO, ionized gas and X-ray gas).
In addition, the fraction of available baryons (in every halo) converted into stars in the central galaxies for simulated massive galaxies presented here is typically two-to-five times higher than estimates from models matching observed galaxy mass functions to simulated halo mass functions (Behroozi, Conroy & Wechsler 2010; Guo et al. 2010; Moster et al. 2010; Oser et al. 2010; Leauthaud et al. 2011; Neistein et al. 2011; Yang et al. 2012; Behroozi, Wechsler & Conroy 2013; Moster, Naab & White 2013). In addition, we form no bone fide late-type galaxies in our sample. However, due to the random selection of haloes some fraction of the lower mass galaxies in our sample should be star-forming disc like systems. Possible physical processes responsible for this discrepancy, and missing in our models, are again feedback from SN ii driving galactic (Larson 1974; Dekel & Silk 1986; Oppenheimer & Davé 2008; Scannapieco et al. 2008; Governato et al. 2010; Sawala et al. 2010; Dalla Vecchia & Schaye 2012) and/or feedback from supermassive black holes (Croton et al. 2006; Di Matteo et al. 2008c; Sijacki, Springel & Haehnelt 2009; McCarthy et al. 2010; Ostriker et al. 2010; Puchwein et al. 2010; Teyssier et al. 2011; Puchwein & Springel 2013; Vogelsberger et al. 2013). Many simulations have demonstrated that feedback processes can expel the baryons from galaxies and influence the ratio of in situ formed to accreted stars and the morphology of the systems (Hirschmann et al. 2012; Lackner et al. 2012; Sales et al. 2012; Dubois et al. 2013). However, only a few attempts have been made to study these processes in more detail for massive galaxies (Teyssier et al. 2011; Martizzi et al. 2012b; Dubois et al. 2013; Puchwein & Springel 2013; Vogelsberger et al. 2013). For example, Martizzi et al. (2012b), Martizzi, Teyssier & Moore (2012a) and Dubois et al. (2013) demonstrate that AGN feedback can impact the kinematic properties the stars in the central parts of massive galaxies and promote the formation of slow rotators.
Despite the modelling uncertainties, we consider the direct connection between cosmological assembly histories of massive galaxies and their present-day two-dimensional kinematic features presented in this paper to be generally valid.
We thank the anonymous referee for valuable comments on the manuscript. MC acknowledges support from a Royal Society University Research Fellowship. This work was supported by the rolling grants ‘Astrophysics at Oxford’ PP/E001114/1 and ST/H002456/1 and visitors grants PPA/V/S/2002/00553, PP/E001564/1 and ST/H504862/1 from the UK Research Councils. RLD acknowledges travel and computer grants from Christ Church, Oxford and support from the Royal Society in the form of a Wolfson Merit Award 502011.K502/jd. LD is also grateful for support from the Australian Astronomical Observatory Distinguished Visitors programme, the ARC Centre of Excellence for All Sky Astrophysics and the University of Sydney during a sabbatical visit. SK acknowledges support from the Royal Society Joint Projects Grant JP0869822. RMcD is supported by the GeminiObservatory, which is operated by the Association of Universities for Research in Astronomy, Inc., on behalf of the international Gemini partnership of Argentina, Australia, Brazil, Canada, Chile, the United Kingdom and the United States of America. MB has received, during this research, funding from the European Research Council under the Advanced Grant Programme Num 267399-Momentum. PS is an NWO/Veni fellow. MS acknowledges support from an STFC Advanced Fellowship ST/F009186/1. LY acknowledges support from NSF grant AST-1109803. The authors acknowledge financial support from ESO.
Dunlap Fellow.
REFERENCES
APPENDIX A: KINEMATIC MAPS OF THE CENTRAL GALAXIES
In this section, we show all two-dimensional kinematic maps of the central galaxies in the simulated haloes. The galaxies can be identified by their number and the global galaxy properties are given in Table 1. The maps are constructed as described in Section 4 and we present the line-of-sight velocity (left-hand panels), velocity dispersion (second to left), h3 (second to right) and h4 (right-hand panels).
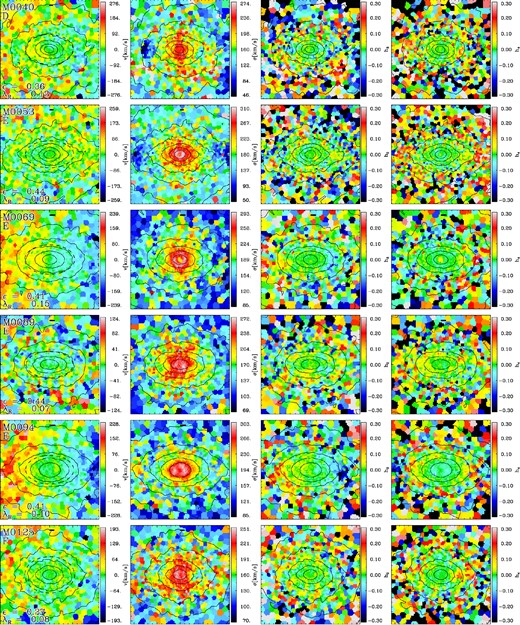
Two-dimensional kinematic maps of the simulated galaxies. From left to right, we show the line-of-sight velocity, velocity dispersion, h3, h4. The central galaxies are named by their identification number (e.g. M0040). Isophotal contours are indicated by the black lines and the projected ellipticity at re as well as λR is given in the left-hand panels (see also Table 1 for galaxy properties). The bar indicates 1 kpc.
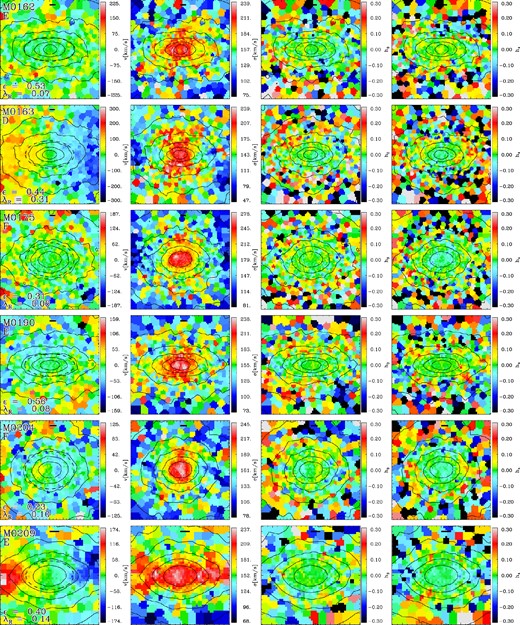
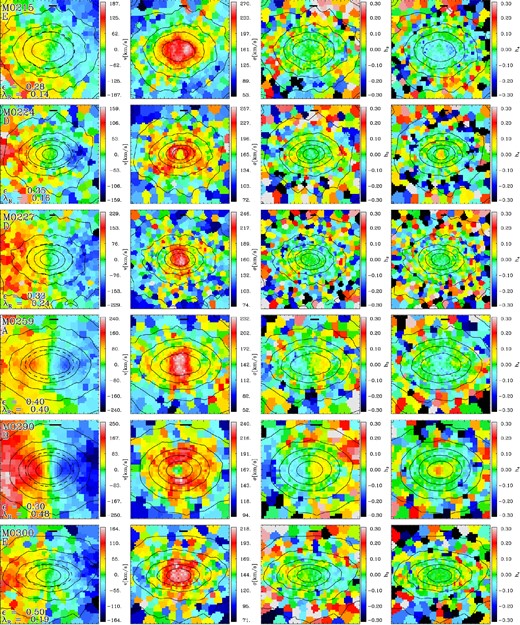
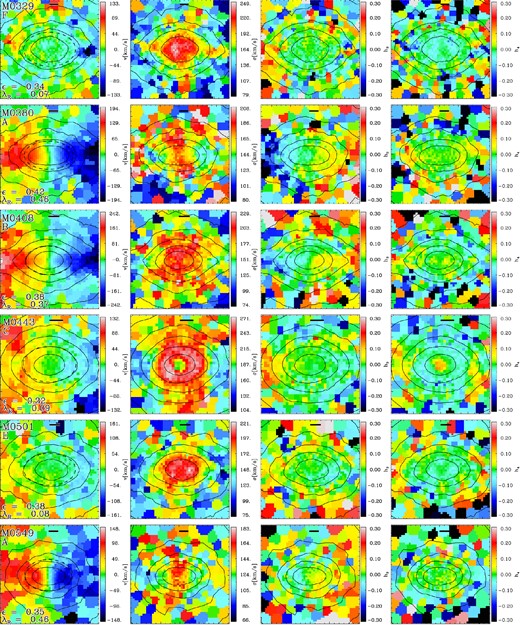
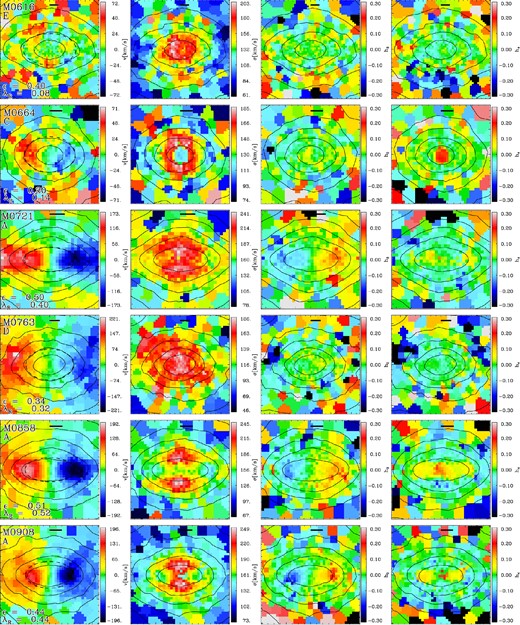
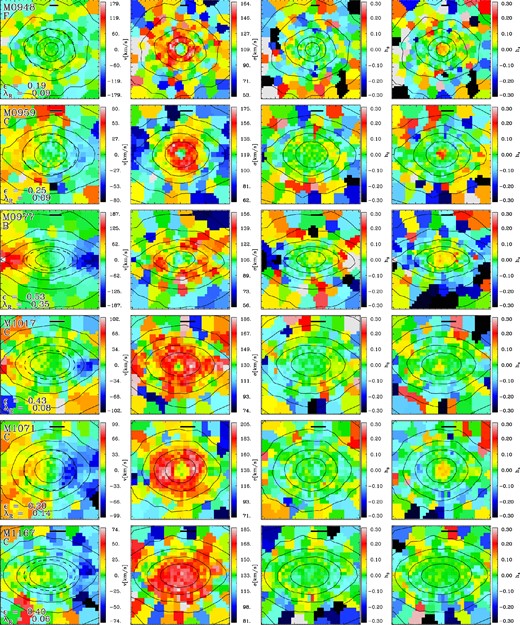
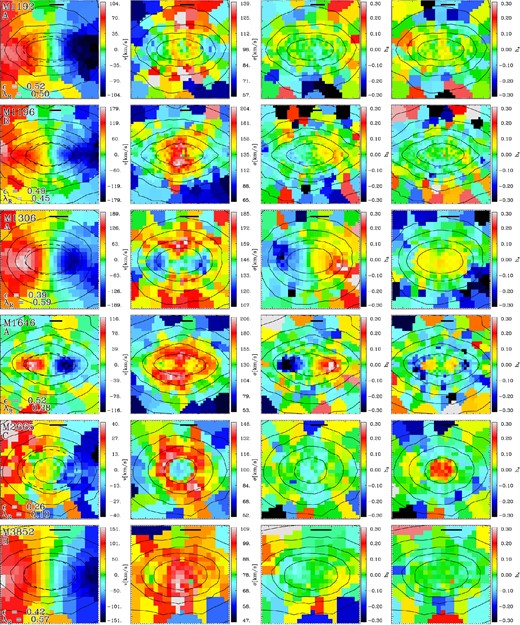
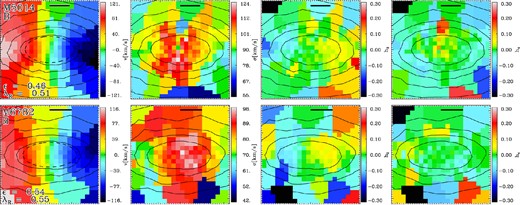
APPENDIX B: KINEMATIC MAPS OF THE SATELLITE GALAXIES
Here, we show all two-dimensional kinematic maps of the most massive satellites down to a stellar mass limit of 1010 M⊙. The host galaxy of the satellites is indicated by the main galaxy number followed by −S1, −S2 etc., e.g. M0040-S3 is the third most massive satellite in the dark matter halo of galaxy M0040. The maps are constructed as described in Section 4 and we present the line-of-sight velocity (left-hand panels), velocity dispersion (second to left), h3 (second to right) and h4 (right-hand panels).
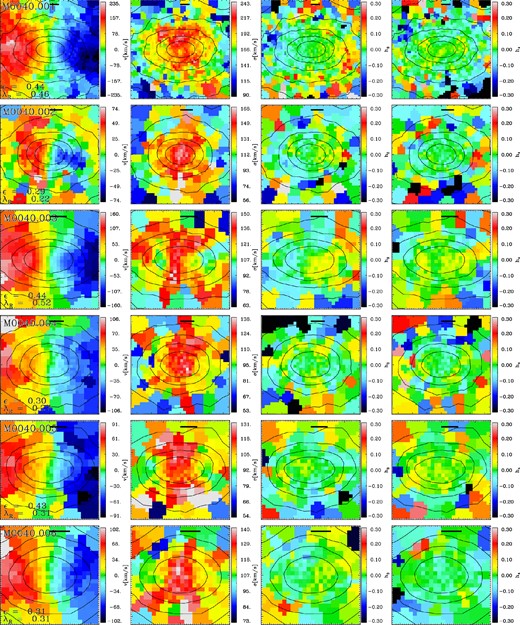
Two-dimensional kinematic maps of the simulated most massive satellite galaxies. From left to right, we show the line-of-sight velocity, velocity dispersion, h3, h4. The satellite galaxies residing in the main galaxy halo are named according to the identification number of the main galaxy (e.g. M0040) followed by an identification number ordered by stellar mass and indicated by a three digit number.001, .002 etc. For example, M0040.002 is the second most massive satellite galaxy in the dark matter halo of M0040. Isophotal contours are indicated by the black lines and the projected ellipticity at re as well as λR is given in the left-hand columns. The bar indicates a physical size of 1 kpc.
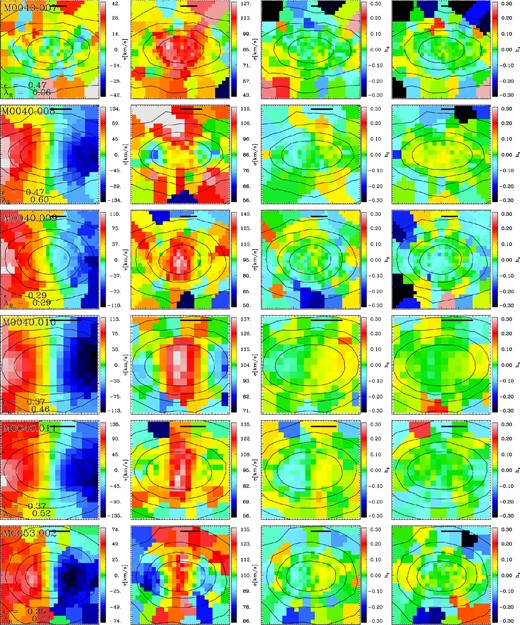
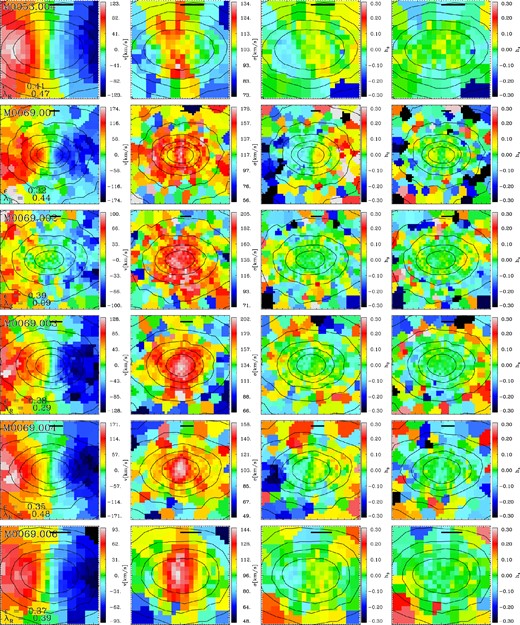
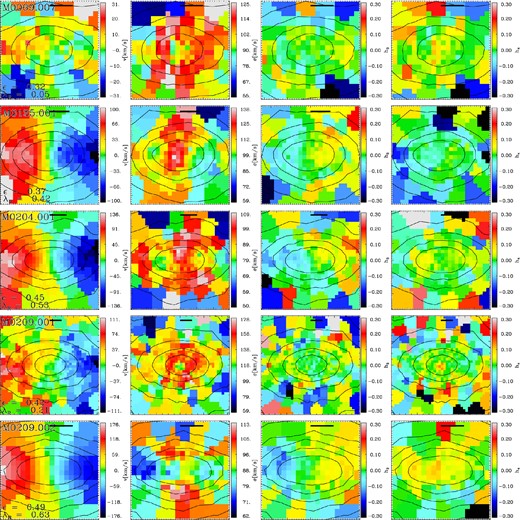
