


Abstract
Integrin αvβ6 promotes migration, invasion, and survival of cancer cells; however, the relevance and role of αvβ6 has yet to be elucidated in breast cancer.
Protein expression of integrin subunit beta6 (β6) was measured in breast cancers by immunohistochemistry (n > 2000) and ITGB6 mRNA expression measured in the Molecular Taxonomy of Breast Cancer International Consortium dataset. Overall survival was assessed using Kaplan Meier curves, and bioinformatics statistical analyses were performed (Cox proportional hazards model, Wald test, and Chi-square test of association). Using antibody (264RAD) blockade and siRNA knockdown of β6 in breast cell lines, the role of αvβ6 in Human Epidermal Growth Factor Receptor 2 (HER2) biology (expression, proliferation, invasion, growth in vivo) was assessed by flow cytometry, MTT, Transwell invasion, proximity ligation assay, and xenografts (n ≥ 3), respectively. A student’s t-test was used for two variables; three-plus variables used one-way analysis of variance with Bonferroni’s Multiple Comparison Test. Xenograft growth was analyzed using linear mixed model analysis, followed by Wald testing and survival, analyzed using the Log-Rank test. All statistical tests were two sided.
High expression of either the mRNA or protein for the integrin subunit β6 was associated with very poor survival (HR = 1.60, 95% CI = 1.19 to 2.15, P = .002) and increased metastases to distant sites. Co-expression of β6 and HER2 was associated with worse prognosis (HR = 1.97, 95% CI = 1.16 to 3.35, P = .01). Monotherapy with 264RAD or trastuzumab slowed growth of MCF-7/HER2-18 and BT-474 xenografts similarly (P < .001), but combining 264RAD with trastuzumab effectively stopped tumor growth, even in trastuzumab-resistant MCF-7/HER2-18 xenografts.
Targeting αvβ6 with 264RAD alone or in combination with trastuzumab may provide a novel therapy for treating high-risk and trastuzumab-resistant breast cancer patients.
One of the most aggressive subtypes of breast cancer is caused by overexpressed Human Epidermal Growth Factor Receptor 2 (HER2), a member of the receptor tyrosine kinase family of receptors comprising of HER1-HER4 (1). HER2 is overexpressed in 25–30% of breast cancer (1,2) and imparts a more invasive phenotype, although the mechanisms are not clear (3). Introduction of the antibody trastuzumab (TRA), which blocks downstream signaling from HER2, reduces recurrence and mortality in HER2-positive (HER2+) breast cancer patients (4,5). Unfortunately, over 70% of patients either have de novo or develop resistance to trastuzumab, leaving them without suitable treatment options (6). Thus, identifying improved therapies for women with HER2+ breast cancer is essential.
Studies have implicated dysregulation of the PI3K/Akt pathway as a resistance mechanism in HER2+ breast cancer (7). However, Akt is involved in many non-cancer related pathways, hence inhibition may lead to off-target and potentially undesirable effects (8). Specifically, how HER2 promotes invasion and how PI3K signaling promotes trastuzumab-resistance must be discovered.
TGFβ promotes HER2-driven cancer by increasing migration, invasion, and metastasis (9–11). However, TGFβ exists in tissues as a latent form and must become activated before inducing biological activity (12). A major activator of TGFβ is the integrin αvβ6 (13), which is implicated in promoting multiple types of cancer (14–18), including the progression from ductal carcinoma in situ (DCIS) to invasive carcinoma in the breast (19). For this reason, we considered whether αvβ6 could influence HER2+ breast cancer.
Integrins are a family of 24 αβ heterodimeric transmembrane cell-surface receptors that modulate cell behavior, transducing spatio-temporal messages from the extracellular environment (20). Integrin functions include adhesion, migration, invasion, growth, survival, and differentiation. Dysregulation of integrin expression and/or signaling correlates with development of cancer through inappropriately regulating the processes above, but also mediating invasion and metastasis (21). The integrin αvβ6, expressed only by epithelial cells, is usually only detectable on cells undergoing tissue remodeling, including wound healing and cancer (17). Integrin αvβ6 promotes invasion of carcinoma cells and its overexpression correlates with poor survival from colon, cervix, and non-small-cell lung cancer (14–16).
In this study, we examine expression and function of αvβ6 in breast cancer in vitro and in vivo. We show that high αvβ6 expression is not only an independent predictor of overall survival from breast cancer associated with distant metastases, but that it is a tractable target for antibody therapy. Thus, simultaneous antibody targeting of αvβ6 and HER2 in mice bearing breast cancer xenografts statistically significantly improved the therapeutic efficacy of trastuzumab, including eliminating trastuzumab-resistant tumors. These data suggest that targeting αvβ6 may improve trastuzumab therapy and potentially be effective against tumors that are trastuzumab resistant.
Methods
Clinical Samples and Immunohistochemical Analysis
Two independent cohorts of breast cancer samples were analyzed following REMARK guidelines (22). One comprised 1795 consecutive cases from the Nottingham Tenovus Breast Carcinoma Series (Nottingham Cohort) of women younger than 70 presenting from 1986–1998 (23,24). Data were available on tumor type, histological grade, size, lymph node (LN) status, ER-, PR- and HER2-status, cytokeratin (CK) profile, recurrence (local, regional, and distant), and survival. The second cohort constituted 1197 invasive cases from Guy’s and St.Thomas’ Breast Tissue Bank, London (London Cohort). Patients underwent surgery from 1960–1998 (98% from 1975 onwards). Data were available on tumor type, grade, LN status, ER-, PR- and HER2-status, disease free survival, and overall survival. A summary of clinicopathological data is presented (Supplementary Table 1, available online). All studies were approved by the North East London Research Ethics Committee with written informed patient consent obtained.
Immunohistochemistry utilized 4 μm, formalin-fixed, paraffin-embedded serial sections of tissue microarrays (TMAs). The protocol used for αvβ6 integrin (mAb 6.2G2, Biogen Idec) was described previously (15).
Transwell and Organotypic Invasion Assays
Transwell invasion assays: 5x10⁴ cells (Figure 2B) were seeded per well post-treatment into 6.5mm diameter, 8 μm pore-sized Transwells (Corning BV) coated with 70 μl BD Matrigel Basement Membrane matrix (Matrigel):media (1:2 ratio). Cells that invaded through Matrigel were counted after 72 hours using a CASY counter (Scharfe Systems, Germany). Organotypic assays were prepared as described previously but were adapted to Transwells (19); breast cancer cells were seeded per well posttreatment into Transwell gel mix containing MRC5/hTERT fibroblasts. Gels were fixed in formal saline after 5 to 6 days, paraffin embedded and sections hematoxylin and eosin stained. Invasion Index was calculated by multiplying the mean depth at 5 points on each gel by the area occupied by the invading cells using ImageJ 1.64 software (NIH).
Human Tumor Xenograft Models
All mouse experiments followed Home Office Guidelines determined by the Animals (Scientific Procedures) Act 1986. For all mouse studies, 264RAD and trastuzumab were dissolved in phosphate-buffered saline (PBS), at a final concentration of 10mg/kg. Estrogen pellets (0.25mg 60-day release, Innovative Research of America) were implanted subcutaneously into mice 24 hours prior to tumor cell injection. Female SCID-mice (6 to 8 weeks of age; with n ≥ 3/treatment; generous gift from Oncology iMED, AstraZeneca, Maccelsfield, UK) or female CD1 nu/nu mice (Charles River Laboratories) were inoculated subcutaneously with either 1x10⁶ MCF-7/HER2-18 cells in 200 μl of PBS or 1x10⁷ BT-474 cells in 1:1 PBS/Matrigel. Mice were randomized into treatment groups based on tumor volume (n ≥ 3/treatment). Mice received biweekly intraperitoneal injections (10mg/kg in 200 µl of PBS) of human immunoglobulin (IgG), 264RAD, trastuzumab, or both 264RAD and trastuzumab. Tumors were measured with calipers biweekly in two directions and tumor volume calculated using the formula (width2 x length)/2. For further details, see the Supplementary Methods, avaible online.
Statistical Analyses
All statistical tests were two sided. A P value of less than .05 was considered statistically significant.
Preclinical Data.
Statistical significance in drug-treated vs control in vitro cultures was determined using the Student’s t-test for two variables. For three or more variables, data were analyzed using one-way analysis of variance (ANOVA) with Bonferroni’s Multiple Comparison Test using Prism GraphPad software (Systat Software, San Jose, CA). For tumor xenograft models, individual growth curves were plotted, and then a linear mixed model was used to test for differences between the treatments (25). It was fitted by maximum likelihood using the nlme package in the statistical software R (R Development Core Team, 2010) 2.11.1. P values are from Wald tests. Survival of mice was measured using the Log-Rank test in Prism GraphPad. Error bars in all experiments represent 95% confidence intervals (CIs).
Clinical Data.
HER2+ patients in the London and Nottingham clinical cohorts were dichotomized into low- and high-risk groups using αvβ6 protein expression (low-risk αvβ6 < 5, high-risk αvβ6 ≥ 5). Survival analysis was performed in R statistical environment v.2.14.1 (R package: survival v2.36-14). Hazard ratio was estimated by fitting Cox proportional hazards model, and statistical significance of the difference between the survival of risk groups was estimated using the Wald test. Proportional hazards assumption was tested by assessing correlation between survival times (5-year follow-up) and Schoenfeld residuals of αvβ6/ITGB6-dervied risk group variable, followed by Chi-square test (two-sided P < .001).
Survival Analysis.
A Chi-square test of association between subgroups and deaths was performed to determine any differences across subgroups of each variable. The P value representing the statistical significance of the association is included in Table 1.
Five-year truncated overall survival
| Factor | HR (95% CI) | P* |
|---|---|---|
| All Patients | ||
| αvβ6 | 1.60 (1.19 to 2.15) | .002 |
| Cohort | 1.40 (1.03 to 1.89) | .03 |
| ER | 0.77 (0.49 to 1.19) | .24 |
| PR | 0.69 (0.50 to 0.96) | .03 |
| HER2 | 1.84 (1.24 to 2.72) | .002 |
| Triple negative | 1.36 (0.81 to 2.31) | .25 |
| Stage 1 (baseline) | ||
| Stage 2 | 2.00 (1.48 to 2.69) | <.001 |
| Stage 3 | 3.46 (2.12 to 5.67) | <.001 |
| Stage 4 | 3.99 (0.90 to 17.67) | .07 |
| Stage 5 | 4.62 (1.40 to 15.22) | .01 |
| Node 1 (baseline) | ||
| Node 2 | 1.81 (1.19 to 2.75) | .005 |
| Node 3 | 3.11 (1.92 to 5.02) | <.001 |
| Tumor size 1 (baseline) | ||
| Tumor size 2 | 1.80 (1.31 to 2.44) | <.001 |
| Tumor size 3 | 1.54 (0.91 to 2.61) | .11 |
| HER2+ cohort only | ||
| αvβ6 | 1.97 (1.16 to 3.35) | .01 |
| Cohort | 1.86 (1.02 to 3.38) | .04 |
| ER | 0.55 (0.30 to 1.00) | .05 |
| PR | 1.38 (0.71 to 2.67) | .34 |
| Stage 1 (baseline) | ||
| Stage 2 | 2.72 (1.41 to 5.25) | .003 |
| Stage 3 | 3.05 (1.23 to 7.55) | .02 |
| Stage 4 | 7.12 (0.78 to 64.84) | .08 |
| Stage 5 | 3.00 (0.33 to 27.60) | .33 |
| Node 1 (baseline) | ||
| Node 2 | 2.18 (1.09 to 4.35) | .03 |
| Node 3 | 4.55 (2.07 to 10.00) | <.001 |
| Tumor size 1 (baseline) | ||
| Tumor size 2 | 1.73 (0.89 to 3.35) | .11 |
| Tumor size 3 | 1.59 (0.61 to 4.11) | .34 |
* A Chi-square test of association between subgroups and deaths was performed to determine any differences across subgroups of each variable. Multivariable Cox model adjusted for all covariates was fit to include node status, triple negative, and HER2 covariates in order to confirm that β6 is an independent predictor of breast cancer survival. There was no grade analysis, because the London cohort does not have this information. ER = estrogen receptor; PR = progesterone receptor.
A multivariable Cox model adjusted for all covariates was fit to include node status, triple negative and HER2 covariates, in order to confirm that β6 is an independent predictor of breast cancer survival. There was no grade analysis, because the London cohort does not have this information. Please also note that triple negative (TN) status and HER2 status is not included, because we cannot have TN samples in the HER2 cohort, and HER2 status is not applicable, as all samples are HER2+. Multivariable analyses were also performed with cohort as a controlling factor for each covariate (Supplementary Table 3, available online).
Likewise, gene expression-derived HER2+ patients in the Molecular Taxonomy of Breast Cancer International Consortium (METABRIC) cohort (26) were analyzed using the ITGB6 expression profile. The risk-group dichotomization threshold for ITGB6 expression in METABRIC was established by using the proportion of low- and high-risk HER2+ patients, determined by antibody studies of the London/Nottingham cohorts. Kaplan Meier survival curves were drawn in R statistical environment v2.14.1.
Please see the Supplementary Methods (available online) for additional detailed methods used in this study.
Results
Analysis of Integrin αvβ6 and HER2 Coexpression in 2000 Breast Cancer Patient Samples
We stained for αvβ6 expression (Figure 1A) on TMAs from two separate cohorts (London and Nottingham) totaling over 2000 women with breast cancer. The clinicopathological parameters and the association of αvβ6 expression with these parameters are shown in Supplementary Tables 1 and Supplementary Data (available online). Normal breast tissue (n > 15) lacked αvβ6 expression, whereas high expression of αvβ6 was observed on 15% to 16% of invasive ductal carcinoma (Figure 1, A and B; Supplementary Table 2, available online). There was a statistically significant association between high expression of αvβ6 and poor survival (Figure 1, C and D). Thus, 5-year overall survival (OS) dropped from 75.6% to 58.8% in the London cohort (Figure 1C; Hazard ratio (HR) = 1.99, 95% CI = 1.48 to 2.66, P < .001) and from 84.1% to 75.0% in the Nottingham cohort (Figure 1D; HR = 1.73, 95% CI = 1.26 to 2.37, P < .001), and this statistically significant association between OS and high expression of αvβ6 extended for at least 10 years (Supplementary Figure 1, available online). After adjusting for tumor stage, size, grade, and cohorts (Table 1; Supplementary Table 3, available online), αvβ6 remained an independent predictor of OS (HR = 1.60, 95% CI = 1.19 to 2.15, P = .002). No grade was available for the London cohort, hence this analysis was not possible.
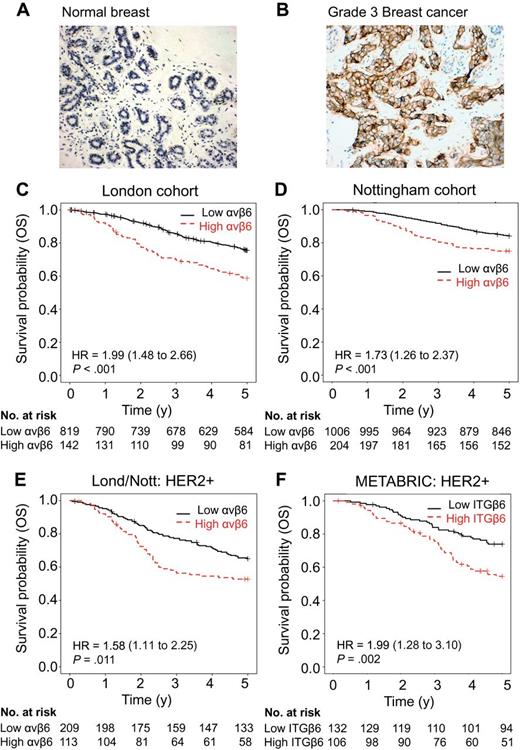
Coexpression of integrin αvβ6 and HER2 and overall survival in breast cancer patients. Kaplan–Meier curves by integrin αvβ6 expression status. Tick marks indicate patients who were still alive at the time of analyses or who were censored. All P values refer to Wald tests as determined by the Multivariable Cox model. All tests were two sided. A) Normal and B) cancerous breast cancer tissue sections immunohistochemically stained for integrin αvβ6 (brown staining) using 6.2G2 antibody (Biogen Idec). Magnification x10, scale bar = 100 μM. Overall survival in two cohorts of breast cancer patients from London (C) and Nottingham (D) by integrin αvβ6 status (high expression represented by a dashed line, low represented by a solid line). The P value for patients with high integrin αvβ6 vs low expression in tumors is <.001. E) Overall survival of HER2+ patients from the combined London and Nottingham patient cohorts by integrin αvβ6 status. The P value for patients with high integrin αvβ6 status versus low tumors is <.001. F) Overall survival of HER2+ (ERBB2) patients from the Molecular Taxonomy of Breast Cancer International Consortium (METABRIC) cohort by integrin αvβ6 status. The survival of patients with high ITGB6-expressing tumors vs low-expressing tumors is significantly lower (P = .003). Please also see Supplementary Tables 1–3 and Supplementary Figure 1 (available online). OS = overall survival.
Tumor dissemination data were available only for the Nottingham series, in which αvβ6 expression associated statistically significantly with distant spread (P = .02). Of 1026 αvβ6-negative cases, 317 (30.9%) had distant metastases, whereas of the corresponding 205 αvβ6-positive cases 81 (39.5%) had distant metastases. Furthermore, αvβ6-positive cancers were more likely to have spread to bone (P = .04).
We also noted a strong association between HER2 and high αvβ6 expression (P = .001; Supplementary Table 2, available online). Coexpression of high αvβ6 and HER2 proteins statistically significantly reduced overall survival in the combined London and Nottingham cohorts (Figure 1E; HR = 1.58, 95% CI = 1.11 to 2.25, P = .01), which remained statistically significant after adjustment for clinical covariates (HR = 1.97, 95% CI = 1.16 to 3.35, P = .01; Table 1). Increased risk may be controlled transcriptionally, because analysis of the METABRIC Breast cancer expression database (n = 238 HER2+ cases) (26) confirmed that patients who had high ERBB2 (HER2) and ITGB6 (integrin β6 subunit) gene expression had statistically significantly reduced survival (Figure 1F; HR = 1.99, 95% CI = 1.28 to 3.10, P = .002). Thus, we investigated whether HER2 and αvβ6 cooperated to promote breast cancer.
Effect of Integrin αvβ6 and HER2 Blockade on Breast Carcinoma Invasion
We screened (by flow cytometry) 20 breast cancer cell lines for expression of αvβ6 and HER2 and their ability to invade through Matrigel (Figure 2, A and B; Supplementary Table 4, available online). 80% of cell lines expressed αvβ6, and of these we examined more closely αvβ6/HER2 double-positive cell lines BT-474, MCF10A.CA1a (CA1a), and trastuzumab-resistant MCF-7/HER2-18 (HER2-18). Antibody blockade of αvβ6 (264RAD) or HER2 (TRA), or siRNA to ITGB6 or ERBB2, blocked invasion statistically significantly (Figure 2, C–F). Because 264RAD blocks αvβ8, we repeated these experiments with the αvβ6-specific antibody, 10D5, with similar results (Supplementary Figure 2A, available online), confirming invasion was αvβ6-dependent. Combining antibodies to αvβ6 and HER2 did not decrease invasion more than single antibody blockade (Figure 2G), possibly suggesting that these receptors functioned through the same pathway. Proliferation was not statistically significantly changed by any treatment over 3 days in the presence or absence of Matrigel (Supplementary Figure 2, B and C).
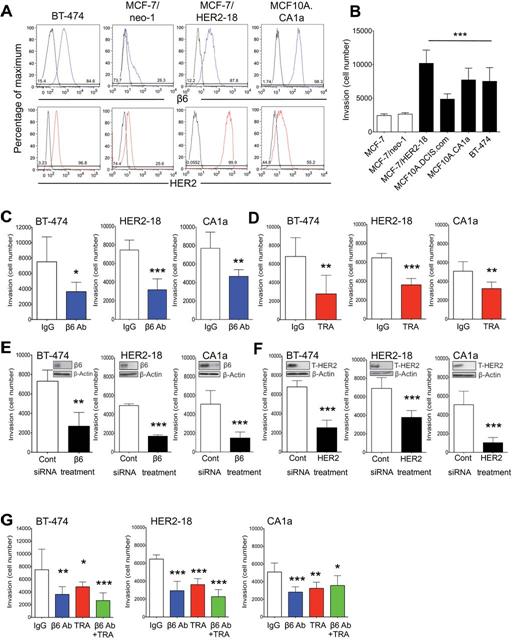
Integrin αvβ6 and HER2-blockade and breast cancer cell invasion. A) Expression of integrin αvβ6 and HER2 in a breast cancer cell line panel assessed by flow cytometry. Isotype controls all showed lower expression nearer the y-axis side, while integrin αvβ6 and HER2 expression shift the curves to the right (see Supplementary Table 4, available online, for full panel of cell lines analyzed). B) Transwell invasion assay of breast cancer cell lines expressing varying levels of integrin αvβ6 and HER2. 5 x 10⁴ cells/well were seeded and the number of cells that invaded was counted after 72 hours. C and D) Breast cancer cell-line invasion is integrin αvβ6 dependent. Cells were subjected to either 30 minutes of incubation with IgG or αvβ6 blocking antibody (β6 Ab) (10 μg/mL) (C) or 72 hours of transfection with control or β6 siRNA (20μM) (D) and subjected to a Transwell invasion assay as before. E and F) Breast cancer cell-line invasion is HER2 dependent. Cells were pretreated for 30 minutes with IgG or Trastuzumab (TRA) (10 μg/mL) (E) or transfected for 72 hours with control or HER2 siRNA (20μM) (F) and subjected to a Transwell invasion assay. G) Cells were pretreated for 30 minutes with IgG, β6 Ab, TRA (all 10 μg/mL), or a combination of the blocking antibodies, and subjected to a Transwell invasion assay. All experiments were performed in triplicate, representative experiments shown (n = 6, error bars represent 95% confidence interval). *P = .05, **P = .01, ***P < .001, relative to IgG or control-treated cells. C-F; Student’s t-test, B and G; one-way analysis of variance with Bonferroni’s Multiple Comparison Test. All tests were two sided. Please also see Supplementary Figure 2, available online. HER2 = Human Epidermal Growth Factor Receptor 2; IgG = immunoglobulin; TRA = trastuzumab.
Confocal microscopy revealed αvβ6 and HER2 colocalized in breast cancer cells (Supplementary Figure 3A, available online). Although the two proteins did not coimmunoprecitate, with or without Heregulin β1 (HRGβ) stimulation (data not shown), a proximity ligation assay revealed that the receptors do exist in close proximity (Supplementary Figure 3C, available online), suggesting they are part of the same molecular complex.
Investigating Whether Integrin αvβ6 Mediates HER2-Driven Invasion
HRGβ was added to cells to induce HER2/3 heterodimerization and downstream signaling. HER2/HER3 is the preferred heterodimer in breast cancer (27). Figures 3A and 3B show that HRGβ statistically significantly increased the invasive propensity of both HER2-18 and CA1a cells, and this increased invasion could be inhibited by HER2 (trastuzumab) or αvβ6 (264RAD) blockade. These data suggest that HER2-promoted invasion is mediated by αvβ6. The addition of HRGβ to BT-474 cells did not enhance invasion, suggesting their HER2-promoted invasive propensity was at a maximum. However, blockade of αvβ6 or HER2 suppressed their endogenous invasion (Figure 3, A and B).
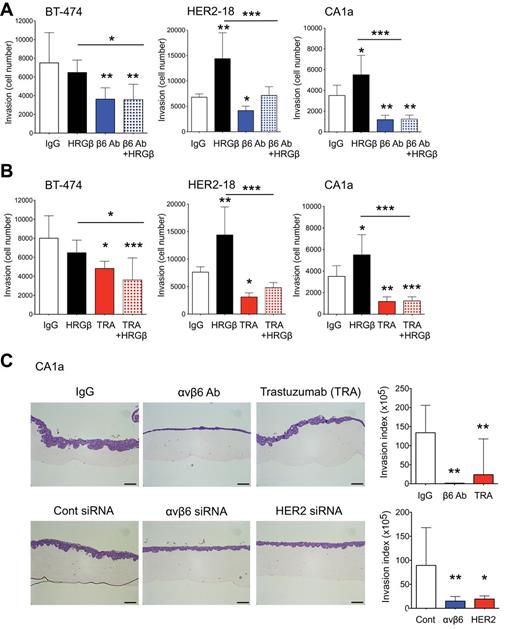
Role of integrin αvβ6 in HER2-driven breast cancer cell-line invasion. Cells were pretreated for 30 minutes with IgG, HRGβ (1μM) in the presence and absence of αvβ6 blocking antibody (10 μg/mL) (A) or trastuzumab (TRA) (10 μg/mL) (B) and 5 x 10⁴ cells/well seeded into a Transwell invasion assay. The number of cells invaded was counted after 72 hours. All experiments were performed in triplicate, representative experiments shown (n = 6, error bars represent 95% confidence interval). *P = .05, **P = .01, ***P < .001 (relative to IgG, two-sided, one-way analysis of variance (ANOVA) with Bonferroni’s Multiple Comparison Test). C) Organotypic invasion of MCF10.CA1a (CA1a) cell line. Cells were pretreated for 30 minutes with IgG, αvβ6 blocking antibody or TRA (10 μg/mL) or transfected with siRNA to αvβ6 or HER2 for 72 hours (20μM) prior to seeding. Gels were fixed in formal saline after 5 to 6 days incubation, paraffin embedded, sectioned and sections stained with H&E. Magnification bar = 10 μM. Histograms quantify the invasion of each cell with the aforementioned treatments as invasion index (n = 3, error bars represent 95% confidence interval). Experiments were performed in triplicate (n = 2/experiment), representative experiments shown. *P = .05, **P = .01, ***P < .001 (relative to Control siRNA treated cells, two-sided, one-way ANOVA with Bonferroni’s Multiple Comparison Test). HER2 = Human Epidermal Growth Factor Receptor 2; IgG = immunoglobulin; TRA = trastuzumab.
We tested our cell lines using the organotypic invasion assay, which allows tumor cells to invade into a fibroblast-rich collagen gel mimicking the tumor:stroma interface. HER2-18 and BT-474 cells could not be adapted to the organotypic system, so we tested CA1a cells. Figure 3C shows both antibody blockade and siRNA knockdown of β6 or HER2 suppressed invasion statistically significantly. Invasion was reduced by 67.5% (SD = 12.5%) with αvβ6-blockade (relative to IgG/control, P = .002, 95% CI = 58.68% to 206.40%) and 69.8% (SD = 9.9%) with HER2 blockade (relative to IgG/Control, P = .002, 95% CI = 36.31% to 184.10%) (invasion quantified as ‘Invasion Index’ shown in histograms). These data suggest that in breast cancer, αvβ6 may cooperate with HER2 to regulate intracellular signals required for invasion, and αvβ6-blockade could improve HER2-targeted antibody therapy.
Antibody Blockade of αvβ6 Combined with Trastuzumab in Human Breast Xenografts
We tested the effect of 264RAD on the growth of trastuzumab-sensitive BT-474 xenografts. Two-week treatment of mice bearing BT-474 tumors of 100mm3 with 264RAD stopped tumor growth, compared with IgG (P < .001), whereas trastuzumab reduced the growth of tumors by 77.8% (P < .001) (Figure 4A). Combination of 264RAD and trastuzumab was more effective and reduced tumor volume by 94.8%, compared with IgG (P < .001).
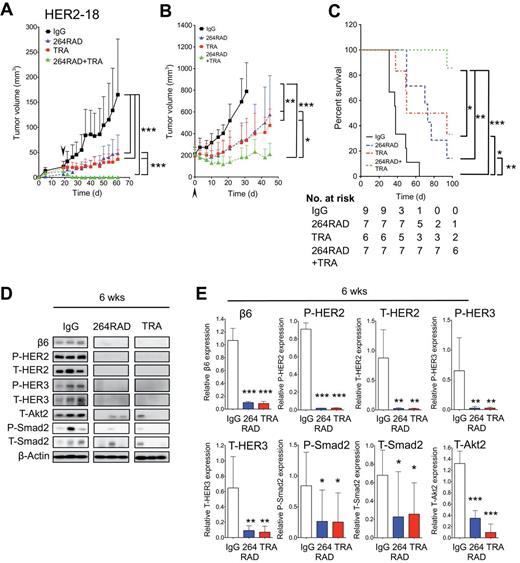
![The effect of 264RAD in combination with trastuzumab on human breast cancer xenograft growth in SCID mice. A) Mice bearing human BT-474 tumors were treated with IgG (square, solid line), 264RAD (triangle, dashed line, in line with TRA treatment), trastuzumab (TRA) (square, dashed line), or 264RAD+TRA (triangle on lower dashed line) (10mg/kg; ip) twice weekly for two consecutive weeks (start of treatment indicated by arrow, day 0). Data are presented as mean tumor volume (error bars represent 95% confidence interval, n ≥ 4 mice/group). Treatment commenced when tumors reached 100mm3. B) Mice bearing human HER2-18 tumors were treated as in (A). (C) Photographic images of representative BT-474 and HER2-18 xenografts posttreatment outlined in (A). Magnification bar = 5mm. D) BT-474 xenograft protein expression. Xenografts were treated as in (A), harvested, protein extracted, and subjected to immunoblotting. Blots were probed for indicated proteins. E) Histograms of relative protein expression from blots shown in (D) determined by optical density (n = 3 individual tumors, error bars represent 95% confidence interval). *P = .05, **P = .01, ***P < .001 (relative to IgG or to treatment indicated by corresponding lines to the side of growth curves and above histograms, as determined by plotting individual growth curves and then applying a linear mixed model to test for differences between treatments [A and B], and two-sided, one-way analysis of variance with Bonferroni’s Multiple Comparison Test [E and G]). F and G) HER2-18 xenograft protein expression and quantification as outlined in (D and E). HER2 = Human Epidermal Growth Factor Receptor 2; IgG = immunoglobulin; TRA = trastuzumab.](https://oup.silverchair-cdn.com/oup/backfile/Content_public/Journal/jnci/106/8/10.1093_jnci_dju169/2/m_jnci.j_dju169_f0004.jpeg?Expires=1716434943&Signature=MNQ~k3WAxQp99IEjiEp2N37VIC5xTybDj5siAcy79D1TGgc-hNA2xoq9N8sXhZVLV8V-zGfe0e2I7Mm-kK8n6Jhd1iEfaMyPKibX~ERJDbAm~YYF4bDF2W49NZkiyicPVqHtDvCkxVry67cDieT9QSksD7rkxVi8LUiKorvXYI9LI5mjPxhDLGvZjmlSpZakXxn9x4UYQxvdWeMVVV7i2bjqztFtQOLLvgplGsPVntFSUn09W0IOFbSHKngFscRBZ6-pWHg-z8ngnFJoPona2T0HP0sOguuzPSfVaDhlIN1xd3RRmvMg2QMjLUwOH6nqIMbXJXAJ1~4HWImFaPGenQ__&Key-Pair-Id=APKAIE5G5CRDK6RD3PGA)
The effect of 264RAD in combination with trastuzumab on human breast cancer xenograft growth in SCID mice. A) Mice bearing human BT-474 tumors were treated with IgG (square, solid line), 264RAD (triangle, dashed line, in line with TRA treatment), trastuzumab (TRA) (square, dashed line), or 264RAD+TRA (triangle on lower dashed line) (10mg/kg; ip) twice weekly for two consecutive weeks (start of treatment indicated by arrow, day 0). Data are presented as mean tumor volume (error bars represent 95% confidence interval, n ≥ 4 mice/group). Treatment commenced when tumors reached 100mm3. B) Mice bearing human HER2-18 tumors were treated as in (A). (C) Photographic images of representative BT-474 and HER2-18 xenografts posttreatment outlined in (A). Magnification bar = 5mm. D) BT-474 xenograft protein expression. Xenografts were treated as in (A), harvested, protein extracted, and subjected to immunoblotting. Blots were probed for indicated proteins. E) Histograms of relative protein expression from blots shown in (D) determined by optical density (n = 3 individual tumors, error bars represent 95% confidence interval). *P = .05, **P = .01, ***P < .001 (relative to IgG or to treatment indicated by corresponding lines to the side of growth curves and above histograms, as determined by plotting individual growth curves and then applying a linear mixed model to test for differences between treatments [A and B], and two-sided, one-way analysis of variance with Bonferroni’s Multiple Comparison Test [E and G]). F and G) HER2-18 xenograft protein expression and quantification as outlined in (D and E). HER2 = Human Epidermal Growth Factor Receptor 2; IgG = immunoglobulin; TRA = trastuzumab.
To assess whether αvβ6-blockade could improve the efficacy of trastuzumab, we repeated antibody therapy with trastuzumab-resistant HER2-18 xenografts. Figure 4B shows that in comparison with IgG, monotherapy with either 264RAD or trastuzumab slowed growth by 53.9% (P < .001) and 52.1% (P < .001), respectively, whereas combination therapy reduced tumor volume by 76.2% (P < .001). Representative images of BT-474 and HER2-18 excised xenografts are shown in Figure 4C.
Molecular Response of Breast Tumors to 264RAD and Trastuzumab
Residual BT-474 and HER2-18 xenografts post-two-week antibody treatment were analyzed for expression of target and signaling molecules. Figure 4D (quantified in Figure 4E) shows treatment of BT-474 xenografts (n = 3) with 264RAD or trastuzumab having statistically significantly reduced expression of β6, compared with IgG (95% CI = 0.02 to 0.42,P = .04; 95% CI = 0.02 to 0.41, P = .068, respectively), whereas combination almost abolished β6 expression, compared with IgG (95% CI = 0.20 to 0.41, P = .001).
Combination therapy additionally reduced expression of HER2, HER3, and Smad2. Combination therapy, but not monotherapy, was required to suppress Akt2 expression, suggesting that αvβ6 and HER2 coregulate this PI3K effector.
Similar results were seen in HER2-18 xenografts (Figure 4, F-G). Again, statistically significant reduction in T-Akt2 required combination therapy and 264RAD-increased HER2 expression, further suggesting that αvβ6 and HER2 cooperate.
Tumor/Stroma Biomarkers of 264RAD and Trastuzumab Combination Therapy
We immunostained tumor xenografts from two-week treatment studies (Figure 4). Figures 5 and 6 show micrographs of BT-474 and HER2-18 xenografts stained for pancytokeratin (CK) in order to detect the epithelial (tumor) cells, Ki67 (proliferation), β6 and HER2 (antibody targets), endomucin (blood vessels), and α-sma (α-smooth muscle actin;myofibroblasts). BT-474 xenografts were also assessed for cleaved-caspase 3 as a marker of apoptosis (HER2-18 cells do not express this caspase). Most prominent anti-tumor effects were observed with combination therapy (Figures 4 and 7), thus analysis concentrated on these treatments.
![The effect of 264RAD in combination with trastuzumab on human xenograft BT-474 tumor growth and stroma. A) Micrographs of BT-474 tumor xenografts from mice treated with IgG or 264RAD+TRA (10mg/kg; ip) twice weekly for two consecutive weeks (tumors harvested after two weeks of treatment from Figure 4A). Tumors were harvested, fixed, parafin embedded, and sections subjected to immunohistochemical staining for the indicated molecules of interest, including pancytokeratin (CK, epithelial marker), Ki67 (proliferation), endomucin (vasculature), α-sma (myofibroblast), cleaved caspase 3 (apoptosis), as well as αvβ6 and HER2 expression. Representative images are shown of the three tumors harvested for IgG and the combination treatment, where the greatest effect was observed. Scale bar in whole tumor images = 1000 μM, magnified images (x60) are of indicated region of interest (CK+ cells). Scale bar in x60 magnification images = 20 μM. B) Bar graph of composition of xenografts (% CK+ cells = white bar, % necrotic area in black, and % stroma is in gray or blue) and histograms of specific marker expression of xenografts shown in (A). Assessed and scored by two individuals (n = 3 individual tumors, error bars represent 95% confidence interval). *P = .05, **P = .01, ***P < .001 (relative to IgG, as determined by two-sided, one-way analysis of variance with Bonferroni Multiple Comparison Test [B, upper panel] and two-sided Student’s t-test [B, lower panel]). CK = pancytokeratin; HER2 = Human Epidermal Growth Factor Receptor 2; IgG = immunoglobulin; TRA = trastuzumab.](https://oup.silverchair-cdn.com/oup/backfile/Content_public/Journal/jnci/106/8/10.1093_jnci_dju169/2/m_jnci.j_dju169_f0005.jpeg?Expires=1716434943&Signature=dseESskOvG8Z5rxbKqj8wXCO22p0eh00f5TQAv5HuFLPksNeyRi8Q844ZMb9ur8R--BKMHSkl9P2W6L~fjiU5or9XTwRqDv1PMFkvVPqL6XhGollv4s2t5A1iIneiOMgHEVQ9Mqga8Yb6eHOLMY6rroHWVtKI1HHJfpI1dEw0SuIWlypzIRVrS-z8pMFUlir7BZqBXzuCHuXx4rzddWn8Lz~KiPEbG-fi6p4Vj6l47ldUNBn~6dWpGsm-n-rheebFZszEVcuLaNZaFHMQImvbX1mG8kOc6GjuBF3QXMVmfrjkGn8GYnlgB~pTxRADvsikabbZm~DIh7P31PEmHNK1g__&Key-Pair-Id=APKAIE5G5CRDK6RD3PGA)
The effect of 264RAD in combination with trastuzumab on human xenograft BT-474 tumor growth and stroma. A) Micrographs of BT-474 tumor xenografts from mice treated with IgG or 264RAD+TRA (10mg/kg; ip) twice weekly for two consecutive weeks (tumors harvested after two weeks of treatment from Figure 4A). Tumors were harvested, fixed, parafin embedded, and sections subjected to immunohistochemical staining for the indicated molecules of interest, including pancytokeratin (CK, epithelial marker), Ki67 (proliferation), endomucin (vasculature), α-sma (myofibroblast), cleaved caspase 3 (apoptosis), as well as αvβ6 and HER2 expression. Representative images are shown of the three tumors harvested for IgG and the combination treatment, where the greatest effect was observed. Scale bar in whole tumor images = 1000 μM, magnified images (x60) are of indicated region of interest (CK+ cells). Scale bar in x60 magnification images = 20 μM. B) Bar graph of composition of xenografts (% CK+ cells = white bar, % necrotic area in black, and % stroma is in gray or blue) and histograms of specific marker expression of xenografts shown in (A). Assessed and scored by two individuals (n = 3 individual tumors, error bars represent 95% confidence interval). *P = .05, **P = .01, ***P < .001 (relative to IgG, as determined by two-sided, one-way analysis of variance with Bonferroni Multiple Comparison Test [B, upper panel] and two-sided Student’s t-test [B, lower panel]). CK = pancytokeratin; HER2 = Human Epidermal Growth Factor Receptor 2; IgG = immunoglobulin; TRA = trastuzumab.
![The effect of 264RAD in combination with trastuzumab on human xenograft MCF-7/HER2-18 tumor growth and stroma. A) Micrographs of MCF-7/HER2-18 tumor xenografts from mice treated with IgG, or 264RAD+TRA (10mg/kg; ip) twice weekly for two consecutive weeks (tumors harvested after two weeks treatment from Figure 4B). Tumors were harvested, fixed, parafin embedded, and sections subjected to immunohistochemical staining for the indicated molecules of interest including cytokeratin (CK, epithelial marker), Ki67 (proliferation), endomucin (vasculature), α-sma (myofibroblasts), as well as αvβ6 and HER2 expression. Representative images are shown of the three tumors harvested for IgG and the combination treatment, where the greatest effect was observed. Scale bar in whole tumor images = 2000 μM, magnified images (x60) are of indicated region of interest (CK+ cells). Scale bar in x60 magnification images = 20 μM. B) Bar graph of composition of xenografts (% CK+ cells = white bar, % necrotic area in black, and % stroma is in gray or blue) and histograms of specific marker expression of xenografts shown in (A). Assessed and scored by two individuals (n = 3 individual tumors, error bars represent 95% confidence interval). *P = .05, **P = .01, ***P < .001 (relative to IgG, as determined by two-sided, one-way analysis of variance with Bonferroni Multiple Comparison Test [B, upper panel] and two-sided Student’s t-test [B, lower panel]). CK = pancytokeratin; HER2 = Human Epidermal Growth Factor Receptor 2; IgG = immunoglobulin; TRA = trastuzumab.](https://oup.silverchair-cdn.com/oup/backfile/Content_public/Journal/jnci/106/8/10.1093_jnci_dju169/2/m_jnci.j_dju169_f0006.jpeg?Expires=1716434943&Signature=l2G6Q2hJ5pQ5x84v~YC3r-X6kijr1OcC5bM1zo-DE7g~qZzF8ZMyfFhyb1eMple-KP~64dzxxl97eS6OJPIzwfdOUV4ZlRYrOVVK9L5St6b97AEyWOB9Fn~hUJxjAXuDV8Fxyz0WD3jCq7GBvNyzLop2Zdm9sKVgY5wlkIhUC6o3P-a9g7zRm~KRN9mkiL1Cu30liMIoWjXSmUlxSWh76~5A0kKnimiSZTWLAaIc5srwrx7xExaM3DPQfB1q18QcSNQ6xtvqUNUXUFF~mqNbVeTQZUQCpCsQXJ3w1ikjjXY7kGrlz32B-VUEymYo33lUvPysgInQ7oUB3HWGu9pV0A__&Key-Pair-Id=APKAIE5G5CRDK6RD3PGA)
The effect of 264RAD in combination with trastuzumab on human xenograft MCF-7/HER2-18 tumor growth and stroma. A) Micrographs of MCF-7/HER2-18 tumor xenografts from mice treated with IgG, or 264RAD+TRA (10mg/kg; ip) twice weekly for two consecutive weeks (tumors harvested after two weeks treatment from Figure 4B). Tumors were harvested, fixed, parafin embedded, and sections subjected to immunohistochemical staining for the indicated molecules of interest including cytokeratin (CK, epithelial marker), Ki67 (proliferation), endomucin (vasculature), α-sma (myofibroblasts), as well as αvβ6 and HER2 expression. Representative images are shown of the three tumors harvested for IgG and the combination treatment, where the greatest effect was observed. Scale bar in whole tumor images = 2000 μM, magnified images (x60) are of indicated region of interest (CK+ cells). Scale bar in x60 magnification images = 20 μM. B) Bar graph of composition of xenografts (% CK+ cells = white bar, % necrotic area in black, and % stroma is in gray or blue) and histograms of specific marker expression of xenografts shown in (A). Assessed and scored by two individuals (n = 3 individual tumors, error bars represent 95% confidence interval). *P = .05, **P = .01, ***P < .001 (relative to IgG, as determined by two-sided, one-way analysis of variance with Bonferroni Multiple Comparison Test [B, upper panel] and two-sided Student’s t-test [B, lower panel]). CK = pancytokeratin; HER2 = Human Epidermal Growth Factor Receptor 2; IgG = immunoglobulin; TRA = trastuzumab.
The effect of long-term (six-week) treatment of 264RAD in combination with trastuzumab on human xenograft MCF-7/HER2-18 cell growth in SCID mice. Mice bearing human MCF-7/HER2-18 tumors were treated with IgG (square, solid line), 264RAD (triangle, dashed line, in line with TRA), trastuzumab (TRA) (square, dashed line), or 264RAD+TRA (triangle on lower dashed line) (10mg/kg; ip) twice weekly for six consecutive weeks. Data are presented as mean tumor volume (error bars represent 95% confidence interval, n > 5 mice/group). Treatment commenced (indicated by arrows) when tumors were 4mm in any one dimension (A), and when tumors reached 200mm3 (n > 6 mice/group) (B). C) Kaplan–Meier survival plot shows survival of mice from study of larger tumors shown in (B). D) Tumors from treated mice in (A) were analyzed by immunoblotting for indicated targets (combination therapy treated xenografts were eradicated, hence were unavailable for analysis). Actin immunoblot shows equal protein input. E) Histograms quantifying changes in protein expression levels from (D) (β-actin corrected). *P = .05, **P = .01, ***P < .001 (relative to IgG, or to treatment indicated by corresponding lines to the side of growth curves and above histograms). For tumor xenograft models, individual growth curves were plotted and a linear mixed model was used to test for differences between treatments. It was fitted by maximum likelihood using the nlme package in the statistical software R (R Development Core Team, 2010) 2.11.1. P values are from Wald tests. Survival of mice was measured using the Log-Rank test. All tests were two sided. HER2 = Human Epidermal Growth Factor Receptor 2; IgG = immunoglobulin; TRA = trastuzumab.
Compared with IgG, combination therapy of BT-474 tumors induced statistically significant loss of tumor (CK+) cells, which were replaced (by >95%; Figure 5) by a mostly proteinaceous stroma (P < .05, combination therapy vs IgG). Because most of the tumor was lost, analysis of other markers was only in CK+ areas. Compared with IgG, combination therapy reduced tumor expression of β6 (P = .01), HER2 (P = .017), and proliferation (Ki67, P = .017); stromal vasculature (endomucin, P = .033) and myofibroblasts (α-sma, P = .014) were also statistically significantly suppressed (Figure 5). Apoptosis (cleaved-caspase 3) was also statistically significantly increased with combination treatment (P = .039, compared with IgG) offering an additional mechanism for BT-474 cell loss.
Combination treatment had a statistically significant effect on β6, HER2, endomucin and α-sma expression in HER2-18 xenografts (Figure 6). Ki67 expression was unaltered.
Our data suggest the tumor-suppressive effect of combination treatment is due to a combined effect on both tumor and stromal cells (Figure 4, A and B).
Effect of Long-term Combination Therapy in a Trastuzumab-Tesistant Model
Mice bearing HER2-18 xenografts of palpable size (10 to 20mm3) were given six weeks of antibody therapy. 264RAD reduced growth by greater than 70% compared with IgG, equivalent to the reduction seen with trastuzumab (both P < .001, Figure 5A). However, combined blockade of αvβ6 and HER2 eradicated HER2-18 tumors in all treated mice.
Tumors were allowed to reach 200mm3 before commencing therapy. Figure 7B shows that, compared with IgG, monotherapy with 264RAD or trastuzumab slowed growth (both P = .002), which was again statistically significantly further reduced with combination therapy (P = .014 and P = .022, respectively), which completely suppressed growth of tumors (P < .001, compared to IgG). These mice were killed when their tumors reached the maximum size permissible (following Home Office regulations) (Figure 7C). Combination therapy improved survival statistically significantly better than monotherapy (P = .004 and P = .039, compared with 264RAD and trastuzumab, respectively). No toxicity was observed in any mice for the duration of treatments as determined by change in body mass (>10% reduction), appearance or behavior.
Molecular Response of Breast Tumors to Long-term Combination Therapy
We confirmed monotherapy operated via similar molecular mechanisms to combination therapy by assessing protein expression in xenograft tissues treated for six weeks (Figure 7A). Reductions in β6, HER2, HER3, and T-Akt2 were observed (Figure 7, D and E), similar to the response of combination therapy after two weeks of therapy (Figure 4, D-G). Combination therapy eradicated xenografts prior to the end of this study, so no analysis of these tissues was possible.
Potential Mechanisms of 264RAD and Trastuzumab Therapy
Because αvβ6 activates TGFβ, we investigated the role of TGFβ in invasion and the effect of αvβ6 inhibition on invasion in the presence and absence of TGFβ ligand or receptor in vitro (Figure 4A). TGFβ did not contribute to Matrigel-invasive ability of breast cancer cells (Supplementary Figure 4A, available online).
Contrastingly, suppression of TGFβ signaling, measured by P-Smad2 reduction, occurred in BT-474 cells after two weeks of monotherapy with 264RAD or trastuzumab and was reduced further by combination (Figure 4D). However, statistically significant reductions in P-Smad2 were only seen in HER2-18 after six weeks (Figure 7, D and E).
PI3K/Akt signaling has been implicated in HER2+ breast cancer progression, hence we knocked down Akt1 and Akt2 (Akt3 was not expressed, data not shown) and observed the effect on invasion in the Transwell and organotypic invasion assays. We discovered that Akt2, but not Akt1, was necessary for invasion of Matrigel and organotypic gels (Supplementary Figure 4, Supplementary Data and Supplementary Data, available online). Antibody-treated tumors for Akt2 protein showed that two-week combination therapy statistically significantly reduced Akt2 expression, whereas monotherapy had little effect. Thus, loss of Akt2, the isoform essential for invasion in 3/3 breast carcinoma cell lines, was associated with the improved in vivo efficacy of combined αvβ6 and HER2 targeting vs monotherapy.
Discussion
This study shows conclusively that: 1) upregulation of integrin αvβ6 in breast cancer is a poor prognostic factor linked with development of distant metastases; 2) co-upregulation of αvβ6 and HER2 identifies one of the worse prognostic sub-groups of breast cancer, because 5-year OS of the already poor prognosis HER2 subgroup (28) drops from 65.1% to 52.8% if αvβ6 is also expressed strongly; and 3) the likely biological explanation for these clinical observations is that αvβ6 and HER2 cooperate (within the same molecular complex), the integrin αvβ6 mediating the invasive behavior of HER2-promoted cancer. Our data support the proposal that testing of biopsies for αvβ6 expression should become a routine immunopathological procedure to stratify women with breast cancer into this new ‘very-high-risk’ αvβ6-positive/HER2+ subgroup. The value of this stratification is that our study also suggests a promising therapeutic strategy for this high-risk subgroup.
Trastuzumab is the first line of therapy for women with HER2+ breast cancer, either as an adjuvant therapy for early stage breast cancer or in combination with chemotherapy for metastatic breast cancer (4,29). In 2012, more than 225000 women developed breast cancer in the US, and 20% to 25% would have had HER2 overexpression (NIH statistics) and been likely to have received trastuzumab. However, 70% of these women will develop resistance, or naturally be resistant, to trastuzumab (6), meaning up to 39375 American women will develop HER2+ breast cancers for which no specific therapies exist. Our data show that over 40% of these HER2+ women are also likely to express high levels of αvβ6. We suggest that antibody targeting of αvβ6 in these women may offer a therapeutic option, and our preclinical studies support this proposal. Our data show that in both trastuzumab-sensitive and –resistant, HER2-overexpressing human breast cancer xenografts, simultaneous antibody targeting of αvβ6 (with 264RAD) and HER2 (with trastuzumab) statistically significantly improves the therapeutic effect of trastuzumab alone and statistically significantly increases survival.
The molecular mechanisms of how antibody-blockade can suppress or reduce breast cancer growth involve, in part, the changing of the tumor phenotype to a lower risk sub-type. In antibody-treated tumors, there is consistent down-regulation of expression of αvβ6, HER2, and HER3, three receptors whose upregulation promotes breast cancer, reduces survival, and therefore drives metastasis (28). Even monotherapy targeting either αvβ6 or HER2 suppressed αvβ6 expression, further suggesting that these two molecules are coregulated in breast cancer.
Combined αvβ6 and HER2 blockade was more effective than monotherapy at slowing or reducing tumor growth. We looked at signaling pathways implicated in αvβ6 and HER2 behavior to understand this effect.
We examined TGFβ signaling, because αvβ6 can activate latent TGFβ (15). Moreover, activated TGFβ promotes HER2 tumorigenicity by increasing migration, invasion and metastasis (9–11,30). Again, only combination therapy statistically significantly reduced Smad2 in BT-474 tumors, whereas monotherapy was not statistically significantly effective. In contrast, in trastuzumab-resistant tumors, reduction in TGFβ signaling was relatively poor.
Trastuzumab mediates anti-proliferative effects in HER2+ cells by facilitating HER2 degradation and downregulation of PI3-K/Akt signaling (31,32). Our data demonstrate that after two weeks of antibody therapy, downregulation of Akt2, rather than TGFβ signaling, correlated more strongly with the enhanced tumor suppression seen with combination therapy. However, this does not negate the likelihood that loss of TGFβ signaling, due to antibody-blockade of αvβ6, contributes to tumor therapy and overall survival seen after six weeks of therapy.
Immunohistological analysis of the combination antibody-treated tumors confirmed the loss of αvβ6 and HER2 and suggested apoptosis as one mechanism to explain the loss of BT-474 cells. However, combination therapy also dramatically changed the stroma into a less tumor-permissive environment, reducing vascular density and the number of tumor-associated fibroblasts (myofibroblasts). Whether these changes are in part due to abrogating the ability of αvβ6 to activate TGFβ, which is pro-angiogenic and produces myofibroblasts, must be determined.
Our study is not without limitations. Grade data was unavailable for the London cohort. No clinical data were available for response to trastuzumab therapy. The combination therapy was tested in only two cell lines in vivo and the anti-tumor effect observed herein cannot necessarily be guaranteed in other β6+HER2+ cell lines nor in patients with β6/HER2-amplified breast cancer.
In summary, we suggest that examining breast cancers for αvβ6 expression should become standard practice, because high expression of αvβ6 identifies women with statistically significantly more hazardous types of disease, especially those who are HER2+. In addition, our data show that antibody blockade of αvβ6 could offer an effective additional therapy for such women, possibly even those with trastuzumab-resistant disease. The fact that human (264RAD; 33) and humanized (STX-100; 34) αvβ6-blocking antibodies are being developed for human use shows that αvβ6 targeted therapy of breast cancer is feasible and should be a major consideration for the near future.
Funding
This research was supported by grants from Breast Cancer Campaign (BCC 2008 May PR32) and the Medical Research Council (MRC G0800825).
Notes
The study sponsors had no role in design of the study, the collection, analysis, or interpretation of the data, the writing of the manuscript, nor the decision to submit the manuscript for publication.
STB and JK are both employees and shareholders of AstraZeneca. SV and PHW are employees of Biogen Idec. All other authors declare no conflicts of interest.
We are very grateful to Oncology iMED, AstraZeneca (Maccelsfield, UK) for their generous gift of 264RAD and SCID mice. Kind thanks also to Professor Mien-Chung Hung, University of Texas M.D. Anderson Cancer Center, Texas, for the gift of MCF-7/neo-1 and MCF-7/HER2-18 cells.
References

