


Abstract
BACKGROUND: Effect of past reproductive performance on subsequent fecundity is uncertain. METHODS: A total of 2983 consecutive pregnant women self-completed questionnaires about time to pregnancy (TTP), pregnancy planning, previous pregnancies, contraceptive use, age, and individual/lifestyle variables. Outcome measures were: TTP, conception rates (CR) and, subfecundity odds ratio (OR; with 95% confidence intervals) before and after each outcome of last pregnancy. RESULTS: After miscarriage, TTP was longer than before miscarriage [2.1 (1.4–3.0), P<0.001] and than TTP after livebirth [OR=2.1 (1.6–2.6), P<0.001]. Also subfecundity OR after miscarriage increased [1.7 (1.2–2.4), 1.8 (1.2–2.5), P=0.001, 0.002 respectively]. This effect was more evident in older and obese women. Compared with livebirth, time to ectopic pregnancy (EP) was longer [OR=13.8 (1.8–108.5), P=0.001] but TTP after EP was not significantly different. Subfecundity OR relative to livebirth were 12.8 (3.6–45.0) (P<0.001) before, and 3.9 (1.4–11.0) (P=0.01) after, EP. The CR after EP increased 3-fold (1.1–8.3) over those prior to EP. Time to the terminated pregnancies even without contraceptive failures was shorter than that to livebirth [OR=0.5 (0.3–0.7), P=0.001] and than TTP after termination [0.35 (0.1–0.8), P=0.001]. Also subfecundity OR increased after termination [7.2 (1.8–29.7), P=0.02]. CONCLUSIONS: Miscarriers should be counselled about short-term reduction in subsequent fecundity, and earlier investigations should be considered in those who have other potential risk factors for reduced fertility. Further studies are required to clarify the relatively favourable effect on fecundity following EP and the relative reduction in fecundity after termination of pregnancy.
Introduction
A previous adverse reproductive outcome may be predictive not only of a similar but also of other adverse outcomes in future reproductive attempts (Regan et al., 1989; Dominguez et al., 1991; Williams et al., 1991; McElrath and Wise, 1997; Krohn et al., 1998; Whitley et al., 1999; Bouyer et al., 2003; El-Bastawissi et al., 2003). An association between miscarriage and subfertility has long been proposed (Rachootin and Olsen, 1982). Subfertile women have a 3-fold higher frequency of miscarriage than the fertile population (Jansen, 1982) and those suffering from recurrent miscarriage have a 2-fold increase in the frequency of subfertility compared with the general population (Coulam, 1992). One mechanism partly accounting for this association is the high proportion of early pregnancy loss before the time of clinically perceived pregnancy (Wilcox et al., 1988; Zinaman et al., 1996) which, when recurrent, is likely to be portrayed as unexplained subfertility. A definite consequence of pregnancy loss on later fertility is yet to be established (Wang et al., 2003).
On the other hand, the strong association between ectopic pregnancy (EP) and tubal factor subfertility is well recognized (Bernoux et al., 2000; Bouyer et al., 2003). One episode of EP increases the risk of a similar outcome in subsequent pregnancies (Job-Spira et al., 1996), but whether the EP and/or its management are associated with a further detrimental effect on the subsequent fecundity of this population that already has a compromised fertility potential remains unclear (Bouyer et al., 2000).
Most of the terminated pregnancies are unintentional and many of these have resulted from contraceptive failure (Fleissig, 1991; Bromham and Cartmill, 1993; Hannaford, 1999). Becoming pregnant as a result of contraceptive failure may reflect, at least partly, high fecundity of the couple (Baird et al., 1994; Olsen et al., 1998) but the effect of termination of pregnancy (TOP) on subsequent fecundity and its association with subsequent adverse reproductive outcomes remains controversial (Venkatacharya, 1972; Kreibich and Ehrig, 1978; Obel, 1979, 1980; Hogue et al., 1983; Skjeldestad and Atrash, 1997; Thorp et al., 2003).
The aim of this study was to evaluate the association patterns and to quantify the exclusive effects of previous adverse reproductive outcomes, namely subfecundity, miscarriage, EP and TOP on subsequent fecundity, by comparing the time-interval to pregnancy (TTP), conception rates (CR) and subfecundity odds ratio (OR) (TTP >12 months) before and after each pregnancy outcome, also comparing these parameters after each outcome with those after livebirth, adjusting for the potential confounding factors and after excluding the contraceptive failures.
Materials and methods
Consecutive pregnant women attending the antenatal clinics in Hull and East Yorkshire and in Sheffield were asked to self-complete questionnaires inquiring about TTP (current and previous); outcome and date of each previous pregnancy; history of subfertility and whether fertility treatments were used. Other questions included contraceptive use; pregnancy planning; gynaecological disease; factors that may affect fertility; individual/lifestyle characteristics of each partner, e.g. age, weight, height, smoking, alcohol consumption, coffee/tea intake, recreational drug use and coital frequency. TTP was defined by the interval of exposure to unprotected intercourse from discontinuing birth-control methods till conception.
The questionnaire was appropriately validated (Hassan and Killick, 2003a,b, 2004a,b). Approval was obtained from Local Research Ethics Committees. There were no conflicts of interest. The response was >98%. This sample included 2983 subjects. The pregnancy directly before the current one was used as index pregnancy. Five pregnancy outcomes were identified: livebirth, miscarriage, TOP, EP and stillbirth. Analysis was carried out using the Statistical Package for Social Science (SPSS). P<0.05 was considered statistically significant.
To assess the effect of previous adverse pregnancy outcome on later fecundity, TTP, CR and subfecundity OR relative to each outcome were studied. Each measure after each pregnancy outcome was compared with that before the outcome (Wilcoxon signed-rank and McNemar tests). The measures after each outcome were compared with those after livebirth (univariate analysis and median test for TTP, χ2 and Fisher's exact tests for subfecundity). The individual/lifestyle factors were assessed by pregnancy outcome to identify potential confounders (Kruskall–Wallis test), which were adjusted for using regression analysis. Two types of regression models were used: a general linear model to detect variation in TTP after miscarriage, EP or TOP from that after livebirth, and a binary logistic model to predict subfecundity after each pregnancy outcome and calculate subfecundity odds relative to livebirth, adjusting in each model for the potential confounders identified (Tables II and III). Factors in the models were women's age, BMI, smoking, alcohol consumption, coffee intake, parity, menstrual pattern, coital frequency, and men's age, alcohol consumption, smoking (menstrual pattern was categorized as regular or irregular; other factors were continuous variables). Analyses including and excluding contraceptive failure gave similar results. Results were unchanged after excluding those who conceived after fertility treatments.
Results
Out of 2983 women in the sample, 33 did not report the number of their pregnancies, 891 (30.2%) were pregnant for the first time, 942 (31.9%) had one, 552 (18.7%) had two and 565 (19.2%) had more than two previous pregnancies. Out of 2059 women who had had at least one previous pregnancy, 75 did not report last pregnancy outcome, 1335 (67.3%) had livebirth, 390 (19.7%) had miscarriage, 39 (2.0%) had stillbirth, 20 (1.0%) had EP and 200 (10.1%) had TOP.
Couples who had suffered subfecundity before the previous pregnancy were more likely to have taken >1 year to achieve the current one [72.9%, OR=5.9 (5.2–6.7), P<0.001]. A history of subfecundity was associated with higher risks of miscarriage and EP [adjusted OR=1.8 (1.1–2.8) and 14.1 (4.0–50.3), P=0.01 and <0.001 respectively] in last pregnancy (Table I). Of 1117 women who had had two or more pregnancies, those who had livebirth (58.0%), miscarriage (20.3%) or EP (0.9%) with first pregnancy were more likely to have had the same outcome subsequently [in order: 67.0, 37.8, 30.0%; OR=1.2 (1.1–1.3), 1.6 (1.3–1.9), 63.7 (17.5–231.0); P=0.006, <0.001, <0.001].
Previous reproductive outcome and TTP (Figure 1, Table II)
Regarding last pregnancy outcome, variations of TTP before and after livebirth and of time to EP and TTP after EP were not significant. TTP after miscarriage was more likely to be longer than TTP before miscarriage [RR=2.1 (1.4–3.0), P<0.001]. Also TTP after TOP was more likely to be longer than TTP before TOP [RR=2.9 (1.2–7.2), P=0.001]. In last pregnancy, relative to TTP before livebirth, the adjusted mean TTP that had miscarried was not different, time to EP was 2.5-fold longer (P=0.005) and TTP that had been terminated was 0.5-fold shorter (P=0.02). Analysis of median time to last pregnancy showed that relative to TTP before livebirth odds of TTP >median were not increased before miscarriage: 13.8 (1.8–108.5) (P=0.001) for time to EP and 0.5 (0.3–0.7) (P=0.001) for TTP before TOP. In contrast, after last pregnancy, relative to TTP after livebirth, adjusted mean TTP after miscarriage was 1.4-fold longer (P<0.001), that after EP was 2.1-fold longer (P=0.004) but TTP after TOP was not different. Using median TTP after last pregnancy, odds of TTP > median were: 2.1 (1.6–2.6) (P<0.001) after miscarriage; 1.8 (0.8–4.5) (P=0.2) after EP; and TTP after TOP was not different than after livebirth.
The prolongation in TTP after previous miscarriage was more evident in older women, obese women and those who were subfecund before experiencing miscarriage. Compared with TTP after livebirth in matching subgroups, odds of TTP > median after miscarriage rose from 1.6 (1.2–2.4) (P=0.007) in women aged <30 years to 2.5 (1.8–3.3) (P<0.001) in those aged >30 years. Likewise the odds of TTP > median after miscarriage, relative to livebirth, increased from 1.9 (1.5–2.8) (P<0.001) in women of BMI <30 kg/m2, to 3.0 (1.5–5.7) (P=0.001) in those of BMI >30 kg/m2. For fecund women the odds of TTP > median after miscarriage was 2.0 (1.5–2.7) (P<0.001) whereas for subfecund women this was 3.5 (1.6–7.7) (P=0.001). Also compared with livebirth, odds of TTP > median after EP increased and became statistically significant in women aged >30 years [4.8 (1.3–17.7), P=0.01] and those of BMI >30 kg/m2 [5.8 (1.1–30.8), P=0.02].
Previous reproductive outcome and conception rates
The CR at 6 and 12 months of discontinuing contraception after and before each outcome of the prior pregnancy were studied. At 6 months these were 71.4 and 76.7% [0.9 (0.9–1.0)] for livebirth, 58.6 and 76.7% [0.7 (0.7–0.9)] for miscarriage, 66.3 and 95.3% [0.7 (0.6–0.8)] for TOP and 55.0 and 18.2% [3.0 (1.1–8.3)] for EP. The corresponding values at 12 months are shown in Figure 2. Relative to livebirth the CR were significantly reduced after miscarriage [0.8 (0.7–0.9), P<0.001] but not before miscarriage, significantly increased before TOP [1.3 (1.2–1.3), P<0.001] but not after TOP, and significantly reduced before EP [0.2 (0.1–0.8), P<0.001] whereas reduction in CR after EP was not statistically significant [0.8 (0.5–1.2)].
Previous reproductive outcome and fecundity (Table III)
After and before each prior outcome, the subfecund proportions were 17.0 and 10.8% [1.5 (1.3–1.9), P<0.001] for livebirth, 23.7 and 13.7% [1.7 (1.2–2.4), P=0.001] for miscarriage, 16.6 and 2.3% [7.2 (1.8–29.7), P=0.02] for TOP and 35.0 and 54.4% [0.6 (0.3–1.4), P=0.5] for EP. Relative to livebirth in last pregnancy, the adjusted subfecundity OR were not increased before miscarriage 12.8 (3.6–45.0) P<0.0001 before EP; and 0.2 (0.1–0.9) P=0.04 before TOP, whereas the adjusted subfecundity OR after last pregnancy were 1.8 (1.2–2.5) (P=0.002) after miscarriage, 3.9 (1.4–11.0) (P=0.01) after EP; but OR after TOP were not different from livebirth. Relative to livebirth in matching subgroups adjusted subfecundity OR after miscarriage increased further in older women aged >30 years [2.0 (1.3–3.0), P=0.002], obese women of BMI >30 kg/m2 [3.3 (1.5–7.4), P=0.004] and those who were subfecund before miscarriage [5.6 (1.7–18.6), P=0.005]. Also adjusted subfecundity OR after EP relative to livebirth in matching subgroups rose in older [9.2 (2.7–31.7), P=0.0005] and obese women [9.8 (1.8–53.7), P=0.008].
Discussion
These results show a reduction in fecundity following but not preceding miscarriage. Subfecundity was found to predate ectopic pregnancy but subsequently fecundity tends relatively to improve. Even after excluding the contraceptive failures, those who had TOP were found to have had high fecundity, but fecundity after TOP seemed to be relatively reduced.
We chose a pregnant population (Juul et al., 1999) and studied the outcome of the very last pregnancy to minimize the recall effect on the accuracy of the gathered information. Since miscarriers are likely to continue trying for further pregnancies till achieving livebirth, then the proportion of the most recent pregnancies ending in miscarriage in a historical study would appear erroneously low compared with studies of pregnancy samples—another source of bias in the retrospective studies (Olsen, 1988; Weinberg et al., 1994). Also contrary to studies of pregnancy planners, it was relatively easy to collect a cohort of relevant size within the study period without the need for exhaustive follow-up (Olsen et al., 1998). However, studies of pregnancy samples exclude those who gave up the pregnancy attempt and exclude the minority that develop tubal subfertility, specially those who had EP secondary to pelvic inflammatory disease (PID) and tubal damage unless treated with IVF. This selection bias, though, is likely to result in under-rather than over-estimation of any negative effect of reproductive outcome on later fertility (Basso et al., 2000).
The relationship between pregnancy outcome and fecundity was studied by evaluating TTP, CR and subfecundity OR before each outcome to assess the background fecundity, then after each outcome, and comparing these with the relevant figures for livebirth to detect significant variation in later fecundity related to each outcome. Survival analysis was not used, as there are no censored data on TTP in this sample. It was felt that using the clinically relevant threshold TTP of 12 months was better than group comparisons of general time-points where Cox proportional hazards modelling might be informative. Also, as those who failed to conceive or gave up the pregnancy attempt were excluded, it is less accurate to calculate fecundability ratios based on a pregnancy sample (Jensen et al., 2000; Juul et al., 2000). Comparing CR to study the effect of adverse pregnancy outcome on fecundity is valid, however, as those who suffer such outcomes are likely to persist in trying for further pregnancies or in seeking medical help. Also calculating the odds of subfecundity in relation to pregnancy outcome provides useful relative quantification of the effect on fecundity. Whereas using mean TTP provides factual absolute quantification that can be useful in clinical terms, but with small samples (e.g. EP=20), the median provides more accurate assessment because in such cases the mean can be biased by unusual values.
Similar to other studies (Hakim et al., 1995; Gray and Wu, 2000) subfertility was found to be associated with increased risks of not only recurring subfertility but also of other adverse reproductive outcomes: miscarriage and EP. Likewise these risks were also increased in those who had similar outcomes previously (Coste et al., 1991; Gray et al., 1995; Parazzini et al., 1997). The results support the belief that there may be factors common to these unfavourable reproductive outcomes that lead to their recurrence, and one outcome may be predictive of a similar or other adverse outcomes in future pregnancy attempts (Hathout et al., 1982; Regan et al., 1989; Cauchi et al., 1991; Knudsen et al., 1991).
After miscarriage, TTP was >2-fold more likely to be longer than TTP that miscarried and subfecundity odds increased by 73%. No similar findings were detected in those who had a livebirth, reflecting specificity of the association between miscarriage and subfecundity. Before miscarriage, fecundity was not different from that before livebirth, but miscarriers compared with those who had a livebirth took significantly longer to achieve another pregnancy and were 80% more likely to experience subfecundity later. This reduction in fecundity, which occurred only after, but not preceding, miscarriage (Schaumburg and Boldsen, 1992; Joffe and Li, 1994) would indicate that this is likely to be directly related to the miscarriage.
Consistent with previous studies (Hebert et al., 1986; Smith and Buyalos, 1996; Keenan et al., 1998; Nybo et al., 2000; Wang et al., 2002) the decline in fecundity after miscarriage compared with livebirth in matching subgroups was relatively more evident in the previously subfecund and those who had risk factors for subfecundity, e.g. older women. This further substantiates the explicit association, and may suggest a possible common mechanism, of miscarriage and subfecundity. Both problems are more common in women who experience earlier menopause (Whelan et al., 1990). Persistently raised FSH levels have been found in a proportion of women experiencing both problems (Clifford et al., 1994). The association of miscarriage and subfertility can largely be explained by normal or accelerated ovarian ageing with low oocyte quality and reduced ovarian reserve that lead not only to subfertility but also to increased chromosomal aberrations and the resultant pregnancy loss (O'Connor et al., 1998; te Velde et al., 1998; Levi et al., 2001; te Velde and Pearson, 2002; Kok et al., 2003).
Evidence from studies of pre-clinical pregnancy loss after assisted conception suggest that this may be related to implantation failure due to endometrial or hormonal dysfunction (Cooke, 1988; Coulam, 1995, 1997; Schieve et al., 2003)—another common mechanism of subfertility and miscarriage. The risk of both problems was found to increase in those who have inherited thrombophilia (Bare et al., 2000) and those who have antiphospholipid antibodies. These have been shown to inhibit trophoblast differentiation (Rote, 1992), which may cause gestational failure and low pregnancy rates due to impaired implantation or may inhibit the normal growth of pregnancy causing pregnancy loss (Cowchock, 1991; Sthoeger et al., 1993). Also it has been suggested that immune effector-cell dysfunction at the materno-fetal interface may be involved in pathogenesis of implantation failure and early pregnancy loss (Johnson et al., 1999).
Miscarriers who had planned pregnancy are more likely to try sooner for another pregnancy before return of the hypothalamic–pituitary–ovarian mechanism, which may be delayed briefly in these cases secondary to psychological trauma of miscarriage, hence the apparently longer TTP and reduced fecundity after miscarriage. There is little evidence to support this hypothesis yet (Rud and Klunder, 1985) and ovulation has been observed within weeks after miscarriage.
Only 20 (1.0%) women had had EP; the incidence in a general population is likely to be higher, as those who acquired tubal subfertility after EP unless treated with IVF, and those who gave up pregnancy attempt, were excluded from this pregnancy sample. This and other studies show the strong association between subfertility and EP regardless of its management approach (Dubuisson et al., 1990; Langer et al., 1990; Fernandez et al., 1991; Pansky et al., 1993; Zohav et al., 1996; Job-Spira et al., 1999; Strobelt et al., 2000). Subfecundity was found to precede EP, which may suggest that this reduced fecundity is not directly related to EP but likely to be related to the underlying mechanism that has led to EP in the first place. PID is associated with a 7-fold higher risk of EP (Westrom and Mardh, 1990; Buchan et al., 1993) and is the most important factor of tubal infertility, which is related to number and severity of PID episodes, duration of infection and the causative microorganism (Westrom et al., 1992; Grodstein et al., 1993; Hillis et al., 1993).
A relatively favourable effect on fecundity after EP was shown by a 3-fold rise in CR and 36% fall in subfecundity odds after EP. Relative to livebirth, it also appears that the reduction in fecundity before EP (odds of: TTP> median=13.9, subfecundity=12.8) is relatively greater than after EP (odds of: TTP > median=1.8, subfecundity=3.9). This positive effect on fecundity after EP, which persisted after excluding those who conceived after fertility treatments, might be ascribed to the treatment of EP or the underlying problem. However, care should be expressed in interpreting these results, in view of the small number of EP studied and the potential selection bias.
It has been suggested that TOP may be associated with increased risk of adverse outcomes in later pregnancies (Tzonou et al., 1993; Infante-Rivard and Gauthier, 1996; Tharaux-Deneux et al., 1998; Zhou et al., 1999; Henriet and Kaminski, 2001; Sun et al., 2003; Zhou and Olsen, 2003), but its effect on later fecundity has been uncertain. Before TOP, TTP was significantly shorter than before livebirth and risk of subfecundity was reduced by 76%. This cannot be solely attributed to increased contraceptive failure, due to inconsistent contraceptive use or to using less reliable contraceptive methods, among those who had TOP, as similar results were obtained after excluding the contraceptive failures from analysis. Neither this relatively higher fecundity prior to TOP can be justified by the younger age of the women who had TOP, as the effect persisted after adjustment for individual/lifestyle factors including age. The results may possibly be explained by a genuinely high fecundity of those who experience unplanned pregnancy.
Conversely fecundity after TOP was not different from that after livebirth, but was reduced relative to fecundity before TOP (subfecundity odds=7.2). This cannot be explained by a higher ratio of contraceptive failures before TOP, as the effect remained evident after excluding these. Nor can this be justified by the older age or by lifestyle changes by the time of attempting another pregnancy after TOP, as similar results were obtained after adjusting for these and other factors. This may suggest genuine reduction in the formerly high fecundity of those who undergo TOP.
Based on these results, miscarriers should be counselled about short-term reduction in later fecundity, and earlier investigations should be considered in those who have other potential risk factors for reduced fertility, e.g. older or obese women. Further studies, preferably in a general population, are required to clarify the relatively favourable effect on fecundity following EP and the relative reduction in fecundity after TOP.
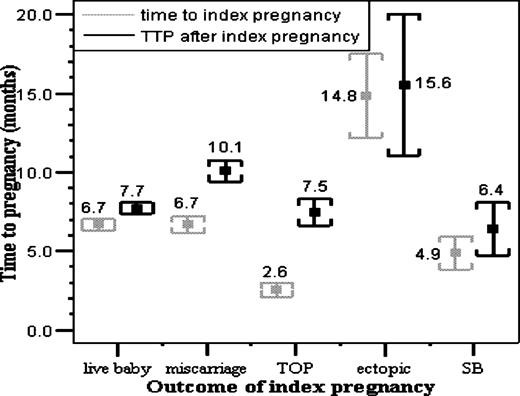
Time to the index pregnancy and the time to the following pregnancy after the index pregnancy by the outcome of the index pregnancy. Values represent the mean and the error bars represent the SEM.
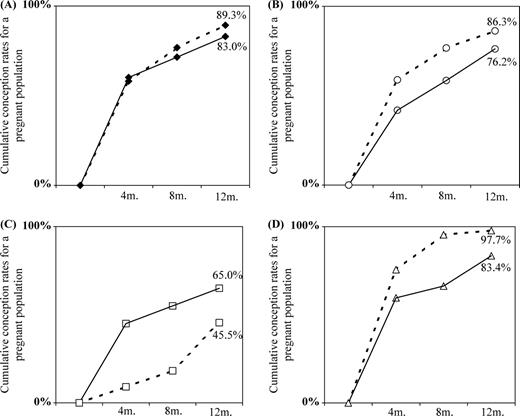
Cumulative conception rates within 1 year of discontinuing contraception before the index pregnancy (dashed lines) and after the index pregnancy (continuous lines) as follows: livebirth (A), miscarriage (B), ectopic pregnancy (C), and termination of pregnancy (D).
The probability of each pregnancy outcome for subfecund relative to fecund couples
| Outcome of index pregnancy | Odds ratio (OR) of each outcome for subfecund relative to fecund couples | ||||||
|---|---|---|---|---|---|---|---|
| Before adjustment | After adjustmenta | ||||||
| OR (95% CI) | P | OR (95% CI) | P | ||||
| Livebirth | 0.97 (0.9–1.1) | 0.6 | 0.67 (0.4–1.0) | 0.06 | |||
| Miscarriage | 1.3 (1.1–1.7) | 0.01 | 1.8 (1.1–2.8) | 0.01 | |||
| Ectopic pregnancy | 9.6 (3.0–31.2) | < 0.001 | 14.1 (4.0–50.3) | < 0.0001 | |||
| Stillbirth | 0.5 (0.1–2.1) | 0.6 | 0.44 (0.1–3.3) | 0.4 | |||
| Termination of pregnancy | 0.19 (0.1–0.8) | 0.004 | 0.30 (0.1–1.3) | 0.1 | |||
Statistical test: χ2-test; adjustment using binary logistic regression.
Factors in the regression model: women's age, body mass index, smoking (cigarettes/day), alcohol (units/week), tea–coffee (cups/day), parity, menstrual pattern, coital frequency, men's age, smoking, alcohol consumption; CI=confidence interval.
The mean time to pregnancy (TTP) before and after each pregnancy outcome compared with livebirth
| Outcome of index pregnancy | Time to pregnancy ‘months’ before adjustment | Time to pregnancy ‘months’ after adjustmenta | ||||||||||||
|---|---|---|---|---|---|---|---|---|---|---|---|---|---|---|
| Time to index pregnancy | TTP after index pregnancy | Time to index pregnancy | TTP after index pregnancy | |||||||||||
| Mean (95% CI) | P | Mean (95% CI) | P | Mean (95% CI) | P | Mean (95% CI) | P | |||||||
| Livebirth | 6.7 (6.0–7.3) | 7.7 (7.0–8.4) | 6.2 (5.5–7.0) | 7.4 (6.7–8.2) | ||||||||||
| Miscarriage | 6.7 (5.4–7.9) | 1.0 | 10.1 (8.8–11.4) | 0.002 | 7.5 (6.2–8.9) | 0.1 | 10.4 (9.0–11.8) | < 0.001 | ||||||
| Ectopic pregnancy | 14.8 (8.3–21.3) | 0.01 | 15.6 (10.1–21.0) | 0.006 | 15.6 (9.1–22.0) | 0.005 | 15.5 (10.1–20.8) | 0.004 | ||||||
| Stillbirth | 4.9 (1.2–8.6) | 0.3 | 6.4 (2.3–10.5) | 0.5 | 4.6 (0.4–8.8) | 0.5 | 6.5 (2.1–10.9) | 0.7 | ||||||
| Termination of pregnancy | 2.6 (0.2–4.9) | 0.001 | 7.5 (5.7–9.2) | 0.8 | 3.0 (0.5–5.6) | 0.02 | 8.5 (6.5–10.5) | 0.3 | ||||||
Statistical test: univariate analysis; adjustment using general linear model.
Factors in the regression model: women's age, body mass index, smoking (cigarettes/day), alcohol (units/week), tea–coffee (cups/day), parity, menstrual pattern, coital frequency, men's age, smoking, alcohol consumption; CI=confidence interval; P-values: indicate significance of difference between TTP with each outcome and livebirth; statistical significance: P<0.05.
Proportions of subfecund couples and odds ratio (OR) of subfecundity before and after each pregnancy outcome compared with livebirth
| Outcome of last pregnancy | Percentage subfecund and OR of subfecundity before and after each outcome of the index pregnancy | ||||||||||||||||||
|---|---|---|---|---|---|---|---|---|---|---|---|---|---|---|---|---|---|---|---|
| Before adjustment | After adjustmenta | ||||||||||||||||||
| Before the index pregnancy | After the index pregnancy | Before index pregnancy | After index pregnancy | ||||||||||||||||
| % | OR (95% CI) | P | % | OR (95% CI) | P | OR (95% CI) | P | OR (95% CI) | P | ||||||||||
| Livebirth | 10.8 | 17.0 | |||||||||||||||||
| Miscarriage | 13.7 | 1.3 (0.9–1.8) | 0.1 | 23.7 | 1.4 (1.1–1.7) | 0.004 | 1.8 (1.0–2.8) | 0.1 | 1.8 (1.2–2.5) | 0.002 | |||||||||
| Ectopic pregnancy | 54.5 | 5.1 (2.9–8.9) | < 0.001 | 35.0 | 2.1 (1.1–3.8) | 0.04 | 12.8 (3.6–45.0) | 0.0001 | 3.9 (1.4–11.0) | 0.01 | |||||||||
| Stillbirth | 5.9 | 0.53 (0.1–2.0) | 0.6 | 11.1 | 0.6 (0.2–1.5) | 0.4 | 0.38 (0.1–2.8) | 0.3 | 0.74 (0.2–2.6) | 0.6 | |||||||||
| Termination of pregnancy | 2.3 | 0.20 (0.1–0.8) | 0.004 | 16.6 | 0.89 (0.6–1.2) | 0.6 | 0.24 (0.1–0.9) | 0.04 | 1.1 (0.7–1.9) | 0.6 | |||||||||
Statistical test: χ2-test; adjustment using binary logistic regression.
Factors in the regression model: women's age, body mass index, smoking (cigarettes/day), alcohol (units/week), tea–coffee (cups/day), parity, menstrual pattern, coital frequency, men's age, smoking, alcohol consumption; CI = confidence interval; statistical significance: P<0.05.
References
Baird DD, Weinberg CR, Schwingl P and Wilcox AJ (
Bare SN, Poka R, Balogh I and Ajzner E (
Basso O, Juul S and Olsen J (
Bernoux A, Job-Spira N, Germain E, Coste J and Bouyer J (
Bouyer J, Job-Spira N, Pouly JL, Coste J, Germain E and Fernandez H (
Bouyer J, Coste J, Shojaei T, Pouly JL, Fernandez H, Gerbaud L and Job-Spira N (
Bromham DR and Cartmill RSV (
Buchan H, Vessey M, Goldacre M and Fairweather J (
Cauchi MN, Pepperell R, Kloss M and Lim D (
Clifford K, Rai R, Watson H and Regan L (
Cooke ID (
Coste J, Job-Spira N and Fernandez H (
Coulam CB (
Coulam CB (
Cowchock S (
Dominguez V, Calle E, Ortega P, Astasio P, Valero de Bernabe J and Rey Calero J (
Dubuisson JB, Aubriot FX, Foulot H, Bruel D, Bouquet de Joliniere J and Mandelbrot L (
El-Bastawissi AY, Sorensen TK, Akafomo CK, Frederick IO, Xiao R and Williams MA (
Fernandez H, Lelaidier C, Baton C, Bourget P and Frydman R (
Fleissig A (
Gray RH and Wu LY (
Gray RH, Simpson JL, Kambic RT, Queenan JT, Mena P, Perez A and Barbato M (
Grodstein F, Goldman MB and Cramer DW (
Hakim RB, Gray RH and Zacur H (
Hannaford P (
Hassan MA and Killick SR (
Hassan MA and Killick SR (
Hassan MA and Killick SR (
Hassan MA and Killick SR (
Hathout H, Kasrawi R, Moussa MA and Saleh AK (
Hebert CC, Bouyer J, Collin D and Menger I (
Henriet L and Kaminski M (
Hillis SD, Joesoef R, Marchbanks PA, Wasserheit JN, Cates W Jr and Westrom L (
Hogue CJ, Cates W, Jr and Tietze C (
Infante-Rivard C and Gauthier R (
Jansen RPS (
Jensen TK, Scheike T, Keiding N, Schaumburg I and Grandjean P (
Job-Spira N, Bouyer J, Pouly JL, Germain E, Coste J, Aublet-Cuvelier B and Fernandez H (
Job-Spira N, Fernandez H, Bouyer J, Pouly JL, Germain E and Coste J (
Joffe M and Li Z (
Johnson PM, Christmas SE and Vince GS (
Juul S, Karmaus W and Olsen J (
Juul S, Keiding N and Tvede M (
Keenan JA, Rizvi S and Caudle MR (
Knudsen UB, Hansen V, Juul S and Secher NJ (
Kok HS, Van Asselt KM, Van der Schouw YT, Grobbee DE, te Velde ER, Pearson PL and Peeters PH (
Kreibich H and Ehrig E (
Krohn MA, Germain M, Muhlemann K and Hickok D (
Langer R, Raziel A, Ron-El R, Golan A, Bukovsky I and Caspi E (
Levi AJ, Raynault MF, Bergh PA, Drews MR, Miller BT and Scott RT Jr (
McElrath TF and Wise PH (
Nybo Anderson AM, Wohlfahrt J, Christens P, Olsen J and Melbye M (
O'Connor KA, Holman DJ and Wood JW (
Olsen J (
Olsen J, Juul S and Basso O (
Pansky M, Bukovsky J, Golan A, Avrech O, Langer R, Weinraub Z and Caspi E (
Parazzini F, Chatenoud L, Tozzi L, Benzi G, Dal Pino D and Fedele L (
Rachootin P and Olsen J (
Regan L, Braude PR and Trembath PL (
Rud B and Klunder K (
Schaumburg I and Boldsen JL (
Schieve LA, Tatham L, Peterson HB, Toner J and Jeng G (
Skjeldestad FE and Atrash HK (
Smith KE and Buyalos RP (
Sthoeger ZM, Mozes E and Tartakovsky B (
Strobelt N, Mariani E, Ferrari L, Trio D, Tiezzi A and Ghidini A (
Sun Y, Che Y, Gao E, Olsen J and Zhou W (
te Velde ER and Pearson PL (
te Velde ER, Scheffer GJ, Dorland M, Broekmans FJ and Fauser BC (
Tharaux-Deneux C, Bouyer J, Job-Spira N, Coste J and Spira A (
Thorp JM, Jr, Hartmann KE and Shadigian E (
Tzonou A, Hsieh CC, Trichopoulos D, Aravandinos D, Kalandidi A, Margaris D, Goldman M and Toupadaki N (
Venkatacharya K (
Wang X, Chen C, Wang L, Chen D, Guang W and French J (
Wang JX, Davies MJ and Norman RJ (
Weinberg CR, Baird DD and Wilcox AJ (
Westrom L and Mardh PA (
Westrom L, Joesoef R, Reynolds G, Hagdu A and Thompson SE (
Whelan EA, Sandler DP, McConnaughey DR and Weinberg CR (
Whitley E, Doyle P, Roman E and de Stavola B (
Wilcox AJ, Weinberg CR, O'Connor JF, Baird DD, Schlatterer JP, Canfield RE, Armstrong EG and Nisula BC (
Williams MA, Goldman MB, Mittendorf R and Monson RR (
Zhou W and Olsen J (
Zhou W, Sorensen HT and Olsen J (
Zinaman MJ, Clegg ED, Brown CC, O'Connor J and Selevan SG (
