


Abstract
For decades, many authors have attempted to define the location, geometry and kinematics of the causative fault for the 1908 December 28, M 7.1 earthquake that struck the Messina Straits between Sicily and Calabria (southern Italy). The coseismic displacement caused a predominant downwarping of the Straits and small land uplift away from it, which were documented by levelling surveys performed 1 yr before and immediately after the earthquake. Most of the source models based on inversion of levelling data suggested that the earthquake was caused by a low angle, east-dipping blind normal fault, whose upper projection intersects the Earth surface on the Sicilian (west) side of the Messina Straits. An alternative interpretation holds that the causative fault is one of the high-angle, west-dipping faults located in southern Calabria, on the eastern side of the Straits, and may in large part coincide with the mapped Armo Fault. Here, we critically review the levelling data with the aim of defining both their usefulness and limits in modelling the seismogenic fault. We demonstrate that the levelling data alone are not capable of discriminating between the two oppositely dipping fault models, and thus their role as a keystone for modellers is untenable. However, new morphotectonic and geodetic data indicate that the Armo Fault has very recent activity and is accumulating strain. The surface observations, together with appraisal of macroseismic intensity distribution, available seismic tomography and marine geophysical evidence, lends credit to the hypothesis that the Armo and possibly the S. Eufemia faults are part of a major crustal structure that slipped during the 1908 earthquake.
1 INTRODUCTION
Intense Quaternary extensional tectonics, coupled with coastal uplift, are well documented in the Messina Straits (Fig. 1), a highly seismic area in the Central Mediterranean orogen that was struck on 1908 December 28 by an M 7.1 earthquake and ensuing devastating tsunami (Baratta 1910; Schick 1977). This structural depression is bounded by active normal faults, marked by well-preserved scarps, which displace Pleistocene marine terraces and Holocene shorelines (Ghisetti 1981; Valensise & Pantosti 1992; Catalano et al.2003; Ferranti et al.2007, 2008a; Di Stefano & Longhitano 2009; Scicchitano et al.2011). The lack of recognition of clear surface faulting, however, made it difficult to determine the source of the 1908 earthquake. Levelling surveys performed 1 yr before and immediately after the earthquake (Loperfido 1909) documented coseismic downthrow of the Straits, and minor coastal uplift away from it.
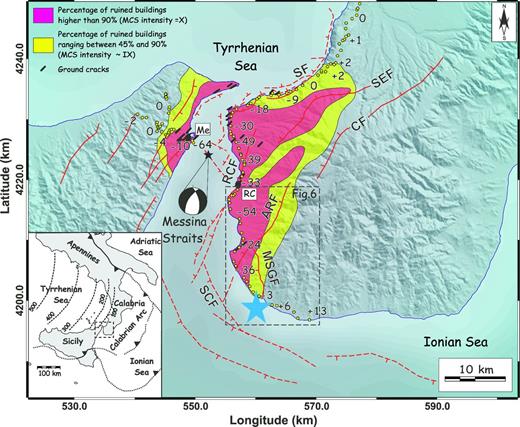
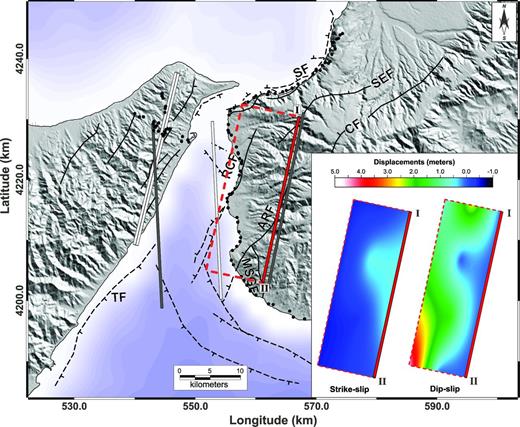
Seismotectonic setting of the Messina Straits region. Faults (thick solid lines barbed on the downthrown side, dashed where inferred or submerged) after Ghisetti (1992), Monaco & Tortorici (2000), Jacques et al. (2001), Ferranti et al. (2007), Argnani et al. (2009): ARF, Armo Fault; CF, Cittanova Fault; MSGF, Motta San Giovanni Fault; RCF, Reggio Calabria Fault; SCF, Southern Calabria Fault; SEF, S. Eufemia Fault; SF, Scilla Fault. The focal mechanism (after Gasparini et al.1985) and damage distribution of the December 1908 earthquake (data from Baratta 1910; Boschi et al.1995; Monaco & Tortorici 2007) are indicated. Towns are labelled in white boxes: RC, Reggio Calabria; Me, Messina. The projection is UTM-WGS84. The levelling data of Loperfido (1909) are reported as yellow circles with average vertical change values. The blue star shows the macroseismic location of Michelini et al. (2005). Inset shows the location of the study area in the tectonic setting of the Central Mediterranean.
By inverting the levelling data different sources have been modelled, all concurring with dominant normal faulting on planes trending nearly parallel to the Messina Straits, albeit with different locations and dip (see Amoruso et al.2002 and references therein). Because geological and seismological arguments set weak constraints and have led to conflicting interpretations of the causative source, levelling data are still advocated as the basis for the correct model (see review in Pino et al.2009).
Contrary to this common thinking, we retain that the ongoing debate on the source highlights potential pitfalls in the use of levelling data as model constraints. This possibility motivated us to carry out a novel inversion of the original data collected by Loperfido (1909) with the aim of defining their limits and usefulness. The main focus of our study was the analysis of the reliability of the levelling data as a useful tool towards an undisputed certainty about the fault source of the 1908 earthquake. As this paper will show, no definite conclusions can be drawn on the basis of the levelling data alone. With the aim of providing a meaningful contribution to the debate on the 1908 earthquake source, we also review and implement morphotectonic, geodetic and geophysical observations on the Armo Fault in Calabria, which is proposed as being part of a larger, mostly buried seismogenic source.
2 TECTONIC SETTING
The Messina Straits are located in the southern part of the Calabrian Arc which connects the Apennines and Sicily orogenic belts (inset in Fig. 1). The Calabrian Arc, which includes Calabria and the eastern side of Sicily, is a forearc terrane which was emplaced to the southeast during northwesterly subduction and roll-back of the subjacent Ionian slab (Malinverno & Ryan 1986; Neri et al. 1996, 2002, 2012). During the Late Pliocene-Quaternary, contractional structures of the hinterland part of the forearc were superseded by extensional faults which caused its fragmentation into structural highs and shallow marine sedimentary basins, including the Messina Straits (Ghisetti & Vezzani 1982; Ghisetti 1984). At present, an active swarm of normal faults runs along the Calabrian Arc and it is associated with strong seismicity (Monaco & Tortorici 2000; D'Amico et al. 2010, 2011). Current WNW–ESE-trending crustal extension is documented by focal mechanisms of earthquakes (Pondrelli et al.2006; CMT and RCMT Catalogues; Neri et al.2004), structural studies (Tortorici et al.1995; Monaco et al.1997; Monaco & Tortorici 2000; Jacques et al.2001; Ferranti et al.2007, 2008a), and geodetic velocities (D'Agostino & Selvaggi 2004; Mattia et al.2008, 2009; Serpelloni et al.2010; D'Agostino et al.2011).
Since the Middle Pleistocene, extensional tectonics has been coupled with intense regional uplift which developed flights of marine terraces (Ferranti et al.2006 and references therein). At a regional scale, uplift and extension are interpreted as a response to the stalling of slab retreat and consequent asthenospheric flow beneath the detached or delaminated crust (e.g. Westaway 1993; Gvirtzman & Nur 1999; Wortel & Spakman 2000; Doglioni et al.2001; Goes et al.2004). The absolute upward displacement of marine terraces, together with their offset across the main faults, has been used to establish the relative contribution of regional and fault-related sources to uplift. Typically, ∼1 mm yr–1 uplift of southern Calabria is attributed to regional sources and 0.5–1.0 mm yr–1 to displacement on the footwall of major faults (Westaway 1993; Ferranti et al.2007).
In southern Calabria, NE–SW to NNE–SSW striking and west-dipping normal faults dominate the neotectonic deformation scenario (Fig. 1). These faults are between 15 and 30 km long and are arranged in an en-echelon pattern (e.g. Reggio Calabria with S. Eufemia faults, and Armo with Cittanova faults, Fig. 1).
Coastal tectonic studies have shown that faults located at/or intersecting the coast (Scilla, Reggio Calabria and Armo faults) have recent activity. Late Holocene coseismic displacements on the ∼30-km long Scilla Fault (Westaway 1993; Jacques et al.2001) are suggested by Holocene marine platforms and beachrocks which are uplifted above sea level on the fault footwall (Ferranti et al.2007, 2008a). The latter authors dated two co-seismic events at ∼3.5 and ∼1.9 ky BP, with estimated slips ranging between 1.5 and 2.0 m and Me ∼6.9–7.0. The Reggio Calabria Fault (Ghisetti 1984, 1992) was considered the source of the 1908 earthquake by Tortorici et al. (1995) on the basis of morphotectonic, macroseismic and seismological observations, but evidence of active deformation is scarce. In contrast, the Armo Fault shows clearer evidence of Pleistocene activity (Ghisetti 1984, 1992), and coastal studies suggest a possible reactivation during the Holocene (Scicchitano et al.2011).
Marine geophysical investigations (Del Ben et al.1996; Guarnieri 2006; Ferranti et al.2008b; Argnani et al.2009) also highlight the prevalence of active faults on the eastern part of the Straits. High-resolution swath bathymetry data and multichannel sparker profiles (Ferranti et al.2008b) show that recent faults in the northern and narrower sector of the Straits are arranged in two broad ∼NE–SW trending arrays with opposing polarity (Fig. 1). The NW-dipping fault array on the eastern side of the Straits, which represents the offshore extension of the Scilla and Reggio Calabria faults, is wider (∼5 km), and large offsets of tens of metres are observed in the Middle Pleistocene–Holocene sedimentary sequence (Ferranti et al.2008b). By contrast, the fault swarm on the western side has more limited appearance and is made up of discontinuous segments. The arrays are connected by a NW–SE trending transfer zone located between Messina and Reggio Calabria (Fig. 1), which seems to control the current release of low seismicity (Scarfì et al.2009).
Similarly, multichannel seismic profiles collected by Argnani et al. (2009) within the southern, broader part of the Messina Straits place the master faults on the Calabrian side. Specifically, a 30-km long, NW-striking and west-dipping listric fault located at the SW tip of Calabria cuts the seafloor (SCF, Fig. 1). According to Argnani et al. (2009), the lack of evidence of extensional faults large enough to cause an M ∼ 7 earthquake within the northern and western sector of the Straits support the contention that the 1908 seismogenic fault is located along the south Calabria offshore.
3 THE 1908 EARTHQUAKE: HISTORIC CATASTROPHE AND SOURCE-CONSTRAINING DATA
The 1908 December 28 was one of the largest historical earthquakes that ever occurred in southern Italy, and completely destroyed the Messina Straits area, killing about 70 000 people (Baratta 1910). The area devastated by the main shock (Mercalli–Cancani–Sieberg (MCS) – intensity XI and M = 7.1–7.2; Postpischl 1985; Boschi et al.1995, 1997; CPTI Working Group 2004) was mostly located on the Calabrian side and extended on the Sicilian coast only along a narrow belt (Fig. 1).
The macroseismic scenario adequately fits the tectonic structure of the Straits. In Calabria, the mesoseismal area (Baratta 1910; Boschi et al.1995; Monaco & Tortorici 2007) formed two wide, NE-oriented lobes, with the northern and the southern lobe lying in the hangingwall of the Armo and of the Reggio Calabria and S. Eufemia faults, respectively (Fig. 1). Towns and villages located within this area (including the town of Reggio Calabria) were completely destroyed, suffering damage ascribed to an MCS intensity ≥X (Boschi et al.1995). Environmental effects of the earthquake are reported on both sides of the Straits, but ground cracks and coastline retreats are concentrated in southern Calabria and spatially coincide with the mapped faults (Blumetti et al.2008). Notably, ground cracks extensively developed in the hangingwall of the Armo, Reggio Calabria and Scilla faults, and were in close proximity and parallel to fault traces (Fig. 1). In Sicily, the mesoseismal area was confined near the coast along a 1–4-km wide belt where the town of Messina and surrounding villages were completely ruined by shaking and by the ensuing tsunami. Arc shaped fractures affected the quay of the Messina harbour, but they were ascribed to the surface reactivation at the crown of a submarine landslide (Baratta 1910).
Since the pioneering work of Schick (1977), an intense exploitation of the levelling data published by Loperfido (1909) was carried out by several authors (review in Pino et al.2009). The levelling data showed a significant subsidence (down to −70 cm) on both coasts of the Messina Straits, a small uplift in northern Calabria (up to +3 cm), a larger uplift in southern Calabria (up to +13 cm) and, finally, no significant variations approaching the mountain ranges of the Sicilian side (Fig. 1). The accuracy of the levelling data was estimated in the order of ±3 mm| $ \sqrt s$| (about 0.005 m), where s is the length of the path in kilometres. Four benchmarks located in a very small area (about 1.0 × 1.5 km2) within the Messina harbour showed the peak subsidence between −64 and −70 cm, much larger than the maximum of −58 cm recorded on the Calabrian side. The reliability of these four benchmarks and the advisability of their use in the modelling inversion have been questioned, and they are no longer used in modelling (Boschi et al.1989; Pino et al.2000). Loperfido himself remarked that their peculiar behaviour was likely due to the presence of loose deposits and local landslides, as outlined earlier.
Although today the Messina Straits area only witnesses a weak seismic release, instrumental seismicity is consistent with the geological structure (Fig. 2). Scarfì et al. (2009) have investigated 360 earthquakes (with a magnitude ranging from 1.0 to 3.8) recorded between 1999 and 2007 in the area of the Messina Straits. This work showed that earthquake clusters concentrate in southern Calabria along prevailing NNE–SSW and NE–SW directions, at depths between 8 and 15 km. Moreover, Scarfì et al. (2009) presented a new tomographic model between 6 and 18 km depth that highlights lateral heterogeneities in the seismic velocity, supportive of the presence in southern Calabria of crustal faults striking from NNE–SSW to NE–SW. Fault-plane solutions are mostly characterized by normal fault mechanisms along the same directions (Fig. 2). In this framework, the geological setting and the pattern defined by earthquake distribution, focal mechanisms and tomography are consistent.
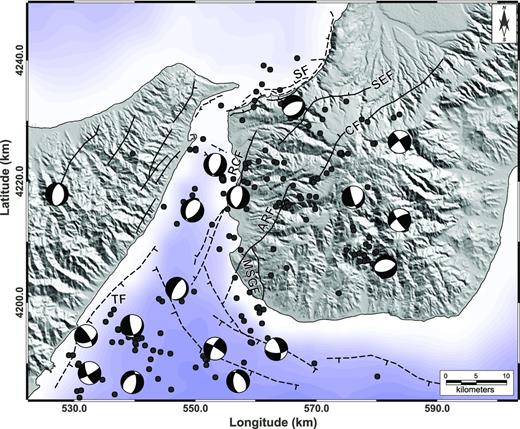
Recent seismicity (1999–2007) in the Messina Straits area (redrawn from Scarfì et al.2009). The projection is UTM-WGS84.
GPS geodetic velocity fields are not yet able to constrain the detailed geometry of major active structures, but they do show consistent patterns of intersite residuals indicative of WNW–ESE extensional strain accumulation across modelled faults (D'Agostino & Selvaggi 2004; Serpelloni et al.2005, 2010; Mattia et al.2006, 2008, 2009). Mattia et al. (2009) modelled the computed strain to estimate a ∼5 mm yr–1 slip rate across an NE–SW striking composite source in the Straits. Moreover, the authors have evidenced how the complex strain pattern in the Straits area can hardly be attributed to simple fault geometry and suggest that the observed interseismic strain is partitioned between multiple structures. On the other hand, according to Serpelloni et al. (2010), the geodetic velocity field of the Straits is compatible with a SE-dipping low-angle blind fault with a 3.5 mm yr–1 slip rate, although estimation of the exact slip rate magnitude is hampered by the unknown contribution of surrounding faults (the outcropping southern Calabria faults and a modelled subduction plate interface) to the total velocity field.
4 PUBLISHED MODELS ON THE 1908 FAULT RUPTURE
The models proposed for the 1908 earthquake source show a significant spread in fault parameters, in particular concerning strike, dip and length of the fault (Schick 1977; Caputo 1979; Mulargia & Boschi 1983; Bottari et al.1986; Capuano et al.1988; Boschi et al.1989; De Natale & Pingue 1991; Valensise & Pantosti 1992; Piatanesi et al.1999; Tinti et al.1999; Pino et al.2000; Amoruso et al.2002; Michelini et al.2005; see also the review in Pino et al.2009).
Based on inversion of the levelling data, a model represented by displacement on two normal faults, namely a low-angle, east-dipping fault on the Sicilian side of the Straits, and a high angle, west-dipping fault on the Calabrian side, was initially envisaged (Mulargia & Boschi 1983). Successively, most of the inversion models proposed for the causative fault show various geometric realizations of the east-dipping blind low-angle fault (Capuano et al.1988; Boschi et al.1989; De Natale & Pingue 1991; Valensise & Pantosti 1992; Amoruso et al.2002; Valensise et al.2008). Numerical modelling simulations on the basis of the east-dipping fault (Tinti & Armigliato 2001, 2003) show that the tsunamigenic earthquake source must be placed under the Messina Straits, where it caused subsidence of the seafloor, and extend under the Ionian Sea south of the Straits.
A methodological improvement in the search of the causative fault was provided by Amoruso et al. (2002), who applied a non-linear approach for deriving the faulting mechanism by inverting simultaneously P-wave first arrivals and levelling data. This approach has important implications on the reliability of the different models, discussed later on, because seismicity data improve the estimation of strike, dip and slip of the source fault, whereas the geodetic data determine the location, the width and the fault length (Tralli & Tajima 1993). The model preferred by Amoruso et al. (2002) envisages a ∼30-km long ∼N–S striking fault right along the Straits. On the other hand, with the aim of evaluating the expected shaking to the pillars of a planned bridge over the Straits, Brancaleoni et al. (2009) proposed a summary model centred on the east-dipping fault.
According to a different view, based on the macroseismic scenario and on structural and morphotectonic data, the 1908 event can be related to rupture along the NE trending, west-dipping faults on the Calabrian side of the Straits, including their submerged extension (Fig. 1; Schick 1977; Ghisetti 1984, 1992; Bottari et al.1986; Westaway 1992; Tortorici et al.1995; Bottari 2008). In fact, the area of greatest damage was located in Calabria (Fig. 1), where subsidence and ground fractures were recorded (Monaco & Tortorici 2007; Blumetti et al.2008). This second interpretation is compatible with the geological structure of the Messina Straits area, characterized by master faults on the Calabrian side (Ghisetti 1984; Montenat et al.1991; Tortorici et al.1995; Ferranti et al.2008a), and by larger long- and short-term uplift patterns in southern Calabria than in northeast Sicily (Catalano et al.2003; Ferranti et al.2007). However, analogue modelling of the structural architecture of the Straits (Bonini et al.2011), suggests that the high-angle normal faults of southern Calabria represent antithetic structures developed in the hangingwall of, and linked to, a low-angle east-dipping master fault, which is envisaged as responsible for the 1908 earthquake.
In summary, in light of the lack of evidence for surface faulting, the 1909 relevelling data have played a key role in source models, particularly the most popular ones claiming an east-dipping source. By contrast, west-dipping source models have mostly relied on the geological structure. The model of Valensise et al. (2008) is representative of the east-dipping models proposed in literature and therefore, in our analysis, we chose this model as a ‘landmark’.
5 INVERSION OF LEVELLING DATA
5.1 Inversion models
In this section, by using the Genetic Algorithms (GA; Goldberg 1989) and the Pattern Search (Lewis & Torczon 1999) approaches, we propose a critical examination of the levelling data modelling and we estimate the confidence in the results carrying out a sensitivity analysis. Our analyses showed the presence of two minima (Table 2): (1) a normal fault, located near the Sicilian coast similar to the model proposed by Valensise et al. (2008); (2) a shallow normal fault west-dipping located near to the Armo Fault. Successively, we fixed the dip angle to the value of 60°, compatible with field (Ghisetti 1992; Tortorici et al.1995) and tomography (Scarfì et al.2009) constraints on the Armo Fault zone. We obtained two new constrained minima that still fit the levelling data well (Table 2). Moreover, we carry out a sensitivity analysis on the four obtained minima (see Paragraph 6).
UTM coordinates and measured height variations of levelling benchmarks (Loperfido 1909).
| Benchmark | Longitude | Latitude | Uplift (m) |
|---|---|---|---|
| 1 | 578 333 | 4 253 798 | 0.000 |
| 2 | 578 513 | 4 253 572 | −0.001 |
| 3 | 578 053 | 4 253 156 | 0.001 |
| 4 | 577 796 | 4 252 767 | 0.001 |
| 5 | 577 778 | 4 251 928 | 0.005 |
| 6 | 577 316 | 4 251 077 | 0.002 |
| 7 | 577 106 | 4 250 427 | 0.002 |
| 8 | 576 949 | 4 249 639 | −0.002 |
| 9 | 575 993 | 4 248 946 | −0.006 |
| 10 | 575 840 | 4 247 721 | −0.001 |
| 11 | 575 537 | 4 247 086 | 0.001 |
| 12 | 575 595 | 4 245 968 | 0.003 |
| 13 | 575 340 | 4 245 445 | 0.014 |
| 14 | 575 496 | 4 244 839 | 0.022 |
| 15 | 575 068 | 4 244 273 | 0.027 |
| 16 | 574 772 | 4 243 797 | 0.027 |
| 17 | 574 535 | 4 243 619 | 0.028 |
| 18 | 573 529 | 4 243 042 | 0.019 |
| 19 | 574 236 | 4 241 910 | −0.008 |
| 20 | 573 517 | 4 241 055 | 0.022 |
| 21 | 573 279 | 4 239 941 | 0.026 |
| 22 | 573 063 | 4 239 648 | 0.022 |
| 23 | 572 492 | 4 239 668 | 0.021 |
| 24 | 572 326 | 4 238 967 | 0.018 |
| 25 | 571 977 | 4 238 164 | 0.011 |
| 26 | 571 288 | 4 238 227 | 0.001 |
| 27 | 571 248 | 4 238 037 | −0.002 |
| 28 | 570 718 | 4 237 487 | 0.001 |
| 29 | 567 789 | 4 235 974 | −0.021 |
| 30 | 566 937 | 4 234 959 | −0.037 |
| 31 | 565 711 | 4 234 562 | −0.058 |
| 32 | 565 071 | 4 234 362 | −0.080 |
| 33 | 563 515 | 4 233 550 | −0.093 |
| 34 | 562 601 | 4 233 987 | −0.124 |
| 35 | 562 401 | 4 233 597 | −0.130 |
| 36 | 560 337 | 4 233 650 | −0.157 |
| 37 | 559 958 | 4 233 397 | −0.184 |
| 38 | 558 890 | 4 232 700 | −0.180 |
| 39 | 558 400 | 4 232 350 | −0.222 |
| 40 | 556 432 | 4 231 839 | −0.253 |
| 41 | 555 948 | 4 231 255 | −0.259 |
| 42 | 555 912 | 4 230 789 | −0.288 |
| 43 | 555 650 | 4 229 231 | −0.299 |
| 44 | 555 513 | 4 228 209 | −0.389 |
| 45 | 555 639 | 4 227 789 | −0.425 |
| 46 | 555 959 | 4 227 444 | −0.383 |
| 47 | 556 379 | 4 226 494 | −0.384 |
| 48 | 556 667 | 4 225 574 | −0.485 |
| 49 | 556 902 | 4 224 544 | −0.332 |
| 50 | 556 952 | 4 224 374 | −0.354 |
| 51 | 557 549 | 4 223 658 | −0.358 |
| 52 | 558 140 | 4 223 217 | −0.383 |
| 53 | 558 100 | 4 223 017 | −0.386 |
| 54 | 558 080 | 4 222 777 | −0.357 |
| 55 | 557 665 | 4 221 673 | −0.297 |
| 56 | 557 802 | 4 220 924 | −0.417 |
| 57 | 557 115 | 4 218 678 | −0.325 |
| 58 | 556 632 | 4 217 928 | −0.383 |
| 59 | 556 422 | 4 217 658 | −0.380 |
| 60 | 556 122 | 4 217 688 | −0.460 |
| 61 | 555 357 | 4 216 985 | −0.522 |
| 62 | 555 397 | 4 216 455 | −0.540 |
| 63 | 555 527 | 4 215 425 | −0.581 |
| 64 | 556 376 | 4 213 882 | −0.502 |
| 65 | 557 194 | 4 213 308 | −0.481 |
| 66 | 556 986 | 4 211 718 | −0.354 |
| 67 | 557 583 | 4 210 746 | −0.241 |
| 68 | 557 564 | 4 210 126 | −0.288 |
| 69 | 557 722 | 4 209 133 | −0.305 |
| 70 | 557 006 | 4 208 464 | −0.392 |
| 71 | 556 200 | 4 206 944 | −0.336 |
| 72 | 556 301 | 4 206 146 | −0.359 |
| 73 | 557 522 | 4 204 081 | −0.232 |
| 74 | 557 770 | 4 203 470 | −0.152 |
| 75 | 558 438 | 4 202 647 | −0.088 |
| 76 | 559 065 | 4 201 873 | −0.067 |
| 77 | 559 822 | 4 201 072 | −0.026 |
| 78 | 562 263 | 4 199 217 | −0.071 |
| 79 | 563 229 | 4 199 209 | 0.043 |
| 80 | 566 350 | 4 198 159 | 0.131 |
| 81 | 566 975 | 4 197 000 | 0.128 |
| 82 | 569 175 | 4 197 246 | 0.126 |
| 83 | 543 623 | 4 229 562 | 0.000 |
| 84 | 543 403 | 4 229 062 | 0.002 |
| 85 | 544 153 | 4 228 972 | −0.005 |
| 86 | 544 904 | 4 228 540 | −0.078 |
| 87 | 545 064 | 4 228 290 | −0.040 |
| 88 | 545 204 | 4 228 500 | −0.053 |
| 89 | 545 404 | 4 228 760 | −0.065 |
| 90 | 545 384 | 4 229 010 | −0.066 |
| 91 | 545 504 | 4 229 350 | −0.068 |
| 92 | 545 794 | 4 229 430 | −0.097 |
| 93 | 546 194 | 4 229 450 | −0.127 |
| 94 | 548 489 | 4 228 336 | −0.663 |
| 95 | 548 329 | 4 227 546 | −0.710 |
| 96 | 549 723 | 4 227 414 | −0.675 |
| 97 | 549 483 | 4 227 749 | −0.644 |
| 98 | 543 523 | 4 229 732 | −0.003 |
| 99 | 543 300 | 4 230 175 | −0.003 |
| 100 | 543 361 | 4 230 499 | −0.026 |
| 101 | 541 534 | 4 231 265 | −0.021 |
| 102 | 540 854 | 4 231 305 | −0.024 |
| 103 | 540 051 | 4 231 783 | −0.029 |
| 104 | 543 723 | 4 229 732 | 0.007 |
| 105 | 543 873 | 4 229 892 | 0.005 |
| 106 | 544 258 | 4 230 339 | 0.004 |
| 107 | 545 286 | 4 232 110 | −0.005 |
| 108 | 545 346 | 4 232 800 | −0.014 |
| 109 | 545 426 | 4 233 150 | −0.011 |
| 110 | 544 980 | 4 234 464 | −0.008 |
| 111 | 544 816 | 4 234 798 | −0.010 |
| 112 | 544 684 | 4 234 830 | −0.013 |
| 113 | 544 850 | 4 235 122 | −0.010 |
| 114 | 544 699 | 4 235 240 | −0.003 |
Estimated models parameters and uncertainties calculated using the Jackknife method.
| Model of Valensise | Calabrian source | Sicilian source | Calabrian source | Sicilian source | |
|---|---|---|---|---|---|
| et al. (2008) | (free case) | (free case) | (dip fixed) | (dip fixed) | |
| Xcentre | 545 484.7 m | 566 031.4 ± 1113.4 m | 551 651.1 ± 2025.6 m | 564 321.6 ± 6622.8 m | 554 357.6 ± 3764.0 m |
| Ycentre | 4 215 624.7 m | 4 216 036.3 ± 1617.7 m | 4 214 259.3 ± 1905.1 m | 4 216 068.3 ± 2512.2 m | 4 214 511.3 ± 2338.7 m |
| Depth-top | −3 000.0 m | −339.4 ± 224.9 m | −3253.5 ± 864.9 m | −171.5 ± 643.1 m | 0.0 ± 1895.1 m |
| Azimuth | N20.0° | −N172.7° ± 6.4° | −N1.8° ± 5.7° | −N172.0° ± 90.1° | −N2.4° ± 55.0° |
| Dip | 29.0° | 24.3° ± 2.0° | 17.6° ± 7.4° | 60.0° (fixed) | 60.0° (fixed) |
| Length | 40 000 m | 29 486.2 ± 397.9 m | 30 152.9 ± 1237.4 m | 27 905.9 ± 3059.8 m | 29 449.6 ± 2574.8 m |
| Width | 20 000 m | 27 646.6 ± 1531.5 m | 19 411.2 ± 2362.8 m | 21 254.0 ± 4246.1 m | 13 450.0 ± 3140.1 m |
| Strike-slip | 0.000 m | 0.100 ± 0.224 m | −0.470 ± 0.222 m | 0.266 ± 0.357 m | −1.000 ± 0.233 m |
| Dip-slip | 1.420 m | 1.227 ± 0.102 m | 1.294 ± 0.138 m | 1.125 ± 0.249 m | 0.717 ± 0.310 m |
| Opening | 0.000 m | 0.000 m (fixed) | 0.000 m (fixed) | 0.0 m (fixed) | 0.0 m (fixed) |
| WRMSE | 219 | 120 | 59 | 163 | 116 |
| M0 (N*m) | 3.41E+19 | 3.01E+19 | 2.42E+19 | 2.06E+19 | 1.46E+19 |
| MW | 6.99 | 6.95 | 6.89 | 6.84 | 6.74 |
| FM |  |  | 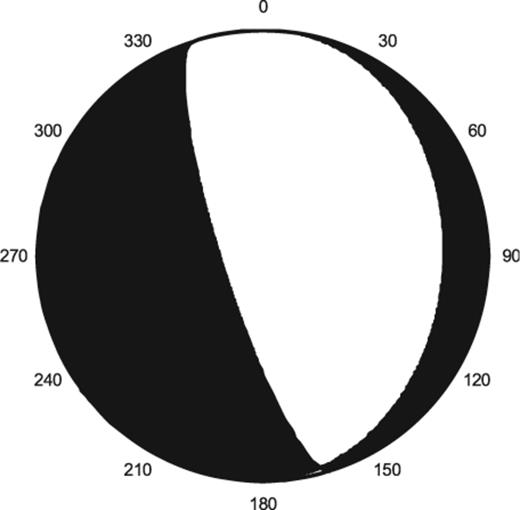 | 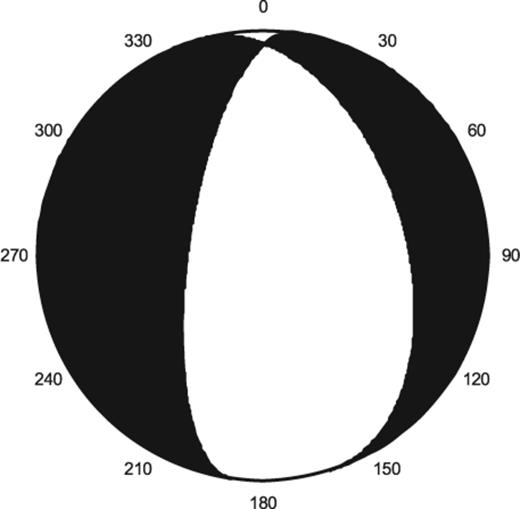 | 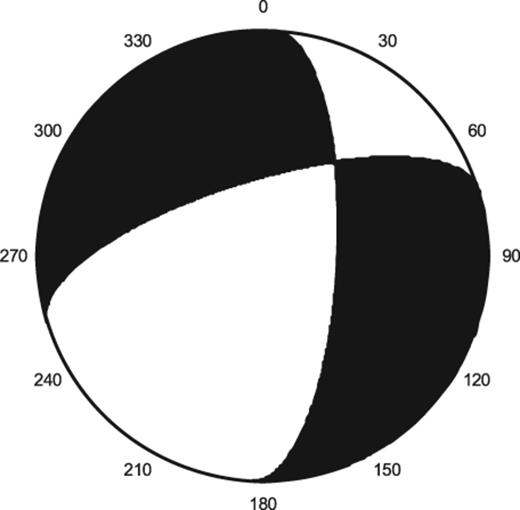 |
| Model of Valensise | Calabrian source | Sicilian source | Calabrian source | Sicilian source | |
|---|---|---|---|---|---|
| et al. (2008) | (free case) | (free case) | (dip fixed) | (dip fixed) | |
| Xcentre | 545 484.7 m | 566 031.4 ± 1113.4 m | 551 651.1 ± 2025.6 m | 564 321.6 ± 6622.8 m | 554 357.6 ± 3764.0 m |
| Ycentre | 4 215 624.7 m | 4 216 036.3 ± 1617.7 m | 4 214 259.3 ± 1905.1 m | 4 216 068.3 ± 2512.2 m | 4 214 511.3 ± 2338.7 m |
| Depth-top | −3 000.0 m | −339.4 ± 224.9 m | −3253.5 ± 864.9 m | −171.5 ± 643.1 m | 0.0 ± 1895.1 m |
| Azimuth | N20.0° | −N172.7° ± 6.4° | −N1.8° ± 5.7° | −N172.0° ± 90.1° | −N2.4° ± 55.0° |
| Dip | 29.0° | 24.3° ± 2.0° | 17.6° ± 7.4° | 60.0° (fixed) | 60.0° (fixed) |
| Length | 40 000 m | 29 486.2 ± 397.9 m | 30 152.9 ± 1237.4 m | 27 905.9 ± 3059.8 m | 29 449.6 ± 2574.8 m |
| Width | 20 000 m | 27 646.6 ± 1531.5 m | 19 411.2 ± 2362.8 m | 21 254.0 ± 4246.1 m | 13 450.0 ± 3140.1 m |
| Strike-slip | 0.000 m | 0.100 ± 0.224 m | −0.470 ± 0.222 m | 0.266 ± 0.357 m | −1.000 ± 0.233 m |
| Dip-slip | 1.420 m | 1.227 ± 0.102 m | 1.294 ± 0.138 m | 1.125 ± 0.249 m | 0.717 ± 0.310 m |
| Opening | 0.000 m | 0.000 m (fixed) | 0.000 m (fixed) | 0.0 m (fixed) | 0.0 m (fixed) |
| WRMSE | 219 | 120 | 59 | 163 | 116 |
| M0 (N*m) | 3.41E+19 | 3.01E+19 | 2.42E+19 | 2.06E+19 | 1.46E+19 |
| MW | 6.99 | 6.95 | 6.89 | 6.84 | 6.74 |
| FM | | | | | |
Estimated models parameters and uncertainties calculated using the Jackknife method.
| Model of Valensise | Calabrian source | Sicilian source | Calabrian source | Sicilian source | |
|---|---|---|---|---|---|
| et al. (2008) | (free case) | (free case) | (dip fixed) | (dip fixed) | |
| Xcentre | 545 484.7 m | 566 031.4 ± 1113.4 m | 551 651.1 ± 2025.6 m | 564 321.6 ± 6622.8 m | 554 357.6 ± 3764.0 m |
| Ycentre | 4 215 624.7 m | 4 216 036.3 ± 1617.7 m | 4 214 259.3 ± 1905.1 m | 4 216 068.3 ± 2512.2 m | 4 214 511.3 ± 2338.7 m |
| Depth-top | −3 000.0 m | −339.4 ± 224.9 m | −3253.5 ± 864.9 m | −171.5 ± 643.1 m | 0.0 ± 1895.1 m |
| Azimuth | N20.0° | −N172.7° ± 6.4° | −N1.8° ± 5.7° | −N172.0° ± 90.1° | −N2.4° ± 55.0° |
| Dip | 29.0° | 24.3° ± 2.0° | 17.6° ± 7.4° | 60.0° (fixed) | 60.0° (fixed) |
| Length | 40 000 m | 29 486.2 ± 397.9 m | 30 152.9 ± 1237.4 m | 27 905.9 ± 3059.8 m | 29 449.6 ± 2574.8 m |
| Width | 20 000 m | 27 646.6 ± 1531.5 m | 19 411.2 ± 2362.8 m | 21 254.0 ± 4246.1 m | 13 450.0 ± 3140.1 m |
| Strike-slip | 0.000 m | 0.100 ± 0.224 m | −0.470 ± 0.222 m | 0.266 ± 0.357 m | −1.000 ± 0.233 m |
| Dip-slip | 1.420 m | 1.227 ± 0.102 m | 1.294 ± 0.138 m | 1.125 ± 0.249 m | 0.717 ± 0.310 m |
| Opening | 0.000 m | 0.000 m (fixed) | 0.000 m (fixed) | 0.0 m (fixed) | 0.0 m (fixed) |
| WRMSE | 219 | 120 | 59 | 163 | 116 |
| M0 (N*m) | 3.41E+19 | 3.01E+19 | 2.42E+19 | 2.06E+19 | 1.46E+19 |
| MW | 6.99 | 6.95 | 6.89 | 6.84 | 6.74 |
| FM | | | | | |
Our analyses showed the presence of two minima (Table 2; Fig. 3): (1) a ∼3-km deep normal fault, located near the Sicilian coast, with a very low angle (17.6°) easterly dip, that we label as the ‘Sicilian source’; note that this fault is not geometrically coincident with the model of Valensise et al. (2008), which is located further north and is clockwise rotated (Fig. 3); (2) a shallow normal fault, also with a low angle (24.3°) but west-dipping, which is spatially aligned along its southern two-thirds of length with the Armo Fault (and for this reason we label it ‘Calabrian source’).
Schematic map of the modelled faults for the 1908 earthquake. Solid lines indicate the intersection between the fault planes and the ground surface: the white double line represents the model proposed by Valensise et al. (2008); the dark grey single lines represent two solutions obtained without constraints on the fault parameters (free case; Table 2); the light grey and red single lines represent the two solutions obtained fixing the dip angle to the value of 60°. Black lines indicate the geological fault traces (dashed where inferred or submerged, ticks on the downthrown block). Black circles indicate the levelling point measured by Loperfido (1909). Inset shows the strike-slip and the dip-slip component for the Armo Fault modelled with the dip fixed to 60° (line tipped with notation I and II), calculated by dividing the dislocation surface into a grid of uniformly sized blocks of 7 km × 7 km. The results are projected on the ground surface. The projection is UTM-WGS84.
In a following step, we tried to constrain the ‘free’ inversion results using geological information; for this reason we fixed the dip angle of the west-dipping source (Calabrian source) to the value of 60°. The dip value for the west-dipping source is compatible with field (Ghisetti 1992; Tortorici et al.1995) and tomographic (Scarfì et al.2009) constraints on the Armo Fault (Figs 1 and 3). Moreover, without a support of field constraints but just for the sake of completeness of our analysis, also for the east-dipping source (Sicilian source) we tried to fix the dip angle to the value of 60°. For a dip angle of 60°, we obtained the two solutions reported in Table 2 and Fig. 3.
The trace of the Sicilian source is now shifted ∼10 km eastwards and is set right along the Straits (Fig. 3); it is characterized by a large strike-slip component of about 1 m and by a smaller dip-slip component of 0.7 m (Table 2). This behaviour is not coherent with the focal mechanism calculated from the seismic data (Pino et al.2009). This peculiar attempt, as above-mentioned performed only for the sake of completeness, simply demonstrates that, as found by many authors and considering the seismological parameters, if the 1908 causative fault is located on the Sicilian side of the Messina Strait, it must necessarily have a low dip angle.
On the contrary, the Calabrian source modelled fixing the dip angle to the value of 60° and then constrained by field and tomographic knowledge, shows an extensional kinematics, consistent with the 1908 earthquake focal mechanism (Table 2; Fig. 1). Therefore, we decided to better define the displacement on the Calabrian source with the dip angle fixed to 60° by analysing the strike-slip and the dip-slip components with more detail. After dividing the obtained dislocation surface into a grid of uniformly sized blocks of 7 km × 7 km, we inverted for the strike-slip and the dip-slip component solely. The results are shown in the inset of Fig. 3. We can observe that the highest mean dip-slip value of about 4.0 m was reached on the SW corner of the fault, decreasing rapidly to 2.5 m moving towards NE on the fault plane. Note that a patch of high dip-slip is also present in the northern part of the modelled fault.
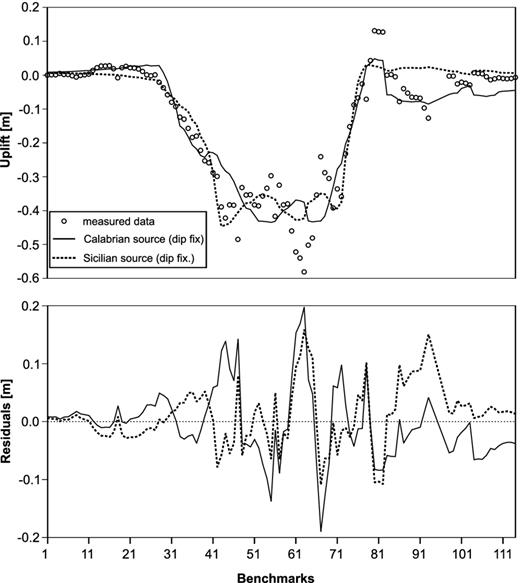
It is noteworthy that both the minima (homogeneously slipping Sicilian and Calabrian sources; Table 2) obtained fixing the dip angle to a value of 60° fit the observed data well (Fig. 4), though, as said before, the procedure to fix the dip angle for the Sicilian source has no geological and/or seismological basis but it was performed solely for completeness of our analysis. This result simply demonstrates that the levelling data alone are not a reliable constraint to produce ultimate models. We will explore this topic further in the next paragraph by means of sensitivity analyses.
5.2 Geodetic and seismological moment parameters
For each source reported in Table 2, both seismic moment and moment magnitude were estimated. The seismic moment was estimated using the relationship M0 = μsLH, where μ is the shear modulus of the rocks involved in faulting, with assigned value of 30 GPa, L and H are length and downdip height of the dislocation along which faulting occurred and s is the average displacement on the dislocation (Aki & Richards 2002). The moment magnitude was estimated using the relationship | $ M_{\rm w} = \frac{2}{3}\log _{10} \left( {M_0 } \right) - 10.7$| (Hanks & Kanamori 1979). We found that all the modelled sources have seismic moment and magnitude slightly lower than that obtained by Valensise et al. (2008) (see Table 2).
Discrepancies are encountered when trying to match our geodetically modelled parameters with those derived from instrumental seismology. In the past, many authors attempted an estimation of the focal mechanism associated to the 1908 earthquake, but the poor azimuth coverage and the distance of the seismic stations did not permit an unambiguous distinction between different mechanisms (Pino et al.2000). The limitation of the seismic data is clearly reflected in the high variability that different authors, using different methods, have attributed to other parameters, such as the seismic moment and the magnitude of the catastrophic event. One recent estimation of these last parameters using seismological data (Pino et al.2000) suggests a seismic moment of 5.38 (±2.16) × 1019 N m and Mw = 7.1. The difference with the values summarized in Table 2 can partly be ascribed to the uncertainties related to the depth of the rupture process and to errors in the instrumental natural period for the seismological data. Obviously, the seismological data do not clarify whether the total seismic moment incorporates multiple ruptures occurring on different faults or on different segments of the same fault system. On the other hand, the main limitation on the geodetic estimation of these parameters is always related to the inverted data. Indeed, the coverage of the levelling network does not include the offshore area, and the natural consequence of this limitation is an underestimation of the length of the seismogenic fault if part of the rupture occurred beneath the seafloor.
6 COMPARISON OF MODELS AND SENSITIVITY ANALYSIS
As aforementioned, the main focus of our study was the analysis of the reliability of the levelling data as a useful tool to model the 1908 earthquake. Therefore, we carried out a sensitivity analysis for all the minima obtained in this manuscript (Table 2; Fig. 3). Successively, in comparison with some representative published models (Capuano et al.1988; Amoruso et al.2002; Valensise et al.2008), we measured the goodness of fit of the Calabrian source modelled with the dip angle fixed to a value of 60° (Table 2; Fig. 3).
In particular, the reliability of our results was investigated by exploring first some goodness-of-fit indices and secondly two kinds of sensitivity: one inspired by the ‘computer-based ranging’ approach (Chinneck 2000) and is a so called ‘local’ sensitivity analysis because it refers to the sensitivity of parameters with respect to a given parameter set, and one based on global analysis of all the model parameters.
We analysed the statistical properties of our model in comparison with some representative published models (Amoruso et al.2002—model ‘A’ with uniform slip—fig. 5 of their paper; Capuano et al.1988; Valensise et al.2008). With the aim of making an impartial comparison, we used the case with uniform slip for the four models. In particular, the approach proposed here to estimate the goodness of fit for the models taken into account is a statistically based analysis on the distribution of the model residuals. This analysis seeks to evaluate the capacity of the data to constrain a particular model. To this end, we calculated ten parameters to measure the goodness of fit of each model. The goodness of fit of a model describes how well it fits a set of observations. Table 3 shows the results.
Goodness-of-fit analyses. In the rows are the considered fault models and in the columns are the outcomes of the performed analyses. In bold the best values.
| Fisher | Residue | Residue | Residue | Residue | Residue | Variance | Chi-squared | Pearson Chi-squared | Corr | |
|---|---|---|---|---|---|---|---|---|---|---|
| information | Shapiro-Wilk | mean | standard dev. | skewness | kurtosis | reduction | reduced | test | coef | |
| Amoruso et al. (2002)—model A uniform slip | 1.05E + 02 | NO | −0.32 | 15.1 | −1.287 | 7.5 | −1057 | 250 | NO | 0.91 |
| Capuano et al. (1988) | −3.83E−04 | YES | 4.95 | 11.17 | −0.146 | 3.33 | −6826 | 164 | YES | 0.96 |
| Valensise et al. (2008) | −3.2E−3 | NO | 2.17 | 14.1 | 0.85 | 4.96 | −1493 | 219 | NO | 0.92 |
| Calabrian source (dip fixed) | 6.9E−07 | NO | −0.634 | 12.345 | 0.574 | 4.66 | −4760 | 163 | YES | 0.94 |
There are many ways to assess the quality of a model. We chose to consider 10 analyses based on statistical properties of the model outcomes.
- Fisher Information (Frieden & Gatenby 2011) describes the amount of information data provided about an unknown parameter and is defined as the variance of the score. Let X = (x1, …,xn) be a random sample, and let f (X|θ) denote the normal probability density function for some model of the data, which has parameter vector θ = (θ1, … θk). Then the Fisher information matrix is given by the k-square symmetric matrix whose ijth element is given by the covariance between first partial derivatives of the log-likelihood:\begin{eqnarray*} I_{ij} = - {\rm E}\left[ {\frac{{\partial^{2} \log f\left( {X|\theta } \right)}}{{\partial \theta_{i} \partial \theta_{j} }}} \right]. \end{eqnarray*}
This definition corresponds to the expected Fisher information. If no expectation is taken, we obtain a data-dependent quantity that is called the Observed Fisher information. Fisher information matrix can be seen as the inverse of the parameter estimator-variance of a model, so the minimum of the variance corresponds to the maximum of information. As statistical parameter of the Fisher information matrix the determinant is usually chosen. The higher the value, the higher the information and lower the variance. For the models taken into consideration, we note (Table 3) that the Amoruso et al. (2002) model shows high information compared to the others. This can be explained as an outlier as confirmed, after all, by our other following analyses.
Examining residuals is a key part of the whole modelling process and allows performing a quality assessment about the model. Residuals can show us whether our assumptions are reasonable and our choice of model is appropriate. It is worth pointing out that the assumption of a Gaussian distribution of residuals implies that the most likely parameters are found by minimizing the sum-of-squares. It follows that tests for residual Normality represent useful tools for assessing the quality of the model identification. In our analysis, to characterize the quality of the normal distribution of the residues, we adopted the following tests:
Shapiro & Wilk (1965) tests the null hypothesis that the residues come from a normally distributed population with a significance level of 5 per cent. Among the considered models, only that of Capuano et al. (1988) passes this test.
Mean: the residues of a good model must belong to a Gaussian distribution, not-biased, hence with a sampled mean close to zero. Results show that Amoruso et al. (2002) is the least biased, whereas the Capuano et al. (1988) one seems heavily biased.
Standard Deviation: this shows how much variation of the residues there is from the average. The model proposed by Capuano et al. (1988) shows the best standard deviation of the residues.
Skewness is a measure of the asymmetry of the probability distribution of a real-valued random variable. If the left tail (tail at small end of the distribution) is more pronounced than the right tail (tail at the large end of the distribution), the function is said to have negative skewness. If the reverse occurs, it has positive skewness. If the two are equal, it has zero skewness. From Table 3, we can observe that for the Capuano et al. (1988) model, the residues are evenly distributed on both sides of the mean, feature required by a normal distribution.
Kurtosis is the degree of peakedness of a distribution, defined as a normalized form of the fourth central moment of a distribution. The kurtosis of the normal distribution is 3. Distributions that are more outlier-prone than the normal distribution have kurtosis greater than 3. The Capuano et al. (1988) model shows an optimal kurtosis value.
- Variance Reduction (VR) may also be used to discriminate between higher and lower quality model. VR is defined in different ways according to different authors. A common definition iswhere the term discrepancy means the difference between an observation and an expected value based on a model. VR assumes values within the range [−∞ ÷ 1]. It equals 1 when there is a perfect match between expected and observed values, while as values become smaller they indicate poorer fit. For this parameter, Amoruso et al. (2002) model shows the best value.\begin{eqnarray*} VR = 1 - \sum {\left( {\frac{{discrepancy}}{{observation}}} \right)} ^{2} , \end{eqnarray*}
Chi-squared—reduced: the reduced chi-squared statistic is simply the chi-squared divided by the number of degrees of freedom. A large value indicates a poor model fit. Also for this index our proposed model (Calabrian source—dip fixed; Table 2) obtains the best result, whereas the model of Amoruso et al. (2002) obtains the worst one. However, as said before, to make an impartial comparison between the four models, we used for Amoruso et al. (2002) the case with uniform slip.
Pearson's chi-square test performs a chi-square goodness-of-fit test of the default null hypothesis that the residues are random samples from a normal distribution with mean and variance estimated from themselves, against the alternative that the data are not normally distributed with the estimated mean and variance. In our analysis, the Capuano et al. (1988) model and our proposed model pass this test.
Correlation coefficient is a measure of how well the values predicted from the model fit with the real data. A perfect fit gives a coefficient of 1.0. Thus the higher the correlation coefficient the better the fit. Capuano et al. (1988) outperforms the other models in terms of correlation coefficient.
The goodness-of-fit analysis shows that although the Capuano et al. (1988) model obtains the best scores in terms of number of positive tests, there is no strong evidence of a unique robust solution, especially bearing in mind that the solutions are highly different between each other.
In this sense, our proposed model (Calabrian source—dip fixed; Table 2), with its best compromise results, can be placed among the candidates for the potential source of the considered earthquake with a confidence equal to that of other models considered in the statistical tests.
To assess the quality of the models, we calculated both local and global sensitivity indexes.
In the first approach, we changed one model parameter at a time, inside a defined range and we calculated how much this altered the objective functions WRMSE. This approach provides an indication of how much a certain coefficient can change before the optimum solution is fundamentally changed. Then, the sensitivity analysis shows that parameter has a significant impact on the stability of the optimum solution, or that the parameter is not well-constrained by the available data set. In our case, we would find the dislocation structure parameter is not well-constrained by the data set and the network geometry and then, when possible, it would be better to determine this parameter by other approaches. We carried out this first approach to the sensitivity analysis for all the four minima obtained in this work (Fig. 5). We found that the solutions are not well-constrained by the available data set and the network configuration. In particular, the depth, the dip angle and the strike-slip component are entirely unresolved (Fig. 5). Because of these uncertainties, we retain that the levelling data alone are not able to discriminate between the obtained minima.
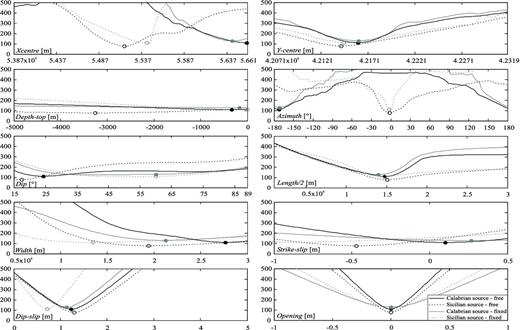
Sensitivity analysis for our models. The objective function WRMSE is reported on the y-axis. The circles indicate the minima found for each model.
The local approach has clear limits due to the non-linearity of the model. Therefore, we also carried out a sensitivity analysis on the source parameters to understand which are the most important for modelling the data. In particular, we calculated the first-order sensitivity indexes. The first-order sensitivity index measures the contribution of the ith input (given a range of variability) on the output variance, not considering interactions with other input factors. In our analysis, the considered output was the chi-square of the residues. The adopted algorithm for calculating the indexes is named Fourier Amplitude Sensitivity Test (FAST; Saltelli et al.1999; Cannavó 2012). The indexes are expressed as a percentage of the output variance reduced by fixing the input parameter. The higher the index value, the more important the input factor (Table 4).
First-order sensitivity indexes and the given range of variability for the Calabrian source model—free case (Table 2).
| Xcentre | Ycentre | Depth-top | Azimuth | Dip | Length/2 | Width | Strike-slip | Dip-slip | |
|---|---|---|---|---|---|---|---|---|---|
| FAST | 0.4 per cent | 3.3 per cent | 1.5 per cent | 0.5 per cent | 1.9 per cent | 13.3 per cent | 4.4 per cent | 0.0 per cent | 38.3 per cent |
| Max | 566 033.9 | 4 231 856.91 | 0 | 180 | 89 | 30 000 | 30 000 | 0.5 | 5 |
| Min | 538 778.91 | 4 207 175.21 | −5000 | −180 | 15 | 1000 | 5000 | −1 | 0 |
The results show that the dip-slip is the input factor that most influences the variability of the output, that is 38.3 per cent of the variance in the output can be eliminated by fixing the value of this parameter. The other parameters, except for the fault length, do not seem to be really sensitive to the data. This confirms the difficulties in constraining the solution to just one model.
In summary, our analysis highlights that there is no model, among those proposed so far, which is able to fully explain the geodetic data, and data themselves are not able to strongly constrain a model solution.
7 ACTIVE FAULTS RELEVANT TO THE INVESTIGATED MODELS: THE ARMO FAULT
Four lines of evidence indicate that significant recent and active deformation is nested in southern Calabria. First, residual GPS velocities (Mattia et al.2009) suggest present strain accumulation on the Calabrian side of the Straits, whereas no significant geodetic strain is accrued on the Sicilian side. The interseismic strain seems mostly accumulated on the Scilla fault, whose Late Holocene activity is documented (Ferranti et al.2007, 2008a), and on the Armo Fault (Fig. 1).
Similarly, instrumental seismicity (Scarfì et al.2009) outlines that weak seismic strain is mostly released in southern Calabria, and earthquakes are clustered along the NNE to NE-striking faults of the active extensional belt in Calabria (Fig. 2).
A third line of evidence supporting major fault activity in southern Calabria is provided by appraisal of existing marine geophysical data (Selli et al.1978; Del Ben et al.1996; Monaco et al.1996; Guarnieri 2006; Ferranti et al.2008b; Argnani et al.2009). These studies suggest a larger and more recent activity on the offshore extension of the Calabrian faults (Fig. 1), namely on the Southern Calabria Fault mapped by Argnani et al. (2009). On the other hand, offshore seismic profiles (Del Ben et al.1996; Monaco et al.1996; Argnani et al.2009) do not show evidence of low-angle faults and of their effects underneath the Messina Straits.
A further indication of prominent tectonic activity in southern Calabria is provided by coastal uplift studies (Antonioli et al.2006, 2009; Ferranti et al.2007, 2010), that have documented Pleistocene and Holocene uplift at a faster rate than in Sicily. These studies outlined that the difference in uplift between the two sides of the Straits is the consequence of a larger fault-related deformation in Calabria over a common background regional uplift.
All in all, geological, geophysical and geodetic data point towards southern Calabria as the locus of major deformation in the region. In particular, our novel inversion and sensitivity analysis of levelling data place one of the candidate seismogenic sources of the 1908 earthquake near to the Armo Fault.
Spurred by these results, we carried out a morphotectonic analysis of this fault (Fig. 6). Unlike the Sicilian source, which is a blind structure, the Calabrian source can be investigated by direct access, and our field study was undertaken as a corollary to the levelling data inversion. In particular, investigation was aimed at finding evidence of recent activity and to compute the displacement axis from exposed fault slip lineations, to set surface constraints on modelling results.
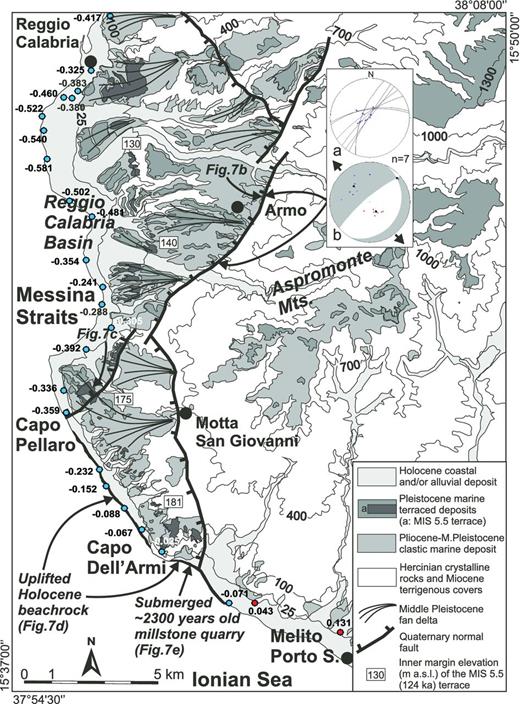
Morphotectonic map of the southeastern sector of the Messina Straits (Calabrian side, see Fig. 1 for location). The spatial distribution of elevation changes recorded by Loperfido (1909) are shown (blue for lowering and red circles for uplift). Lower hemisphere Schmidt diagrams in the inset show: (a) projections of Armo Fault kinematic data. Arrows on fault planes indicate motion of the hangingwall block. (b) Composite pseudo-fault plane solutions (FPS) computed from fault-kinematic data using software Faultkin v.1.2 (Marrett & Allmendinger 1990), available at ftp://www.geo.cornell.edu/pub/rwa/FaultKin/. Filled squares in stereo diagrams are calculated kinematic axes. Black arrows show the horizontal projection of the extensional axis.
The 18 km-long on-land section of the SSW–NNE striking (average N30°E) Armo Fault separates the southeastern margin of the Pleistocene Reggio Calabria Basin (Ghisetti 1984) from the upraised basement rocks of the Aspromonte Range (Figs 6 and 7a). To the south, a NNW–SSE striking splay (Motta San Giovanni fault—MSGF; Figs 1 and 6) branches from the major fault surfaces. The Armo Fault was active during Lower Pleistocene as testified by syn-sedimentary relationships (Ghisetti 1984; Barrier 1987), but large displacements occur since Middle Pleistocene (Barrier 1987; Monaco et al.1996).
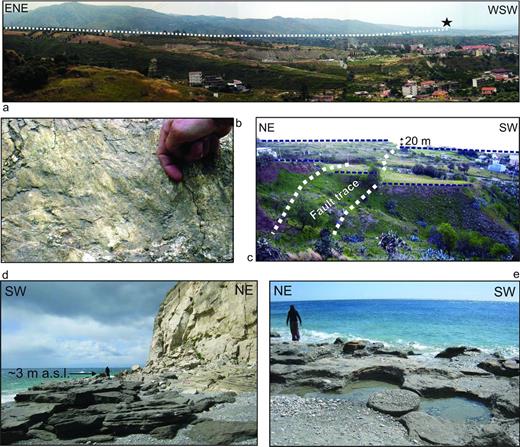
(a) Panoramic view of the southern sector of the Armo Fault. Black star indicates location of Fig. 7(c). (b) Slickenlines on crystalline rocks along the shear zone of the Armo Fault (see Fig. 6 for location and for data inversion). (c) Downfaulted MIS 5.5 terrace along the southern end of the Armo Fault (see Figs 6 and 7a for location). (d) Uplifted beachrock at Capo dell'Armi (see Fig. 6 for location). (e) Partially submerged Hellenistic millstone quarry at Capo dell'Armi (see Fig. 6 for location).
Although the morphologic expression of the fault is readily observable, exposures of the fault plane in bedrock are very few due to the abundant sediment and vegetation cover, and locally to human modifications. Only in the central part of the fault near the village of Armo we were able to collect enough fault plane and slip lineation data to perform a kinematic inversion (Figs 6 and 7b). In this sector, the fault zone is exposed in the bedrock as a staircase of steep slip surfaces embedding a deeply crushed cataclasite. Two fault sets are recorded, the first striking NNE to NE, and the second ENE (see stereographic projection inset in Fig. 6). Whereas fault planes of the first set have dip ranging from moderate (65°) to very (75–90°) steep, moderate (65°) dips characterize the second set. Fault slip vectors can be collected into three groups of azimuth (N245°E, N300°E, N20°E). Since at least two of them are kinematically incompatible, the existence of the three groups indicates non-plane strain. Based on the available data, it is difficult to estimate the accurate orientation of the elongation axis, which is likely residing between two of the slip azimuths. However, inspection of the slip azimuth in relation to fault dip shows that the least-dipping planes (ENE striking) have a less-marked strike component of motion, suggesting that they are more representative of the mean tensile strain. One of the remaining slip lineation family is probably associated to the dip-slip faulting as a result of partitioning. Accordingly, the mean tensile axis computed using the kinematic hypothesis of Marrett & Allmendinger (1990) reflects the influence of the less obliquely slipping faults, and trends N315° (arrows in inset in Fig. 6). Although this strain axis was calculated from outcrops of the main fault zone in its central sector, we regard this result as representative of the average geological extension direction on the fault.
We note that the azimuth of the computed extension axis is in good agreement with the GPS- estimated tensile axis for the Messina Straits area (D'Agostino & Selvaggi 2004; Mattia et al.2009; Serpelloni et al.2010), with the extension axis determined from structural analysis on the Scilla Fault (Ferranti et al.2008a), and with the tensile axis of crustal earthquakes in the hangingwall of the Armo and Reggio Calabria faults (Fig. 2). On the other hand, a slight counter-clockwise rotation of the field-based extension axis is observed relative to the ∼E-W-trending axis determined for the Calabria source by inversion of levelling data (Table 2) and with the ∼ENE–WSW seismological axis for the 1908 rupture (Fig. 1). This discrepancy likely arises from our incomplete outcrop sampling and possibly from the contribution of other sources to the 1908 ruptures.
Although fault-slip analysis in the bedrock yields parameters for the average Quaternary history of the fault or for an unknown time interval of it, activity in more recent times is documented by our morphostructural survey of the Late Pleistocene marine terrace, which is offset by the fault. In southernmost Calabria, the terrace attributed to the Marine Isotopic Stage (MIS) 5.5, which is dated at 125 ka BP and can be fairly well recognized due to its palaeontological content (Ferranti et al.2006), has its inner margin, a close proxy for the palaeo-sea level, lying at elevations between ∼130 and ∼180 m (Dumas & Raffy 2004). We rechecked the inner margin elevation and, consistently with the observation of Westaway (1993), we found that its variability ensues from fault offset (Fig. 6). The terrace elevation climbs abruptly from NW (130–140 m, Reggio Calabria area) to SE (175 m, Capo dell'Armi area; see also Dumas & Raffy 2004) passing from the hangingwall to the footwall of the Armo Fault. Inland of Capo Pellaro (Fig. 6), a ∼20 m vertical offset is observed on the fault (Fig. 7c), and an equal amount of offset is estimated on nearby parallel strands. Average uplift rates computed on the terrace inner margin position varies from ∼1.0 mm yr–1 on the hangingwall to ∼1.4 mm yr–1 on the footwall, thus yielding a 0.4 mm yr–1 vertical slip rate in the last 125 ka for the integrated fault zone.
Shorter term fault activity is suggested by uplifted Holocene coastal deposits that were recently described by Scicchitano et al. (2011), from which we summarize the observations that are critical for our study. Along a 10-km coastal stretch from Capo Pellaro to Melito di Porto Salvo, in the footwall of the Armo Fault, a continuous beachrock (see also Pirazzoli et al.1997) is raised up to 2–3 m a.s.l. (Figs 6 and 7d), and was dated by radiocarbon analysis at ∼5 ka BP. Correction for the sea level rise occurring since 5 ka yields an uplift rate of 1.2 mm yr–1, a value comparable to the long-term footwall uplift rate computed above, and interpreted here as partially related to ongoing Late Holocene fault activity.
The estimated 0.4 mm yr–1 Late Pleistocene vertical slip rate can be converted to fault slip by assuming reasonable geometries of the fault. By using a N315°E tensile axis determined from fault-kinematic analysis, the N30°E striking fault is modelled as having a dominant normal slip. The dip of the fault is estimated at 65° based on field measurements from the central part of the fault (stereonet in Fig. 6), using the dip- or oblique-slip faults only (not the strike-slip faults), more likely to be representative of the master fault surface. From these parameters, the slip rate at this location is estimated at 0.45 mm yr–1. By using the same reasoning, the horizontal extension accrued across the offset 125 ka terrace is computed at 0.19 mm yr–1. Based on the evidence provided by the position of the Holocene beachrock, which is uplifted at a rate comparable to the Pleistocene rate, the long-term slip rate figure is thought to hold for more recent times also.
In summary, field observations suggest that the on-land section of the Armo Fault is active with a 0.45 mm yr–1 slip rate and 0.2 mm yr–1 extension, under an NW-trending tensile axis. Field results are in agreement with the extensional nature and with seismological and geodetic parameters of the 1908 earthquake.
8 DISCUSSION
The novel inversion of Loperfido (1909) levelling data performed in this study yields above all two reliable minima, a blind east-dipping normal fault, located near the Sicilian coast (Sicilian source—free case; Table 2), and a near- surface, west-dipping normal fault, whose 70 per cent southern stretch is spatially coincident with the Armo Fault (Calabrian source—dip fixed; Table 2 and Fig. 3). Based on this, we question the reliability of the levelling data as a robust tool for determining the source fault of the 1908 earthquake. Specifically, our sensitivity analysis discards the current thinking that a source can be uniquely determined using exclusively the levelling data, a procedure adopted to place the seismogenic source on the Sicilian side (see review in Valensise et al.2008). We have shown that, using the same levelling data, a reliable source can be found in southern Calabria.
Of course, as it is at least doubtful that an east-dipping source can be considered as the clear-cut 1908 causative fault, the same conclusion must be drawn for a Calabrian source. However, our result also has a positive downside, in that it opens the possibility that the Armo Fault, spatially coincident with large part of the Calabrian source, was involved in the earthquake rupture.
If, as put forth here, the seismogenic rupture occurred in southern Calabria, an issue is raised by the limited ∼20 km length of the Armo Fault, which is inadequate to fulfil both the ∼30 km length required by the geodetically modelled seismogenic source (Fig. 3; Table 2), and the ∼43 km length based on inversion of seismicity data (Pino et al.2000). This difficulty can be circumvented by acknowledging the coeval rupture of other faults, which could have contributed to filling the gap. These additional segments must be searched either to the north or the south, where, as mentioned earlier, marine geophysical studies (Argnani et al.2009) outline the recent activity of the offshore Southern Calabria Fault (Fig. 1). This fault is characterized by a remarkable submarine scarp, and, although its NW–SE strike is at ∼50° from the strike of the Armo Fault, the two structures are aligned and thus could be part of a single, non-rectilinear system (Fig. 1). The probabilistic epicentral determination of the 1908 earthquake presented by Michelini et al. (2005), which spatially encompasses the Southern Calabria Fault and the southern part of the Armo and of its MSGF strand (Fig. 1), is consistent with the joint activation of (parts of) these faults. Significantly, the location of Michelini et al. (2005), combined with the unilateral northward rupture propagation (Pino et al.2000), rules out significant dislocation south of the Southern Calabria Fault and implies that slip, if occurred in Calabria, must have been taken place on the Armo Fault. The involvement in the seismogenic rupture of fault segments with different strikes, and namely the Armo and Southern Calabria faults, could explain the slight orientation mismatch between the ∼NW extension observed on the Armo Fault (Fig. 6) and the WNW tensile axis estimated for the 1908 event (Pino et al.2000).
Moreover, in the north, we note that the modelled Calabrian source encompasses the southern stretch of the S. Eufemia Fault (Figs 1 and 3), which thus may have partially contributed to the seismic release. The modelled dip-slip component of the 60°-dipping Calabrian source has a secondary high-slip patch in the north, which spatially coincides with the southern part of the S. Eufemia Fault (inset in Fig. 3). This observation could suggest that the fault may have been coseismically activated. Perhaps, the S. Eufemia fault was ruptured for a longer stretch, as jointly suggested by inspection of the macroseismic field (Fig. 1). In addition, segments of other Calabrian faults could have slipped during the 1908 earthquake.
A clue which helps to better appreciate our proposition of significant seismogenic faulting in Calabria is offered by the geometric arrangement of active faults. Scrutiny of the en-echelon pattern of the NE to NNE striking faults array (Fig. 1) suggests the faults are the shallow crustal expression of a larger buried fault at higher depths. The ∼50 km extent of the en-echelon array would alone satisfy the required length for seismogenic faulting.
Appraisal of seismic tomography investigations provides support to the identification of the deep crustal structure, and lends credit to the Armo and other high-angle faults in Calabria as being the most feasible candidate as the earthquake source. In Fig. 8, we have redrawn the tomographic profile of Scarfì et al. (2009), where we traced the projection of the model of Valensise et al. (2008) and of the four sources calculated in our inversions of the Loperfido (1909) levelling data. The reference surface (z = 0) has been assumed at the sea level, namely the mean elevation of the upper stations used in the modelling. The figure shows that the free-case sources (S1 and S2) and the model (S0) of Valensise et al. (2008) do not adequately account for the seismogenic depth, which for the 1908 earthquake is estimated at around 9–12 km (Pino et al.2009). Similar considerations apply for the dip-fixed Sicilian source (S3), as aforesaid, a result consistent with the lack of a major east-dipping high-angle fault in the middle of the Straits as documented by seismic reflection profiles (Argnani et al.2009). Instead, the dip-fixed Calabrian source (S4) apparently forms the sharp boundary between different velocity bodies between 10 and 20 km depth (Fig. 8). We suggest that seismic tomographic profiles are consistent with the proposed existence of a west-dipping, large buried fault at seismogenic depth in southern Calabria.
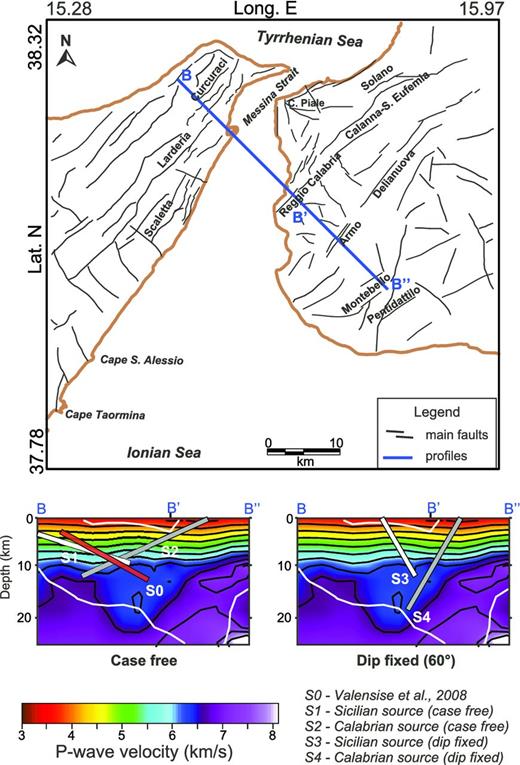
Tomographic profiles across the Messina Straits (from Scarfì et al.2009, redrawn) with the traces of the modelled faults superimposed.
This structure is expressed today by limited instrumental seismicity (Fig. 2) and by geodetic strain accumulation. Clusters of small earthquakes apparently follow the fault traces and bend to define the entire en-echelon system (Fig. 2). The GPS velocity field indicates that the contemporary extension on the Armo Fault is in the order of ∼1 mm yr–1 (Mattia et al.2009) and is oriented akin to the geological extension determined in this paper. The discrepancy in magnitude with the ∼0.2 mm yr–1 Late Quaternary rate on the Armo Fault estimated here can readily be accounted for by the existence of different fault strands where recent geological displacement may have taken place. We are aware, of course, that abnormal current accumulation, a listric fault geometry at crustal depths, with far-field geodetic rates larger than near-field geologic rates, and inescapable uncertainties in both geodetic and geologic rate estimation surely contribute to the mismatch.
The pattern of elevation changes recorded across the Armo Fault during the 1908 earthquake offers a further hint in support of the Calabrian source. Along a coastal transect in SW Calabria striking nearly orthogonal to the trace of the fault, the coseismic elevation changes can be grouped into three coherent domains (Figs 1 and 6). From Melito Porto Salvo west to Capo dell'Armi, a gentle uplift of 4–13 cm (by considering only the more reliable benchmarks close by or within the bedrock) is recorded in the footwall of the MSGF splay of the Armo Fault. Moving west from Capo dell'Armi towards Capo Pellaro, a subsidence of ∼3–9 cm is recorded in the hanging wall of the MSGF by bedrock benchmarks, which steadily increase to ∼15–23 cm further west along the loose coastal strip (Fig. 6). The above pattern is consistent with the ∼20–40 cm offset along the MSGF. Similarly, west of Capo Pellaro, a larger subsidence of ∼35–40 cm is recorded in the hangingwall of the Armo Fault, supportive of a further 15–25 cm offset across the latter structure. All in all, the elevation change pattern can be interpreted as recording an integrated ∼30–65 cm coseismic offset, which itself would represent a good fraction of the expected surface offset for a Mw 7.1 normal fault earthquake (Wells & Coppersmith 1994).
The hypothesis that the Armo and MSGF strands of the Armo Fault were activated during the 1908 earthquake is consistent with the reported occurrence (Blumetti et al.2008) of NE–SW trending ground cracks, in addition to coastline retreats (inferred to be related to hangingwall downthrowing) just along the projection of these faults (Fig. 1). Moreover, part of the coseismic subsidence documented by Loperfido (1909) could justify the submerging of a Hellenistic quarry in the immediate hangingwall of the MSGF fault (Fig. 7e, Scicchitano et al.2011). However, we surmise that further investigations are required to understand the relationship between fault-related deformation and relative sea level changes.
Integration of surface and subsurface information indicate that the Armo Fault has the potential, together with nearby faults, to be responsible for current seismogenic activity in the Messina Straits area.
9 CONCLUSIONS
To test the possible fault models for the Messina Straits 1908 earthquake, a novel inversion and a sensitivity analysis of Loperfido (1909) levelling data have been carried out. In summary, our analysis highlights that there is no model, among those proposed so far, which is able to fully explain the data, and the available data themselves are not able to strongly constrain a model solution. The main result of our analysis is that the levelling data alone do not differentiate between a west-dipping fault on the Calabrian side from an east-dipping fault on the Sicilian side of the Straits. This result contradicts the conventional conclusion that the data favour the latter, and places another possible candidate seismogenic source of the 1908 earthquake near to the Armo Fault.
Seismicity, geodetic and new morphotectonic data collected in the area of the western-dipping modelled source suggest it has a recent tectonic activity and is currently accumulating strain. The small instrumental seismicity illuminates the whole array of en-echelon faults, a possible upper crustal expression of a longer fault at depth, which is compatible with the required size for the earthquake source. Seismic tomography images indicate that this west-dipping structure extends to ∼18–20 km depth, and thus represents the main crustal structure in the Messina Straits area.
The integrated data appraisal corroborates the possibility that the Armo and other en-echelon on-land and submerged faults are the locus of major deformation in the region, and possibly slipped during the 1908 earthquake, causing near-surface ruptures and westerly downstepping of levelling benchmarks. This proposition has important engineering implications for the planning of the ∼3-km long single-span bridge between Sicily and mainland Italy.
This work was partially funded by the Department of Civil Protection-INGV, through project S1 and S5 2007–2009, grants to LF and MM. The content of this paper reflects the opinion of the Authors solely and not the policy of the Funding Agency. The authors have appreciated the revision of the Editor, Prof Randy Keller and of two anonymous reviewers which strongly improved the quality of the paper.
