


Abstract
The anterior cingulate cortex (ACC) is known to play a crucial role in the fast adaptations of behavior based on immediate reward values. What is less certain is whether the ACC is also involved in long-term adaptations to situations with uncertain outcomes. To study this issue, we placed macaque monkeys in a probabilistic context in which the appropriate strategy to maximize reward was to identify the stimulus with the highest reward value (optimal stimulus). Only knowledge of the theoretical average reward value associated with this stimulus — referred to as ‘the task value’ — was available. Remarkably, in each trial, ACC pre-reward activity correlated with the task value. Importantly, this neuronal activity was observed prior to the discovery of the optimal stimulus. We hypothesize that the received rewards and the task value, constructed a priori through learning, are used to guide behavior and identify the optimal stimulus. We tested this hypothesis by muscimol deactivation of the ACC. As predicted, this inactivation impaired the search for the optimal stimulus. We propose that ACC participates in long-term adaptation of voluntary reward-based behaviors by encoding general task values and received rewards.
Introduction
Studies carried out in both humans and non-human primates suggest that the anterior cingulate cortex (ACC) plays a major role in diverse aspects of the control of voluntary reward-guided behaviors. This involvement is coherent with its identity as a limbic structure (Porrino et al., 1981; Morecraft et al., 1993; Morecraft and Van Hoesen, 1998).
First, the ACC relates actions to their expected consequences (in terms of expected rewards), and guides decisions about choice of actions (Bush et al., 2002; Rushworth et al., 2004; Walton et al., 2004; for a review, see Krawcyk, 2002). The expected reward is based on the knowledge of the potential resources of the environment. However, to what extent the ACC encodes the resources that are available in a given situation remains unknown.
Second, the ACC appears to be involved in the processing of actual outcomes (positive or negative) when decisions have to be made based on these outcomes. Neurophysiological studies in human have shown a specific role of the ACC in the processing of monetary gains and losses (Gehring and Willoughby, 2002). Experimental studies in monkey have also revealed that lesions or inactivation of the ACC significantly impair the reward-based selection of appropriate motor responses. One hypothesis is that the lesioned animal is unable to use the size of the reward as a cue to choice of action (Shima and Tanji, 1998; Hadland et al., 2003). However, there is no report assessing whether the ACC encodes the size of the obtained rewards.
Finally, electrophysiological studies in behaving monkeys revealed that the ACC is implicated in behavior directed toward distant rewards because the ACC assesses reward proximity (Shidara and Richmond, 2002) and is involved in reward-based sequence performance and learning (Procyk et al., 2000; Procyk and Joseph, 2001). The role of the ACC in situations where subjects have to choose among different reward objects and in which the discrimination has to be made over a relatively long period of time remains largely unknown.
Using a stimulus-selection task, referred to as the ‘choice task’, we have investigated the contribution of the ACC to performance monitoring when an animal has to decide which of two novel target-stimuli is associated with the largest average liquid reward (the optimal stimulus). In one choice test, the discovery of the optimal stimulus requires several trials because the reward quantities associated with each stimulus is not constant. Selection of the optimal stimulus is rewarded by 1.2 ml of liquid with a probability of 0.7, and by 0.4 ml with a probability of 0.3. Selection of the non-optimal stimulus is reinforced by the same quantities, but with the opposite probabilities. These parameters are stable; only the stimuli change from one test to another. The appropriate strategy to maximize reward is to search for the optimal stimulus and to maintain this choice in subsequent trials.
The single unit firing frequency suggests that ACC neurons provide an evaluation of the theoretical average reward of the optimal stimulus at the beginning of the choice tests. We refer to this theoretical value as the ‘task value’. A second population of neurons encode the size of the actual reward obtained. The encoding of these two parameters is discussed in relation to the role of the ACC in the adaptation of voluntary reward-based behaviors.
Materials and Methods
Two male rhesus monkeys (M1 and M2) were used in this experiment. Each animal was seated in a primate chair within arm's reach of a tangent touch-screen (Microtouch System) coupled to a TV monitor. In the front panel of the chair, an arm-projection window was opened, allowing the monkey to touch the screen with one hand. A computer recorded the position and accuracy of each touch. It also controlled the presentation via the monitor of visual stimuli (color shapes), which served as light-targets (CORTEX software, NIMH Laboratory of Neuropsychology, Bethesda, Maryland). One of two 2 × 2 cm white squares located 10 cm below the targets was illuminated and served as starting position to initiate a trial. One position was randomly chosen (50/50) by the computer in each trial. M1 and M2 worked with the left and right hand, respectively.
Behavioral Paradigms
The animals were trained to perform a choice task and a no-choice task.
Choice Task
When the monkey touched the starting position, two visual stimuli (‘A’ and ‘B’) simultaneously appear in two fixed spatial virtual windows (6° × 6°) centred on the horizontal plane at 10 cm to the right and to the left of the screen centre (Fig. 1A). Each stimulus was a combination of colored shapes. After a 2–3 s delay period, the stimuli were briefly (100 ms) extinguished. This was the ‘GO’ signal. The monkey then had to release the starting position and touch one of the two stimuli within 1000 ms of the onset of the GO signal. Although touching a target ended the visual presentation of the two stimuli, the animal was required to keep touching the target position until reward was delivered (squirt of fruit juice) 1–1.5 s later (Fig. 1B). The reward was followed by a 3 s time-out. Then, one starting position was reilluminated indicating the start of a new trial. If the monkey released the position before the GO signal, the trial was aborted. The monkey then had to resume the trial until successful completion.
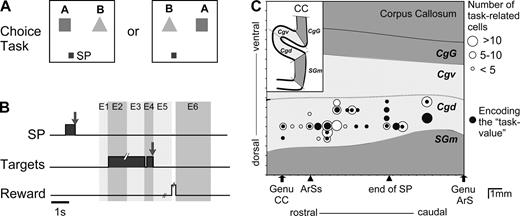
(A) Display monitor. Location of the two target positions. A 2 × 2 cm square located 10 cm below either one (randomly, 50/50) of the two targets served as starting position (SP) of the hand (in this figure, the left SP is represented). (B) Trial events in the choice task. Grey areas correspond to the time of illumination of the starting position (SP) and of the target stimuli. E1–E6: epochs for analysis. (C) Location of task-related cells. Abbreviations: CC, corpus callosum; ArSs, rostral extent of the superior branch of the arcuate sulcus; ArS, arcuate sulcus; end of SP, caudal extent of the Sulcus Principalis; SGm, medial superior gyrus; Cgd and Cgv, dorsal and ventral banks of cingulate sulcus; CgG, cingulate gyrus.
Touching stimulus ‘A’ yielded 1.2 ml of juice with a probability P = 0.7, and 0.4 ml with a probability Q = 0.3. The reinforcement ratio for stimulus ‘B’ was the opposite: the touch stimulus ‘B’ yielded 1.2 ml with a probability P = 0.3, and 0.4 ml with a probability Q = 0.7. These probabilities were implemented as follow: the animal performed successive blocks of 20 trials, in which the computer randomly selected trials without repetition. In 14 trials, the choice of stimulus ‘A’ was rewarded with 1.2 ml and the choice of stimulus ‘B’ with 0.4 ml. In the other six trials, the stimulus–reward associations were the opposite. Stimulus ‘A’ was presented on the right side of the screen in 50% of trials.
We defined the search period as the series of consecutive trials during which the animal searched for the good stimulus by touching either one of the two. We defined the repetition period as a series of five consecutive trials in which the same stimulus was selected followed by selection of the same stimulus in (a) the next five trials or (b) five of the next six trials. The search and repetition periods associated with one unknown couple of stimuli is referred to as a ‘choice test’. The criterion used to detect the repetition period has been defined for online control purposes. During recording sessions, it was an easy and reliable way to detect a repetition period and shift to another choice test in order to further examine a cell. The probability, by chance alone, of touching the same stimulus in a series of 10 successive choices is 0.0009 (1/1024), and the probability of touching the same stimulus, by chance alone, in the conditions of case (b), is <0.0024 (5/2048). Thus, the probability that a repetition period occurs by chance alone is <1% (7/2048 = 0.0034). We took this performance level to indicate that the animal had selected one particular stimulus and that a decision had been reached. The criterion used to delineate the repetition periods was compared to the one provided by Gallistel et al. (2004). Using their algorithm with t-test and χ2 tests and low criterions [between 1.3 (P < 0.05) and 2.5] we usually detected the beginning of repetitions that we defined with our rule. Higher criterions gave no detections.
If no repetition period occurred after 50 trials, the test was aborted. When the repetition period was terminated, two new stimuli were selected and another test was initialized.
No-choice Task
This task was identical to the choice task, except that the two stimuli were fixed, identical and well-learned, and the quantity of reward delivered at the end of the trials was predictable. In this task, three kinds of trials were presented: (i) in trial 1.2 ml, the stimuli (two blue rectangles) were associated with a reward of 1.2 ml; (ii) in trial 0.4 ml, two green ellipses were associated with a reward of 0.4 ml; and (iii) in trial 0 ml, two red disks were associated with no-reward. Touching one of the two disks was mandatory for the experiment to proceed to other (rewarded) trials. The trials 1.2 ml and 0.4 ml were mixed and formed a separate block of trials. Since the animals were reluctant to work for no reward — in particular if this trial occurred too frequently — trials 0 ml were interspersed with the choice trials, trials 1.2 ml and 0.4 ml, in a 1.5/10 ratio. In general, after one or two refusals, the animal performed the trial.
Task Values
In the choice task, the systematic choice of stimulus ‘A’ was the optimal strategy and was rewarded on the average in each trial by 0.96 ml (0.7 × 1.2 + 0.3 × 0.4 = 0.96). We refer to this average quantity as the task value. The task value represents the maximum average reward per trial offered in the task and is therefore different from the actual rewards received in single trials. Systematic choice of stimulus ‘B’ was the worst strategy and was rewarded on the average per trial by 0.64 ml (0.3 × 1.2 + 0.7 × 0.4 = 0.64). The average reward of any intermediate strategy combining choices of ‘A’ and ‘B’ was between 0.64 and 0.96 ml, and was a linear function of the probability of choosing ‘A’.
The task values in trials 1.2 ml, 0.4 ml and 0 ml were respectively equal to 1.2, 0.4 and 0 ml. Thus, the task values in these trials are not different from the actual rewards obtained.
Surgical Procedure
Surgical procedures were carried out according to the 1986 European Communities Council Directive. They were performed under aseptic conditions. The animals received general anaesthesia during the attachment of a head holder, and later, during the implantation of recording chambers.
The animal first received an intramuscular injection of the neuroleptic chlorpromazine (Largactil 1mg/kg, im). Following premedication with atropine (1.25 mg, i.m.) and dexamethasone (4 mg, i.m.), the monkeys were prepared for surgery with ketamine hydrochloride (20 mg/kg, i.m.) and chlorpromazine (2 mg/kg, i.m.). Anaesthesia was maintained with halothane in N2O/O2 (70/30). Heart rate was monitored and artificial respiration adjusted to maintain the end-tidal CO2 at 4.5–6%. Rectal temperature was maintained at 37°C.
A bar was attached to the skull with small stainless steel screws and then embedded in an acrylic assembly to permit subsequent head fixation. When behavioral training was completed, the animal was reoperated. With stereotaxic guidance, a stainless steel recording chambers was implanted. The chamber was positioned to provide access bilaterally to the anterior cingulate cortex (Fig. 1C).
Later, during a pause in the recording sessions, a scleral search coil constructed with Teflon-coated stainless steel wire was implanted around the conjunctiva according to the procedure described by Judge et al. (1980).
Data Analysis
Behavioral Data
In trials of the choice and no-choice tasks, the number and direction of saccades in the time period between stimulus onset and stimulus touch were studied. The identity (‘A’ or ‘B’) and location (R or L) of the touched stimulus, as well the quantity of reward given to the monkey, were recorded. Duration of the search period in each test was computed. Hand reaction time (RTs) and movement times (MTs) from the starting position to the selected stimulus were computed for each trial.
In decision-making studies, the parameters of the so-called win–stay/lose–shift strategy are commonly used (In the choice task, ‘win’ and ‘lose’ would correspond to the delivery of the large and small rewards, respectively). In the tests, we measured the frequency with which the win–stay (called here large-keep) and lose–stay (called small-keep) strategies were used (Fig. 2D,E). The large-keep strategy is the spontaneous strategy; the small-keep strategy is correct during repetition because the animal must keep selecting target ‘A’ although this target provides the small reward in 30% of trials. The dependency of choices in trial N + 1 on choices made — and on rewards obtained — at more distant previous trials (i.e. at trials N − 1, N − 2, etc.) was not studied.
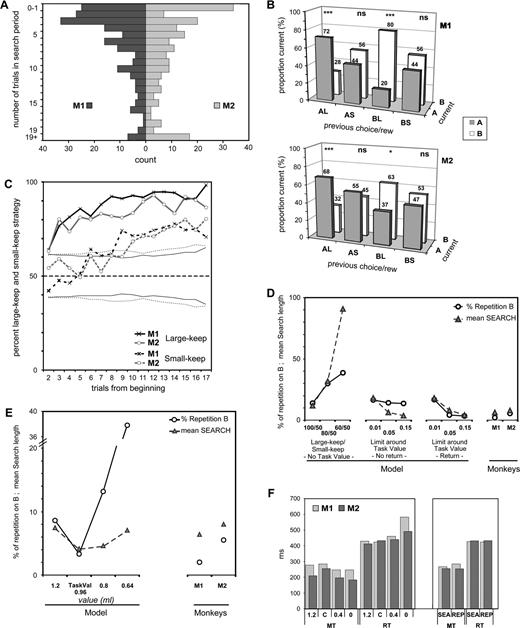
Behavioral data in the choice task. (A) Population histogram of search sizes (in number of trials) for a sample of tests performed by the two monkeys (M1: n = 197; M2: n = 189). (B) Global strategy of keep and change during the search period. Histograms show the proportion of cases in which a choice on ‘A’ or ‘B’ (current) was preceded by a choice on A that led to a large reward (AL), by a choice on A that led to a small reward (AS), etc. Significance of statistical comparisons of proportions is noted on top of histograms (ns: non significant; *P < 0.01; ***P < 0.001). (C) Large-keep and small-keep strategies during tests. In ordinates, the percent of trials using these strategies. The plots are aligned on the second trial of tests. The dotted lines at ∼40 and 60% represent the confidence limit of the null hypothesis (No strategy — Random choices) for each monkey. (D) Performance of the model in the choice task measured at different stages, and monkeys' performance (on the right). In abscissa, different stages of the model are described (see Appendix): for the first stage (left) is reported performance for several large-keep/small-keep proportions (100/50, 80/50, 60/50); performance for the second (No return: no possible shift after entering repetition) and third (Return: shift in repetition if the stimulus value exits the limits around the task value) stages are reported for different limits (0.01, 0.05, 0.15) around the task value. Circles represent the percent of repetition in which the worst stimulus (‘B’) is chosen. Triangles represent the mean number of trials performed before entering repetition. (E) Performance of the model measured for different reference values: maximum reward (1.2), real task value (0.96), the average reward (0.8) with random choices and the average reward when ‘B’ is chosen (0.64); monkeys' performance in the choice task are on the right (see Appendix). (F) Movement times (MT) and reaction times (RT) measured for the two monkeys in the different tasks (control 1.2 ml, choice task (C), control 0.4 ml and control 0 ml), and during the two periods of the choice task (search: SEA; repetition: REP).
We analyzed the large-keep and small-keep strategies in the following way: let's suppose that, in a population of p choice tests, the animal has received in n tests (n < p) a large reward in trial N. The proportion of choice tests — out of n — in which the same stimulus was chosen in trial N + 1 represents the proportion of large-keep trials at that point and measures the strength of the corresponding strategy. In the other tests (p − n), the animal has received the small reward in trial N. The proportion of choice tests in which the same stimulus was chosen in trial N + 1 measures the strength of the small-keep strategy at that point. The proportions of large-keep and small-keep trials are independent since they bear on two different groups of tests. The size of the two groups varies at each trial, but their sum remains constant (p). We also examined the possibility that the animal adopted spatial strategies, such as left-keep or right-keep.
Proportions close to 100% of both large-keep and small-keep trials indicate that the same stimulus is systematically chosen, regardless of the rewards obtained in each trial. The strategy of the animal is ‘keep’ in that case. Proportions close to 100 and 50%, respectively, indicate that the animal has a tendency to choose the same stimulus in case of large reward, but has no fixed strategy (keep or shift) in case of small reward.
Neuronal Data
Extracellular neuronal activity was recorded while the animal performed the choice- and the no-choice tasks. Neurons showing clear changes in firing rates in relation to one or more task-events were selected for on-line storage in digital form (resolution, 1 ms).
Rasters and peri-event histograms were constructed for all recorded neurons (MATOFF Software, NIMH, LSN, USA). Average firing rates were computed trial-by-trial in six epochs: the epoch starting 500 ms prior to stimulus presentation (anticipatory, epoch E1), the first part of the delay i.e. 0–1000 ms after stimulus onset (visual, epoch E2), the latter part of the delay before the GO-signal (pre-movement, epoch E3), the epoch between the GO-signal and the target touch (movement, epoch E4), the time interval between target touch and reward (post-movement, epoch E5) and the epoch up to 2000 ms after reward delivery (post-reward, epoch E6) (Fig. 1B).
We evaluated whether the average activity in each epoch was different from baseline, i.e. from the 500 ms period preceding onset of the starting position (Wilcoxon paired test, P < 0.05). This was done separately for the four conditions: the three conditions of the no-choice task and the repetition period of the choice task. If at least one of these was significant, the corresponding epoch was declared task-related and was kept for further analysis.
The effects of the expected reward (1.2, 0.4 and 0 ml) in the no-choice trials were studied with a repeated-measure analysis of covariance (ANCOVA) (P < 0.05). We included RTs and MTs as covariates to eliminate the possible effect of these parameters on neuronal activity. In each epoch, activities of trials 1.2 ml, 0.4 ml and 0 ml were also compared with a Post-hoc Fisher LSD test (P < 0.05) (Table 1). The influence of spatial parameters (position of the starting point and position of the selected stimulus) was studied with ANCOVA (P < 0.05) in the choice trials (Table 2).
Classification of pre- and post-reward task-related epochs according to their average activity in the no-choice task
| Pre | Post | ||
|---|---|---|---|
| 1 | 1.2 = 0.4 = 0 | 81 (17%) in 49 cells | 19 (24%) in 19 cells |
| 2 | 1.2 ml > 0.4 ml > 0 ml | 48 | 4 |
| 3 | 1.2 ml > (0.4 ml = 0 ml) | 44 | 6 |
| 4 | 0 ml > 0.4 ml > 1.2 ml | 6 | 1 |
| 5 | (0 ml = 0.4 ml) >1.2 ml | 17 | 2 |
| 6 | Sub-total 1.2 ≠ 0.4 | 115 (25%) in 57 cells | 13 (16%) in 13 cells |
| 7 | (1.2 = 0.4) > 0 | 207 | 34 |
| 8 | (1.2 = 0.4) < 0 | 64 | 14 |
| 9 | Sub-total (1.2 = 0.4) ≠ 0 | 271 (58%) in 133 cells | 48 (60%) in 48 cells |
| Total | 467 (100%) | 80 (100%) |
547 epochs in 195 cells are classified with a post-hoc Fisher LSD test, P < 0.05. The first column reports the line number. In each line is indicated the number of pre-reward (third column) and post-reward (fourth column) epochs in which activity shows the pattern indicated in the second column. For example, the first line indicates that 81 pre-reward and 19 post-reward epochs show similar activity in no-choice trials 1.2 ml, 0.4 ml and 0 ml. Note that the total number of post-reward epochs (80) is different from the total number of neurons studied (195) because many post-reward epochs were not task-related.
Proportion (in %) of epochs exhibiting a spatially selective activity (right/left differences) in the choice task
| Epochs | Origin effect | End-point effect |
|---|---|---|
| Anticipatory (E1) | 13.5 (n = 44) | 13.5 (n = 38) |
| Visual (E2) | 7 (n = 66) | 18 (n = 97) |
| Pre-movement (E3) | 12 (n = 60) | 29 (n = 98) |
| Movement (E4) | 9 (n = 75) | 38 (n = 133) |
| Post-movement (E5) | 4.5 (n = 47) | 34 (n = 98) |
| Sub-total (pre-reward) | 9 (n = 292) | 29 (n = 464) |
| Post-reward (E6) | 2.5 (n = 42) | 8 (n = 83) |
n refers to the number of task-related epochs tested (ANCOVA, P < 0.05). The incidence of the position of the optimal stimulus (end-point effect) was studied in 195 cells. The incidence of the starting position of the hand (origin effect) was studied in 112 cells.
One observation is that the average activity in the choice trial in each epoch is intermediate between that observed in trial 0.4 ml and in trial 1.2 ml. The interesting issue is whether the activity in the choice task has a fixed level relative to the activity in trial 0.4 ml and trial 1.2 ml. To address this issue, and carry out a population study, a linear transformation was adopted that (i) transformed activity in trial 0.4 ml and trial 1.2 ml to ‘0’ and ‘100’, respectively, and (ii) linearly adjusted the value observed in the choice trial to this new scale.
In order to normalize activity for cases in which trial 1.2 ml = trial 0.4 ml, the linear transformation was simplified. We normalized X by: X → 100 × (X/Y). With this transformation, the activity in the epoch in trial 1.2 ml and trial 0.4 ml became both equal to 100 (cf. Fig. 5D–F).
We compared the time of occurrence of activity changes within a choice test with performance changes (cf. Fig. 6). To identify first epochs showing activity changes, we examined the neuronal activity curve. This curve had in abscissa the successive trials in the test and, in ordinates, the activity of the epoch in these trials. We calculated the average activity (M) and the standard deviation (SD) in the five last trials of the repetition period. A change during the test was noted if (i) activity in the first trial of the test was not within the limits M ± 1.96 × SD or (ii) average activity of the two first or of the three first trials were different from M (Mann–Whitney U-test, P < 0.05).
In cases where there was an activity change during a test, we then examined the ‘performance’ curve of the test, which had in abscissa the successive trials, and in ordinates the touch of target A arbitrarily scored ‘1’ and that of target B scored ‘0’. The activity curve and the performance curve were compared by a cross-correlation analysis (Mitz et al., 1991). When the cross-correlation was statistically significant at a time lag, this lag — whether positive or negative — indicated a statistically significant time-shift between the two curves and an advance of one curve over the other. When significant correlations were observed at different lags, we arbitrarily selected the time lag corresponding to the largest correlation.
The correlation analyses were adapted to spatially selective cells by excluding trials in which the cell's non-preferred side was chosen.
All statistical analyses were performed with Statistica®.
Muscimol Injections
The effects of saline and muscimol injections in the ACC on the choice task were studied after the completion of the electrophysiological recordings. The sessions were ‘saline’ or ‘muscimol’ and were alternated daily, a muscimol session being preceded and/or followed by a saline session.
The unilateral injections were made in the ACC contralateral to the working arm. Each unilateral session started with three injections at three different sites. Each bilateral session started with five injections at five different sites (three sites on one side and two sites on the other). The different injection sites in each monkey were fixed and were chosen so as to inject the largest area within the region represented in Figure 1C.
Each session started with a period of retraining (13–30 min) followed by a pause (30–40 min) during which injections were made (‘saline’ or ‘muscimol’). The tip of a micro-seringe (Hamilton Company, ∅ = 0.2 mm) was pushed by a motorized micro-driver (Trent Wells) through a guide tube held in place by a XY micro-positioner. At each site, 2 μl of a muscimol solution (5 mg/ml) or of isotonic saline were injected by pressure at a speed of 1 μl/min. The cannula was withdrawn 1 minute after each injection. The animals were tested immediately after the last injection.
Two groups of tests (i.e. saline and muscimol tests) were considered. In each group, we measured the proportions of correct choices and the frequency with which the large-keep and small-keep strategies were used.
Histology
Recording and injection sites were reconstructed by localizing, on coronal sections stained with Cresyl violet, electrolytic micro-lesions made after the experiments at crucial points within the explored regions.
Results
Behavioral Results in the Choice Task
Determination of the Probabilities P/Q
We varied the reward probabilities P/Q (P > Q, P + Q = 1) of the choice task on three monkeys in a pilot study that lasted ∼6 weeks. Increasing the difference between P and Q made the identification of the optimal stimulus theoretically easier. The different values of P/Q tested were 0.85/0.15, 0.7/0.3 and 0.6/0.4. The size of the large and small rewards was kept constant (1.2 and 0.4 ml). The corresponding task values were 1.08, 0.96 and 0.88 ml, respectively. Performance of the monkeys with each of these couples of probabilities was studied on average in 36 tests.
The animals found the optimal stimulus in 100% of the tests. According to the used P/Q parameters, the average number of trials needed to discover the optimal stimulus was 21 ± 16.4 (mean ± SD), 36 ± 17.1 and 52 ± 20.4, respectively (data pooled from the three monkeys). We further tested the animals with probabilities P and Q close to 0.5. In these cases the performance dropped to chance level.
Following the pilot study, we selected P/Q = 0.7/0.3 (i.e. task value = 0.96 ml) for the electrophysiological recording sessions. Two monkeys were then retrained for an additional 3 months in the choice task using this probability ratio. During this training period, the average duration of the search period decreased considerably from 36 trials to 5–9 trials. At the end of this 3 month period, we commenced extracellular electrophysiological recordings.
Strategy in the Choice Task during the Electrophysiological Recordings
When possible, we presented multiple couples of novel target-stimuli to the monkey while recording from the same neuron. This was possible in 79 cells in M1 and in 28 cells in M2.
At the beginning of the search period, the animals had a preference for the position nearest to their acting arm (i.e. left arm/left position in M1, right arm/right position in M2), regardless of the identity of the stimulus. This was observed in ∼70% of the early trials (not illustrated). This spatial bias disappeared during the repetition period. The animal then touched the right or the left position with equal probability, according to the location of the preferred stimulus. Repetition periods made up of 10 consecutive choices of the same target were observed in 84% of tests (case a). In 16% of tests, the series was interrupted once by the choice of the other target (case b).
We analyzed the performance and strategies in 200 tests for each monkey. M1 and M2 found the optimal stimulus in 98 and 94.5% of these tests, respectively. In 2% of tests in M1 and in 5.5% of tests in M2, the non-optimal stimulus was chosen. These performances are not statistically different from the 100% of the pilot study [M1: 100% (n = 36) versus 98% (n = 200), P < 0.393; M2: 100% (n = 36) versus 94.5% (n = 200), P < 0.171]. However, a small drop compared to the pilot study cannot be excluded and could be explained by the remarkable reduction of the duration of search periods that lasted on the average 6.4 ± 5.6 and 8 ± 6.9 trials, respectively. Shorter search periods could lead to more risky decision-making. In 50% of tests, duration of the search period was <5 trials in M1 and <8 trials in M2. Figure 2A shows the distribution of search lengths.
Overall, choices were partly driven by the size of the reward obtained in a particular trial (Fig. 2B,C). The diagrams in Figure 2B represent the target choices (‘A’ or ‘B’) in the trials of the search period as a function of the choices (‘A’ or ‘B’) and of the rewards (Large or Small) obtained in the preceding trial (AL for choice of target ‘A’ followed by a Large reward, BS for choice of target ‘B’ followed by a Small reward, etc.). These diagrams show that receiving a large reward in a trial (AL or BL) often led to the repetition of the same choice in the following trial. A small reward did not induce any bias in the following choice. Figure 2C shows that the strategy large-keep was observed from the beginning of tests (trials 2, 3, 4). The strategy small-keep was observed in approximately half of the early trials. It then increased, in parallel with the systematic choice of the preferred stimulus during repetition, while remaining close to 70% in the late trials.
Using these data as a reference, we modelled animal's performance and pattern of choices in terms of global strategy and reaction to reward size (see Appendix for a detailed report). We evaluated performance using the mean number of trial in the search period and the percent of repetitions in which the worst stimulus is chosen (%B repetition Fig. 2D,E). Increasing the frequency of large-keep (i.e. increasing the tendency to repeat a choice when it is rewarded by a large reward) improves performance at all levels (Fig. 2D, left diagram). However the large-keep/small-keep strategy alone is insufficient, and leads to more incorrect choices (i.e. chose ‘B’ in repetition) than what is observed in monkeys (13.9% of repetitions in the model versus 2 and 5.5% in monkeys). However, introducing an evaluative function to compare stimulus values with the task value greatly improves performance, which reached levels comparable to those of monkeys (Fig. 2D; No Return and Return). The accuracy of value comparison (accuracy is defined by the limits set around the task value, e.g. task value 0.96 ± 0.05 ml) is also an important parameter (Fig. 2D; No Return and Return; limits = 0.01, 0.05 and 0.15 ml). This comparison must be made continuously during the task so as to avoid perseveration on incorrect choices during repetition (Fig. 2D; Return). In addition, the value of reference is obviously important: using the proper task value (0.96 ml) leads to better results than the larger reward value (1.2 ml) or than the average value using random choices (0.8 ml) (Fig. 2E). Finally, note that the search length for the model is shorter than for monkeys. This reveals that other parameters not taken into account in the model (level of attention, motivation, etc.) might influence performance of monkeys in the choice task.
Oculomotor and Motor Behavior
Oculomotor and motor activities were analyzed in a restricted sample of tests (60 in M1 and 34 in M2) performed at different moments during the electrophysiological sessions. A move of the eye position from one target window (see Methods) to the other was counted as a saccade. These were indeed the only eye movements observed between target onset and target touch. The number of saccades per trial was stable across tasks and across periods of choice tests (search/repetition) for both monkeys. During the search period, M1 and M2 fixated target ‘A’ and target ‘B’ equally; during the repetition, they fixated on target ‘A’ 70 and 82% of the time, respectively.
In the no-choice trials, the reaction times (RTs) and the movement times (MTs) of the arm were modulated by the task value [RTs: M1: F(2,3281) = 56.94, P < 10−6; M2: F(2,1952) = 31.34, P < 10−6, analysis of variance (ANOVA)] [MTs: M1: F(2,3306) = 5.91, P < 0.0027; M2: F(2,2899) = 11.90, P < 10−6, ANOVA] (Fig. 2F). In the choice trial, in the two monkeys, the data showed no statistical differences between the RTs in the search and repetition periods (M1: t = 0.4645, ns; M2: t = 0.202, ns, unpaired t-test).
Neuronal Activity
Overview
Neurons were recorded from area 24c in the dorsal bank of the anterior cingulate sulcus, in a region anterior to the level of the genu of the arcuate sulcus (Fig. 1C). We recorded 383 and 124 neurons in M1 and M2, respectively. A total of 195 task-related cells were recorded both in the choice and no-choice tasks and were kept for analysis. In these 195 neurons, 487 pre- and 80 post-reward epochs (567 epochs) were declared task-related (2.8 epochs per neuron).
Activity of Single ACC Neurons is Modulated by the Task Value in the No-choice Task
To precisely compare levels of activity in trials 1.2 ml, 0.4 ml and 0 ml, we applied a post-hoc Fisher test to the pre- and post-reward epochs. The results are listed in Table 1. They reveal that activity in 17% of pre-reward epochs was the same whether the trial was rewarded or non-rewarded (line 1). Activity in 58% discriminated rewarded from non-rewarded trials (line 9). Activity in 25% was modulated by the task value (line 6). As for the post-reward epochs, activity in 24% did not discriminate reward from no-reward (line 1); activity in 60% discriminated reward from non-reward (line 9) and in 16% activity was modulated by the quantity of received reward (line 6).
To globally assess the influence of motor parameters on the activity levels in the no-choice task, we measured the effect of task values on activity with an ANCOVA (with RTs and MTs as covariates) and with a simple ANOVA. In both analyses, the results were the same. This indicates that the motor parameters RTs and MTs had no detectable effects on the reward-related modulation.
Figure 3 shows examples of a motor-related (cell 1) and of a visual-related activity (cell 2) that are modulated by the task values in no-choice trials. Figure 4A shows a cell with post-reward activity modulated by the received reward.
![Activity of two ACC cells during performance of the no-choice task and of two tests in the choice task. Each raster line displays cell activity recorded during one trial. The time scale is indicated below the last raster on the left. Activity scales are indicated for each cell. Rasters and histograms are aligned on the target touch (Cell 1) and on onset of the target-stimuli (Cell 2). At the right of each raster line, activity in epoch E4 (between the GO-signal and the touch in Cell 1) and in epoch E2 (1 s after onset of the stimuli in Cell 2) are represented along the abscissa on the normalized scale 0–100. In the choice trials, the horizontal solid line ‘R’ in the middle of rasters indicates the beginning of the repetition period. ‘A’ or ‘B’ and ‘0.4 ml’ or ‘1.2 ml’ at the right of each raster line indicates the identity of the touched stimulus and the reward obtained. (The sequence of ‘A’ and ‘B’ is used to construct the performance curve; ‘A’ = 1, and ‘B’ = 0. cf. Fig. 6A.) In Cell 1, the activity in the choice task (around 70) was statistically different from the activity in trial 1.2 ml (Test 1: Z = 2.21, P < 0.027; Test 2: Z = 1.92, P < 0.05, Mann–Whitney U-test) and in trial 0.4 ml (Test 1: Z = −3.46, P < 0.0005; Test 2: Z = −3.25, P < 0.001). In Cell 2, the activity in the repetition of the choice task (around 70) was statistically different from the activity in trial 1.2 ml (Test 1: Z = 3.26, P < 0.001; Test 2: Z = 3.04, P < 0.002) and in trial 0.4 ml (Test 1: Z = −3.25, P < 0.001; Test 2: Z = −3.25, P < 0.001). In both cells, similar patterns of activity were observed in the repetition period of tests [Test 1 versus Test 2 in Cell 1: F(1,19) = 1.42; P < 0.249; Test 1 versus Test 2 in Cell 2: F(1,18) = 0.10; P < 0.757, ANOVA]. In Cell 1, no statistical change of discharge between the first three trials and the last five trials was observed (Test 1: Z = 1.93, ns; Test 2: Z = 1.93, ns).](https://oup.silverchair-cdn.com/oup/backfile/Content_public/Journal/cercor/16/7/10.1093/cercor/bhj046/2/m_cercorbhj046f03_ht.jpeg?Expires=1716579292&Signature=SG1k5ifzk8zDSu0UshsBT7w5u3sjc7QqiGE15R49-Q4kxTeCj3s1TqeDPhulIZJuaxPG1UoL-C1Hq6i5e3kE-gRaPeAElVFDkySFblQ8B6GnKw-XrNxnIzMxPztnnsoM~nONYgIzAECYeTG~rD-tZkLKx85k7DQrAngNLNhsPio6FGwN8ECffuKLrWVhW9muJAr2qm9iROoJNsQ2xX4hzCFCNe3bRwQZhq-l1SLYoblKZWygTbOZDbVJ92W9OTxrs0A27WRZRBItb7BHfRcVKEVOT5h9REhD2LGvUoLuZoP0uH2rWO7HRKLEc8vMVssR~ISh8z26dc0A6hm0vVVu6g__&Key-Pair-Id=APKAIE5G5CRDK6RD3PGA)
Activity of two ACC cells during performance of the no-choice task and of two tests in the choice task. Each raster line displays cell activity recorded during one trial. The time scale is indicated below the last raster on the left. Activity scales are indicated for each cell. Rasters and histograms are aligned on the target touch (Cell 1) and on onset of the target-stimuli (Cell 2). At the right of each raster line, activity in epoch E4 (between the GO-signal and the touch in Cell 1) and in epoch E2 (1 s after onset of the stimuli in Cell 2) are represented along the abscissa on the normalized scale 0–100. In the choice trials, the horizontal solid line ‘R’ in the middle of rasters indicates the beginning of the repetition period. ‘A’ or ‘B’ and ‘0.4 ml’ or ‘1.2 ml’ at the right of each raster line indicates the identity of the touched stimulus and the reward obtained. (The sequence of ‘A’ and ‘B’ is used to construct the performance curve; ‘A’ = 1, and ‘B’ = 0. cf. Fig. 6A.) In Cell 1, the activity in the choice task (around 70) was statistically different from the activity in trial 1.2 ml (Test 1: Z = 2.21, P < 0.027; Test 2: Z = 1.92, P < 0.05, Mann–Whitney U-test) and in trial 0.4 ml (Test 1: Z = −3.46, P < 0.0005; Test 2: Z = −3.25, P < 0.001). In Cell 2, the activity in the repetition of the choice task (around 70) was statistically different from the activity in trial 1.2 ml (Test 1: Z = 3.26, P < 0.001; Test 2: Z = 3.04, P < 0.002) and in trial 0.4 ml (Test 1: Z = −3.25, P < 0.001; Test 2: Z = −3.25, P < 0.001). In both cells, similar patterns of activity were observed in the repetition period of tests [Test 1 versus Test 2 in Cell 1: F(1,19) = 1.42; P < 0.249; Test 1 versus Test 2 in Cell 2: F(1,18) = 0.10; P < 0.757, ANOVA]. In Cell 1, no statistical change of discharge between the first three trials and the last five trials was observed (Test 1: Z = 1.93, ns; Test 2: Z = 1.93, ns).
![Post-reward activity in the no-choice and choice trials. (A) Activity of one cell during no-choice trials aligned on reward delivery. The activity is modulated by the reward amount: 1.2 and 0.4 ml [F(1,66) = 32,89, P < 10−6, ANOVA]. (B, C) Population data. Normalized post-reward activity in trials 0.4 ml, 1.2 ml and choice trials. The average activity in the choice task is shown separately for trials in which the actual reward is 1.2 ml (circle) and 0.4 ml (triangle). The post-reward activity in both search and repetition periods of choice tests is pooled. Task values are in abscissa. (B) 13 epochs in 13 cells for the group 1.2 ≠ 0.4 (see Table 1). The average activity for choice trials is 103.4 and 18.6 for 1.2 and 0.4 ml respectively. (C) 48 epochs in 48 cells for the group (1.2 = 0.4) ≠ 0 (see Table 1). The average activity for choice trials is 96 and 98.4 for 1.2 and 0.4 ml respectively. These data show that the post reward activity depends on the actual amount of reward obtained (trials 0.4 ml versus choice trials in which the current reward is 0.4 ml: t = 1.96, P < 0.052, ns; trials 1.2 ml versus choice trials in which the current reward is 1.2 ml: t = 1.02, P < 0.307, ns, unpaired t-test).](https://oup.silverchair-cdn.com/oup/backfile/Content_public/Journal/cercor/16/7/10.1093/cercor/bhj046/2/m_cercorbhj046f04_ht.jpeg?Expires=1716579292&Signature=SM-3-Hr2eQwGhsWGSN87EjIaYPKRSxuhUw4vV~E9FX0zJ5ZUqamHrhpvgi8z6VUvRqAitEJb8ZLCIvTAtqe7~qpIPz~-jHpV0uTHeBjn0y8-1p71eTKM8d3G66cHJdLNJKN9Y021NIt07yP0OfLKnd9Uda0mN~FJYk5IU2mbdY~qvty4E7zMRbuNnZIK1WNOEGb6n-nuyZT1ekUmVo-uXmnp5tFOEkwame9begHG6dG8ilC2GCWvxDrdoHQNVVd8F0f89kErDcIV3KJXoQtg0LtrFeFw2a0o75SGrSiKPjRRcr359HerC28acgwFLzW9N8CCCBk8WgL54og8trkKng__&Key-Pair-Id=APKAIE5G5CRDK6RD3PGA)
Post-reward activity in the no-choice and choice trials. (A) Activity of one cell during no-choice trials aligned on reward delivery. The activity is modulated by the reward amount: 1.2 and 0.4 ml [F(1,66) = 32,89, P < 10−6, ANOVA]. (B, C) Population data. Normalized post-reward activity in trials 0.4 ml, 1.2 ml and choice trials. The average activity in the choice task is shown separately for trials in which the actual reward is 1.2 ml (circle) and 0.4 ml (triangle). The post-reward activity in both search and repetition periods of choice tests is pooled. Task values are in abscissa. (B) 13 epochs in 13 cells for the group 1.2 ≠ 0.4 (see Table 1). The average activity for choice trials is 103.4 and 18.6 for 1.2 and 0.4 ml respectively. (C) 48 epochs in 48 cells for the group (1.2 = 0.4) ≠ 0 (see Table 1). The average activity for choice trials is 96 and 98.4 for 1.2 and 0.4 ml respectively. These data show that the post reward activity depends on the actual amount of reward obtained (trials 0.4 ml versus choice trials in which the current reward is 0.4 ml: t = 1.96, P < 0.052, ns; trials 1.2 ml versus choice trials in which the current reward is 1.2 ml: t = 1.02, P < 0.307, ns, unpaired t-test).
Activity of Single ACC Neurons during the Repetition Period of Choice Tests
Since pre-reward activity in the no-choice task can be modulated by the task value, what becomes of this activity in the choice task when the task value is a theoretical value based on probabilities? We examined the activity of the pre-reward epochs listed in Table 1 (except line 1) during the repetition. This activity was normalized as described in Materials and Methods.
We first considered the epochs exhibiting different activity in trials 0.4 ml and 1.2 ml (line 6 in Table 1; 115 epochs in 57 cells in the two monkeys). An important step was to assess whether the activity during the repetition was different from the activity in the No-Choice task. The difference with trial 0.4 ml and trial 1.2 ml was significant in 115 and 111 epochs, respectively (at P < 0.05, Mann---Whitney U-test). Figure 3 displays two examples and reveals two important features. First, similar patterns of activity and average discharge rates occurred in two tests. The particular visual stimuli presented were unimportant. Thus, in the following statistical analyses, only the first test utilized to study a cell will be considered. Second, the normalized activity in the successive trials fluctuates around 70 on the 0–100 scale. The population data show that the average activity in the choice trials is also close to 70 (Fig. 5A). This property is true for each epoch taken individually (Fig. 5B).
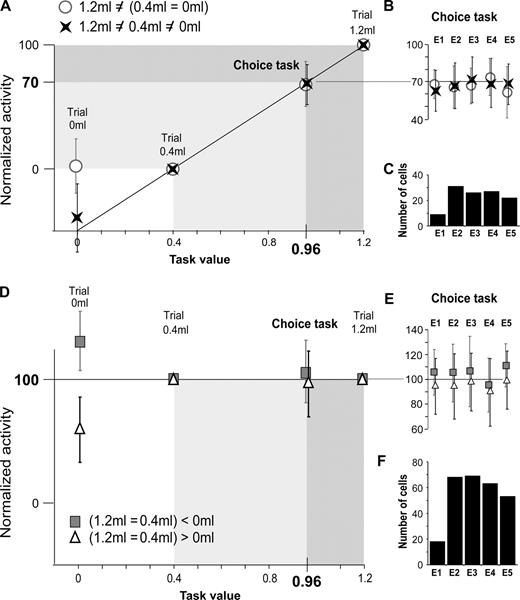
Normalized pre-reward activity in trials 0 ml, 0.4 ml, 1.2 ml, and choice trial. Population data.Task values are in abscissa. Data points in ordinates are the normalized average activities of epochs (mean ± SD) (There is no error-bar for trials 1.2 ml and 0.4 ml, which are equal, in each epoch, to 100 and 0, respectively — see Materials and Methods). Data are from four groups of epochs defined in Table 1 (circles, crosses, triangles and squares). (A–C) Data from 115 epochs in 57 cells for which activity in trial 1.2 ml ≠ trial 0.4 ml ≠ trial 0 ml (crosses, lines 2 and 4 in Table 1) or for which activity in trial 1.2 ml ≠ (trial 0.4 ml = trial 0 ml) (circles, lines 3 and 5 in Table 1). (A) The average activity for the two groups in the choice trials is 68.6 and 67.9, respectively. The average activity (in B) and the cell count (in C) for each epoch considered in (A) are shown. For instance, the histogram in (C) shows that 30 neurons had an average activity in epoch E2 close to the task value. Their average population activity is plotted in (B). (D–F) Data from 271 epochs in 133 cells for which activity in (trial 1.2 ml = trial 0.4 ml) > trial 0 ml (triangels, line 7 in Table 1) or for which (trial 1.2 ml = trial 0.4 ml) < trial 0 ml (squares, line 8 in Table 1). (D) The average activity for the two groups in the choice trials is 95.1 and 104.3, respectively. The average activity (in E) and the cell count (in F) for each epoch considered in (D) are shown. For instance, the histogram in (F) shows that 70 neurons had an average activity in epoch E2 close to 100. Their average population activity is plotted in (E).
In the normalized scale, 70 is a meaningful value. It corresponds to the weighting of activities associated with trials 1.2 ml and 0.4 ml (100 and 0) by their probability of occurrence (0.7 and 0.3) when the optimal stimulus is selected (0.7 ×100 + 0.3 × 0 = 70). The task value — 0.96 ml — corresponds to the same weighting of the two reward quantities (0.7 ×1.2 + 0.3 × 0.4 = 0.96 ml). Thus, in these experimental conditions, the amplitude of pre-reward activity varies in proportion to the task value. When task value is encoded by a neuron, this concerns on the average 2.02 (= 115 epochs/57 neurons) pre-reward epochs. In contrast, post-reward activity encoded the actual quantity of reward received in each trial in the choice task (Fig. 4B).
Figures 4C and 5D,E show that if activity is the same in trials 1.2 ml and 0.4 ml it is also the same, on average, in the choice trials (data from lines 7 and 8 in Table 1; 271 pre-reward epochs in 133 cells and 48 post-reward epochs in the two monkeys). For these cases, the activity levels only contrasted non-rewarded (0 ml) and rewarded trials.
Pre-reward ACC Activity is Stable during the Choices Tests
We tested whether the pre-reward activity measured during the repetition was already observed during the search period. For this purpose, we searched for changes in activity in all epochs in Table 1, except line 1. In 88% (340/386) of epochs, there was no statistical change in activity over the course of the test (e.g. Fig. 3, Cell 1).
In the remaining 12% of epochs (46/386), changes in activity were observed. In these epochs, the neuronal activity was at baseline level during the first trial(s), and then evolved towards the level of activity specific of the repetition period (Fig. 3, Cell 2). We analyzed the temporal relationships between the activity and the performance curves, using the cross-correlation method (Fig. 6A–D). The data showed a significant advance of the performance over the activity in 2% (9/386) of epochs, and no difference or no relation between activity and performance in 5% (18/386). In 5% (19/386) of epochs, the data showed an advance of the activity change over the performance change.
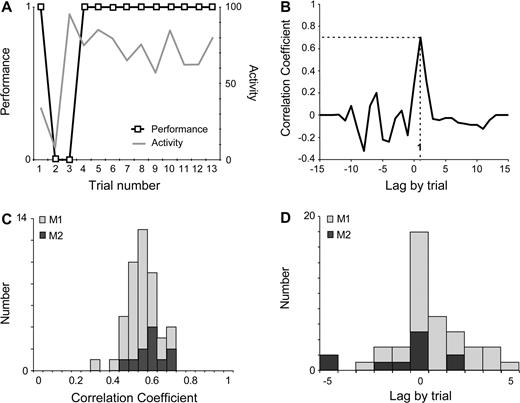
Correlation analysis between performance and activity. (A) Activity curve and performance curve (data are from Cell 2, Test 2 in Fig. 3). (B) Example of correlation analysis between performance and activity (from data in A). Peak correlation (r = 0.7), significant at P < 0.05, at lag +1. The positive lag indicates an advance of the activity over the performance. (C) Population data. Intervals E1 to E5. Distribution of significant peak correlation coefficients in the two monkeys. (D) Population data. Distribution of lags for the peak correlations. Positive lags are more numerous than negative lags (χ2 = 17.42, P < 10−4, Mac Nemar).
In these 46 epochs, we also correlated the activity curve obtained in a test with the reinforcement curves measured in the same test. Three reinforcement curves were considered with, in ordinates, (i) the actual reward obtained in each trial; (ii) the average reward obtained from target A in previous trials; or (iii) the average reward obtained from target B in previous trials. Results obtained cell by cell and epoch by epoch showed non consistent correlations from one test to another. These results suggest that the variations of activity observed in pre-reward epochs are not related to the received rewards.
Spatial Parameters and ACC Activity during the Repetition Period of the Choice Test
We examined the effect of the starting position (origin effect) and of the position of the preferred stimulus (end-point effect) on ACC activity during the repetition period of choice tests. During this period, the direction of the arm-movement varied from trial to trial with the random assignment (Left or Right, 50/50) of the starting position and location of the preferred stimulus. The influence of spatial parameters was not studied in the no-choice trials because the movements of the animals in these trials were biased towards their preferred side, i.e. the target nearest to the acting arm.
The results (Table 2) show that the ACC neurons have access to the spatial parameters of stimuli and movements. Spatial selectivity was observed in 46.2% (145/317) of neurons, in at least one epoch. The starting position had an incidence on activity in 9% — and the position of the preferred stimulus in 29% — of pre-reward epochs. Covariance of the two factors was observed only in a small number (22) of epochs. The position of the optimal stimulus determined the level of activity in 19% of the visual epochs, and in 38% of the arm-movement-related epochs. Figure 7 illustrates the activity of two spatially selective ACC cells.
![Spatial selectivity of ACC neurons. Cell 1 and Cell 2 were recorded in the left and right ACC of M1, during the repetition in two tests. Positions of letters ‘A’ and ‘B’ in the insets designate the position of the optimal and non-optimal stimulus. Cell 1 is more active when the optimal stimulus is located on the right [Left versus Right, epoch E2: F(1,22) = 867.9, P < 10−6). Cell 2 is more active when the arm-movements are directed towards the right position [Left versus Right, epoch E4: F(1,31) = 239.65, P < 10−6].](https://oup.silverchair-cdn.com/oup/backfile/Content_public/Journal/cercor/16/7/10.1093/cercor/bhj046/2/m_cercorbhj046f07_ht.jpeg?Expires=1716579292&Signature=AvgdVp3N~UFh9UQ~ANOHy8nPxFkEBumrcrElLLUc015WHKM~lNognf4J3BHiiXfksIcluRBGOVQ1zLk3GRQB6lTD-sr0PWf4G-~97uy8290t45qKm2FFTTEJt1MEguK6jqFeybwBtBU5CSZuJXDkYG8nqa-tv9Xlc36nBpQurfYuAWuQ2unM4bGdS1CIwefb1Esnmnec1AHvgLrik2di0O5Uz2CNcQhwSa5VLcn~TxDtY0xu9JK6iuiGWpEYaW4IBbyJIYRPDIS4m3-RL-kscyOH~9g-gVeNcQdZn7oDax59iyHsyCYFW8R--guTSXdzKUVH16aM05yDACFFJOTnOA__&Key-Pair-Id=APKAIE5G5CRDK6RD3PGA)
Spatial selectivity of ACC neurons. Cell 1 and Cell 2 were recorded in the left and right ACC of M1, during the repetition in two tests. Positions of letters ‘A’ and ‘B’ in the insets designate the position of the optimal and non-optimal stimulus. Cell 1 is more active when the optimal stimulus is located on the right [Left versus Right, epoch E2: F(1,22) = 867.9, P < 10−6). Cell 2 is more active when the arm-movements are directed towards the right position [Left versus Right, epoch E4: F(1,31) = 239.65, P < 10−6].
Relationship between spatial and reward selectivity could not be studied clearly within the same task (see above). However, it is interesting to note that 28 cells (28/145 cells) with pre-reward activity showing a spatial effect in the choice task also showed a reward effect in the no-choice task (nine cells contrasted trials 0.4 ml and 1.2 ml; and 19 cells contrasted non-rewarded and rewarded trials).
Behavioral Deficits after Muscimol Injections in the ACC
The electrophysiological results show that the ACC encodes two parameters in the choice task (the task value and the size of obtained reward), which may be important for the identification of the optimal stimulus. We tested whether deactivation of this structure impaired task performance.
We injected muscimol (i.e. a GABA agonist) and saline (i.e. control) solutions where task-related neurons were recorded. Bilateral injections were made only in the second monkey, M2. The uncooperativeness of M1 prevented us from studying the effects of bilateral injections with this animal. Data were obtained from four unilateral saline (29 tests) and four unilateral muscimol (52 tests) sessions with M1, and four unilateral saline (31 tests), four unilateral muscimol (35 tests) and two bilateral muscimol (25 tests) sessions with M2.
In both monkeys, saline or muscimol injections did not induce impairment in gross behavior during the testing sessions nor later in their home cage. They worked daily for approximately the same amount of time (1 h), their motivation was apparently unaffected, and we did not detect loss of appetite. In the saline sessions, performance in the choice and no-choice tasks was normal and identical to that observed earlier during neuronal recordings.
Muscimol injections impaired performance in the choice task. Immediately after the injections, monkeys found the optimal stimulus of choice tests at chance levels (Fig. 8A). Performance in the no-choice task was at normal level. The deficit was most evident at the beginning of the testing period (period 1, Fig. 8A). The animal then slowly recovered, and after 60 min the performance was similar to that observed after saline injections. The proportion of successful searches was not statistically different after unilateral or bilateral injections (69 and 54% of choice tests, respectively; ns, P > 0.24) (data pooled from both monkeys for the unilateral injections).
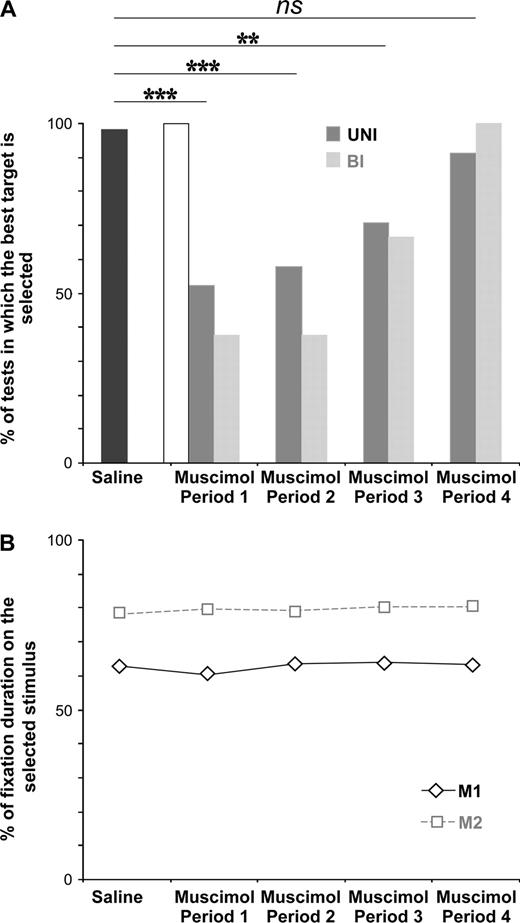
(A) Evolution of the performance in the choice task after unilateral (UNI) and bilateral (BI) muscimol injections in the ACC. Abscissa, Period 1: 0–15 min after the last muscimol injection; Period 2: 15–30 min; Period3: 30–45 min; Period4: 45–60 min. Ordinates: percentages of tests in which the good stimulus is discovered. The saline results in the four periods are pooled. Data are from 70 saline, 87 UNI-muscimol and 25 BI-muscimol choice tests. The data show a deficit during the first 45 min of the muscimol sessions. Difference at P < 0.001 (**) and at P < 0.0001 (***). During Period 1 and Period 2, following unilateral and bilateral muscimol injections, performance is at chance level (50%) (Period 1: UNI: P < 0.897, ns; BI: P < 0.636, ns. Period 2: UNI: P < 0.667, ns; BI: P < 0.636, ns). The empty bar shows the performance in period 1 after muscimol injection for stimuli that had already been identified in the retraining period. (B) Evolution of fixation duration on the selected target in the saline and muscimol sessions. Abscissa as in (A). Ordinates: percentage of fixation duration on the selected target during performance of choice tests. Data are from the same tests as in (A). Within the trials, M1 fixated the selected target 63% of time and M2 80% (saline versus Period 1: M1: P < 0.569, ns; M2: P < 0.644, ns; saline versus Period 2: M1: P < 0.853, ns; M2: P < 0.825, ns; saline versus Period3: M1: P < 0.824, ns; M2: P < 0.620, ns; saline versus Period4: M1: P < 1, ns; M2: P < 0.616, ns).
The poor performance of the animal resulted from a defective strategy. After muscimol injections, the animals were still able to select one particular stimulus (A or B) during 10 successive trials in a majority of choice tests (101/112 = 90%) but tended to continue selecting the stimulus chosen in the first trial, regardless of the quantity of reward obtained. This is illustrated in Figure 9, which shows the frequent use of both the small-keep and the large-keep strategies at the beginning of tests. The strategy of the animal was ‘keep’, whatever the size of the reward obtained (large or small), and whatever the position of the selected stimulus. This abnormal ‘keep’ strategy led to the frequent choice of the non-optimal stimulus, and to a shorter duration of the search period (In M1: 1.8 trial with muscimol versus 3.7 trial with saline, different at P < 2 × 10⁻³; In M2: 3.8 trials with muscimol versus 8.7 trial with saline, different at P < 6 ×10⁻⁶, Wilcoxon paired test). Spatial perseveration, which would have prevented choosing the same stimulus in the successive trials, was not observed.
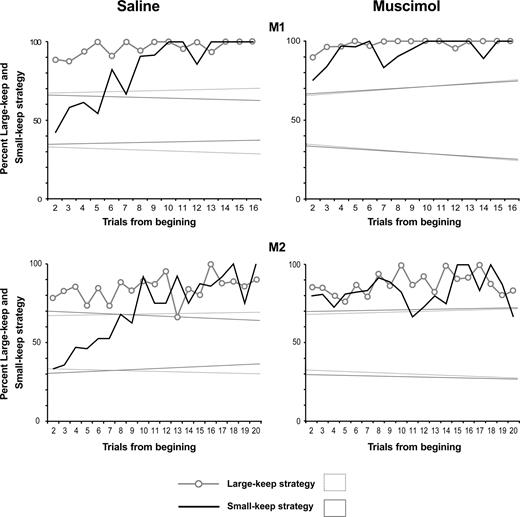
Usage frequency of the ‘large-keep’ and ‘small-keep’ strategies in the choice trials, in the saline and muscimol sessions. Frequencies are averaged over all tests. The ordinates show the percent of trials using these strategies. The plots are aligned on the second trial of tests. In the saline sessions (plots on the left), the usage frequencies of the small-keep and large keep strategies in both monkeys are similar to those observed during the electrophysiological recordings (in Fig. 2C). In the muscimol sessions (plots on the right), the usage frequency of the strategy ‘small-keep’ at the beginning of tests is higher than in the saline sessions. Comparison of the four first trials in monkey 1 (χ2 = 7.6, P < 0.006) and of the eight first trials in monkey 2 (χ2 = 7.7, P < 0.005). The usage frequency of the strategy ‘large-keep’ is the same in the muscimol and in the saline sessions in M1 (χ2 = 0.01, ns at P < 0.05) and in M2 (χ2 = 0.02, ns). These data indicate that, in the muscimol sessions, the ‘large-keep’ or ‘small-keep’ strategies are prevalent in all trials. The strategy of the animal is ‘keep’. Dotted lines: confidence limits (at P < 0.05) of the null hypothesis, i.e. no strategy, random choices.
Oculomotor activities were analyzed during the repetition period of choice tests during saline and muscimol sessions. The search periods were not analyzed because they were rarely observed during muscimol sessions. Our results indicated that the number of saccades per trial, as well as the duration of fixation on the chosen target remained stable across saline and the four muscimol periods (Fig. 8B) for both monkeys [number of saccades in M1: F(4,859) = 2.37; P < 0.0506, ns; number of saccades in M2: F(4,623) = 1.51; P < 0.1982, ns; duration of fixation on the preferred target in M1: F(4,858) = 2.11; P < 0.0781, ns; duration of fixation on the selected target in M2: F(4,623) = 0.56; P < 0.6944, ns]. Furthermore, during the saline and the four muscimol sessions, M1 and M2 fixated the selected target 63 and 80% of time, respectively (Fig. 8B). Note that the percent of fixation duration on the selected stimulus in the saline sessions was similar to the one observed during the electrophysiological recordings (M1: P < 0.598, ns; M2: P < 0.625, ns). Consequently, the poor performances observed in the muscimol session cannot be attributed to oculomotor deficits.
In contrast, the animals systematically chose the optimal stimulus when this stimulus had been identified prior to the injections (e.g. during the retraining period). In the first period following transient deactivation of the dorsal ACC (i.e. 0–15 min after the last muscimol injection), the animals selected this stimulus in 100% of cases (96/96 trials) (Fig. 8A, period 1, empty bar).
In a few muscimol tests (11/112 = 10%), animals were unable to select one particular stimulus during 10 successive trials, even after 50 trials. This situation never occurred in the saline sessions, and was observed mostly in M2 after bilateral muscimol injections. Clearly, it was not the consequence of a spatial deficit (e.g. a perseveration towards the preferred side). The preferred location (left for M1 and right for M2) was selected in 71% of trials in these tests and in 64% of trials in the saline tests (ns, P > 0.05) (data pooled from the two monkeys).
In the unilateral saline and muscimol sessions, the animals worked with the arm contralateral to the injections. The time to initiate a trial (time between onset and touch of the starting position) was statistically the same in all sessions for both monkeys. During the first 15 min following the muscimol injections (corresponding to period 1 in Fig. 8), the movements to the selected target were characterized by lower RTs and MTs compared to those of the saline sessions (period 1 muscimol versus saline: MTs: t = 2.28, P < 0.02; RTs: t = 5.56, P < 0.01, unpaired t-test) (data pooled from the two monkeys). RTs and MTs were recovered after period 1.
Discussion
During the choice task, monkeys adopted an optimal strategy by identifying in successive trials which of two paired stimuli is associated with the optimal average reward (the task value) and in maintaining this choice in subsequent trials. Our data reveal that during search and repetition periods of the task, ACC activity encoding the onset of the stimuli and the execution of movements correlated with the task value. They also reveal that neurons encoded the size of obtained rewards. The importance of these activities for the successful adaptation of behavior is suggested by the detrimental effect of ACC inactivation on the search for the good stimulus.
The ACC Encodes the Task-value
We confirm that a majority of ACC activity (pre- and post-reward) discriminates rewarded from non-rewarded situations (Matsumoto et al., 2003). This discrimination is fundamental in the regulation of behavior. Moreover, while our data corroborate findings that some ACC neurons respond to reward delivery (Koyama et al., 2001; Akkal et al., 2002; Shidara and Richmond, 2002), we demonstrate for the first time that the reward quantity received in each trial is encoded by ACC activity. This was observed in 16% (13/80, Table 1) of the ACC neurons responding to reward delivery. The ability to discriminate between the small and the large reward is a key stage in the discrimination of the two stimuli in the choice task.
Importantly, the neuronal activity is modulated by the task value in 25% (115/467) of pre-reward epochs (in 29% — 57/195 — of ACC neurons), independently of whether the value is computed based on probabilistic or certain rewards. In the choice task, the task value defines the optimal stimulus and may be used as a template in identifying the solution. This hypothesis is supported by the fact that the task value is encoded at the onset of search periods. The average value of the non-optimal stimulus (target ‘B’) is ignored.
One limitation of this study is that we tested the same task value (0.96 ml, associated with the probability ratio 0.7/0.3) in the two monkeys in the choice tests. In our view, this task value optimized four factors: difficulty of the task — designed to be relatively difficult — duration of the search period, high performance level and motivation to search for the optimal stimulus. Further investigations — using tasks different from the choice task, like the one used by Sugrue et al. (2004) — would be necessary to confirm the ability of single ACC neurons to encode different task values based on probabilistic contexts.
The possibility that modulation of pre-reward activity is not related to task values but rather to other factors, such as the visual attributes (shape, color) of the stimuli, can be discounted. For instance, in the choice tests, the level of activity in response to different pairs of stimuli reached similar values (i.e. 70 or 100 on the normalized scales), regardless of the visual characteristics of the competing stimuli. An oculomotor interpretation of change in firing rate is also unlikely, given that oculomotor activity is similar in both choice and no-choice tasks, and to date neuronal ACC activity revealed no temporal correlation with saccade execution (Procyk et al., 2000; Amiez et al., 2005). According to ANCOVAs, the characteristics of arm-movements (i.e. MTs and RTs) did not influence activity variations. Finally, variation of ACC activity could not reflect variations in arousal although reaction times varied between the different trials, i.e. for different task values. Indeed, in the no-choice task, trials with large and small rewards were mixed such that any global arousal effect was equally present for both trials and could not interfere with the reward size effect.
The ACC and the Behavioral Space
Our data showed that ACC neurons have access to the spatial parameters of stimuli and movements. They suggest that the ACC constructs sensorimotor mappings of items of the environment indexed by their reward value and spatial position. These data are supported by those obtained by Procyk et al. (2000). Hoshi et al. (2005) have also shown that neuronal activity within the ACC is dependent on the spatial location of visual stimuli, on the direction of the movement and on the arm used in a target-reach movement task in which the target location and the arm to be used were instructed by two successive cues.
Our data provide no evidence of a topographical organization of spatial parameters in the ACC. Neurons selective for one position (R or L) were recorded in close proximity to neurons selective for the other position. Moreover, our unilateral deactivations of the ACC with muscimol induced no significant neglect — or preference — for one side or another. These data are supported by human literature that has reported no asymmetry in spatial behaviors after unilateral focal lesion of the ACC (Turken and Swick, 1999).
Relations to Other Structures
The modulation of neuronal activity by the task value — tested with several fixed rewards — has been already described in structures interconnected with the ACC, including prefrontal cortex (Watanabe, 1996; Leon and Shadlen, 1999; Hikosaka and Watanabe, 2000; Watanabe et al., 2002; Wallis and Miller, 2003), parietal cortex (Platt and Glimcher, 1999; Sugrue et al., 2004), posterior cingulate cortex (McCoy et al., 2003), striatum (Tremblay et al., 1998; Hassani et al., 2001; Itoh et al., 2003) and mesencephalic dopaminergic neurons (Fiorillo et al., 2003). Whether and how all these structures encode the task value in probabilistic conditions such as the choice task remains to be determined. Recent works suggest that parietal cortex and dopaminergic neurons contribute to the computation and use of task values in probabilistic context (Fiorillo et al., 2003; Sugrue et al., 2004).
In orbitofrontal cortex (OFC), neuronal activity also depends on the expected reward value (Wallis and Miller, 2003). We recorded neuronal activity from the OFC in M1 and M2 during performance of the choice task (Amiez and Joseph, in preparation). During the search period, the activity of OFC neurons remains close to that observed in trial 0.4 ml; during the repetition period, the activity is not proportional to the task value, but is equal to that observed in trial 1.2 ml. These data can be interpreted in the framework of preference encoding (Tremblay and Schultz, 1999).
How is the ACC information integrated at the system level? To be effective the task value must be used as the reference value during successive trials. One possibility is that the task value is compared to stimulus-specific reward information updated in the dorsolateral prefrontal cortex. Recent work suggested that reward-based response selection might involve a particular bond between ACC activity representing reward–response associations and lateral prefrontal cortex activity (Matsumoto et al., 2003). Our model (see Appendix) shows that a decision-test using comparison of a stimulus value with the task value is a key component to generate optimal performance in the choice task and that this comparison has to be continuously updated to avoid perseveration on incorrect choices.
Deactivation of the ACC and Discovery of the Optimal Stimulus
We show that after ACC deactivation with muscimol, the animal does not cease to work for reward, but selects the optimal stimulus at chance level. There is a tendency to reselect in successive trials the stimulus selected in the first, regardless of the reward obtained in that trial.
The deactivation of the ACC does not induce a general impairment in all aspects of stimulus selection. When presented with a pair of stimuli in which the optimal stimulus had already been discovered during the retraining period prior to the injections, the optimal selection was maintained. The animal thus repeats the choices made in previous tests. This result is coherent with the fact that, within a choice test, the animal also repeats the choices made in the first trial. Furthermore, when presented with trial 0 ml, there was reluctance to work. Learned behavioral reactions remain unaffected by ACC deactivation.
Hadland et al. (2003) have also shown that bilateral ACC lesions do not interfere with the performance of learned visual discriminations. Further, they claimed that the lesions failed to impair learning of new discriminations and concluded that the ACC does not establish the relationships between stimulus and reward, but instead establish those between response and reward. Furthermore, Shima and Tanji (1998) have reported that inactivation of the cingulate motor area (CMAr) induced an inability to switch motor responses when selection was instructed by decrements in reward level, but not when the switch was instructed by an auditory cue. They suggested that the ACC is concerned with reward-based motor selection.
The poor performance in our task cannot be explained by a defective response selection or by a motor deficit. The motor responses were not erratic, but instead varied according to the position of the stimulus selected in the first trial. So, in contrast to the results of Hadland et al. (2003), we show that dorsal ACC deactivation does interfere with visual discrimination learning in the choice task. We propose that the ACC is only modestly involved when the learning of simple reward-based visual discrimination simply requires the ability to discriminate a rewarded stimulus from a non-rewarded one (e.g. paradigm of Hadland et al.). In contrast, the ACC is strongly implicated in stimulus–reward association learning when competing stimuli are rewarded according to a probabilistic rule, and when the discrimination requires a relatively long period of time (e.g. the choice task). We propose that the deficit observed after muscimol injections results from an inability to use the outcomes of action and/or the task value.
Role of the ACC
In line with the conflict-monitoring hypothesis (Botvinick et al, 2001), one could suggest that, in the choice task, conflicts between stimuli or between responses are more likely to occur during the search period than during the repetition period. In this hypothesis, the ACC is a conflict detector, and its activity should be different in the two periods. Our data show that the activity is nearly the same. This indicates that the hypothesis of a role for the ACC in conflict monitoring does not account for the present data. A similar conclusion has been made previously using other protocols (Nakamura et al., 2005).
The concepts of executive attention or attention to action (Posner et al., 1988; Passingham, 1996) are too general to characterize accurately the role of the ACC in the choice task. However, our data fit with recent propositions about the role of the ACC in monitoring actions in relation to outcomes (Rushworth et al., 2004), and this function might be seen as a particular dimension of attention to action.
A key function of the human and non-human primate ACC would be to construct representations of the task value in given situations. It is likely that this process relies on the integrity of a specific network composed of the ACC, the lateral PFC, the ventral striatum, the orbito-frontal cortex and the dopaminergic system (Schultz, 2000). The task value is contextual and might be based on a cost–benefit analysis, i.e. both on the value of the expected outcome and on the cost of performing the corresponding action (Rushworth et al., 2004). We propose that these representations, embedded in the sensorimotor activity, are used to guide behavioral choices.
To become efficient, the representations of the task value must be updated when environmental reward contingencies are modified. We propose a reiterant circular process in which, firstly, the online processing of negative and positive outcomes modifies task values. Updating of the task values by integrating outcomes is fundamental to rapid adaptations of behavior. Secondly, outcomes are evaluated in relation to existing task values constructed through successive trials. Here, the relative encoding of outcomes is important for appropriate reactions to particular contexts and expectancies. Alteration of this function would lead to aberrant decision-making and abnormal reward seeking such as those observed in drug addiction.
Appendix
Using data obtained in monkeys trained in the choice task as a reference, we tried to model the behavior of the animal in terms of global performance and pattern of choices.
Following the analysis of behavior and neuronal activity in the ACC during the choice task, we hypothesized that two main parameters should be important to solve the task: (i) a rapid trial to trial adaptation to reward size; and (ii) an evaluation of stimulus values relative to the optimal reward, i.e. to the task value. We thus introduced and tested both parameters in the model which was compared to the performance and strategies of the animals.
Programming
The algorithms used to model monkeys' behavior were developed using MatLab programming. Random values (X) uniformly distributed in the interval (0,1) were generated with the function rand(). They were used to generate reward sizes and choices in each trial.
The reward size associated with each choice is given according to: If A is chosen and X ≥ 0.3 then reward size is 1.2; else reward size is 0.4 (70% large rewards). If B is chosen and X ≥ 0.7 then reward size is 1.2; else reward size is 0.4 (30% large rewards).
Two main parameters were used to evaluate performances: Percent of repetitions of target B, and mean number of trials in the search period. A repetition was counted when, as for monkeys' behavioral evaluation, five identical successive choices were followed by five choices in which at worst one choice was different from the others. For instance, series like A–A–A–A–A–A–A–A–A–A and A–A–A–A–A–A–A–B–A–A were identified as repetitions of target A.
Initial Testing
The initial limited version of the model is based on the assumption that the search behavior in the choice task follows a strategy of adaptation to the size of reward received: the large-keep/small-keep strategy. In this version, the average values of rewards obtained with stimulus A and B are not taken into account in the successive trials.
The first choice (A or B) is randomly made (pA = pB = 0.5). Subsequent choices were then determined by the large-keep/small-keep strategy, which follows a biased random rule similar to that observed in animal's behavior (Fig. 2C); At this stage, the bias is used as a parameter to test the influence of this strategy on the overall performance. For instance, if a 80% large-keep / 50% small-keep strategy is used (Fig. 2D, 80/50 in the abcissa, first group from left), then choice N + 1 is a repetition of choice N with a probability 0.8 if the reward in N was large (1.2) and with a probability of 0.5 if reward in N was small (0.4). We ran the model on five sessions (5 × 5000 trials) for different large-keep/small-keep strategy features (100/50, 80/50, 60/50).
The results show that both large-keep and small-keep tendencies have an influence on performance. Increasing the frequency of large-keep (i.e. increasing the tendency to repeat a choice when it is rewarded by a large reward) improve performance at all levels (Fig. 2D, left diagram). However in this configuration the model makes proportionally more incorrect choices (i.e. chose B in repetition) than what was observed in monkeys (13.9% in the model versus 2 and 5% in monkeys).
The behavioral data in monkeys also show that the small-keep strategy increases in the successive trials of test (Fig. 2C). Increasing the frequency of small-keep (i.e. increasing the tendency to repeat a choice when it is rewarded by a small reward) reduces the average length of searches but it also increases the number of repetition in which B is chosen (average for 80% large-keep / 100% small-keep strategy: 52.1% of repetition with B, not illustrated). Thus, logically, increasing the tendency of small-keep induces a tendency to choose B. At this stage, the model is globally worse than the monkeys.
Including the Task Value
To improve the model we added a decision-test module. This test corresponds to the evaluation/comparison of stimulus values to the optimal value, i.e. the task value. The task value (0.96 ml) is defined in the core of the paper.
Initial choices are made using a large-keep/small-keep strategy of 80/50 as observed in monkeys (see Fig. 2C). After each reward, the value of the just chosen stimulus is evaluated by computing the average of all rewards obtained with this stimulus from the beginning of the test. Each stimulus value is then separately tested for being within the range task value ± limit. If one of the stimulus values is within the task value limits, then this stimulus is chosen to enter the repetition phase. At that point the large-keep/small-keep strategy is abandoned and choices are made according to the evaluation of stimuli relative to the task value. The limit was varied in order to define the influence of the precision of the evaluation on global performance. A limit of 0.15 corresponds to the range 0.8–1.2 ml (Fig. 2D, second group from left ).
During this stage, the model did not allow a return from repetition if, later, the stimulus value was going out of the limits. Results show that whereas searches were short enough to mimic monkeys' behavior, a large number of repetitions were made choosing the incorrect target (B) (Fig. 2D, model ‘no return’). We thus modified the test to continuously evaluate — even during repetition — whether the value of the stimulus chosen (A or B) stayed within the limits around the task value. If not, the alternative choice was made. The data (Fig. 2D, model ‘return’, third group from left) show that in this condition both the duration of searches and the proportion of B chosen in the repetitions reach values similar to those obtained with monkeys (e.g. for limit = 0.15, percent repetition with B = 3.3%, mean searches = 4.14 trials). At this stage, the model reproduces well monkeys' performance in the choice task.
We finally evaluated the influence of the task value (0.96) by using other values corresponding to the maximum reward (1.2), the average reward (0.8) with random choices, and the average reward when B is chosen (0.64) (Fig. 2E, first group from left). They show that the best performance is obtained with the real task value (0.96). However, the search length for the model is shorter than for monkeys. This reveals that other parameters not taken into account in the model (level of attention, motivation, etc.) might influence the performance of monkeys in the choice task.
To summarize, the model showed that a decision-test using comparison of a stimulus value with the task value is a key component to produce good performance in the choice task. This comparison must be made continuously to avoid perseveration on incorrect choices. The encoding of the task value all along the repetition period in the monkeys' ACC support the hypothesis that this is indeed the strategy used to solve the task.
We thank Dr. H. Kennedy for his helpful comments. Authors are supported by INSERM, CNRS, ACI Neurosciences Integratives and the Fyssen foundation.
References
Akkal D, Bioulac B, Audin J, Burbaud P (
Amiez C, Joseph JP and Procyk E. (
Botvinick MM, Braver TS, Barch DM, Carter CS, Cohen JD (
Bush G, Vogt BA, Holmes J, Dale AM, Greve D, Jenike MA, Rosen BR (
Fiorillo CD, Tobler PN, Schultz W (
Gallistel CR, Fairhurst S, Balsam P (
Gehring WJ, Willoughby AR (
Hadland KA, Rushworth MF, Gaffan D, Passingham RE (
Hassani OK, Cromwell HC, Schultz W (
Hikosaka K, Watanabe M (
Hoshi E, Sawamura H and Tanji J (
Itoh H, Nakahara H, Hikosaka O, Kawagoe R, Takikawa Y, Aihara Y (
Judge SJ, Richmond BJ, Chu FC (
Koyama T, Kato K, Tanaka YZ, Mikami A (
Krawczyk, D.C. (
Leon MI, Shadlen MN (
Matsumoto M, Suzuki W, Tanaka K (
McCoy AN, Platt ML (
McCoy AN, Crowley JC, Haghighian G, Dean HL, Platt ML (
Mitz AR, Godschalk M, Wise SP (
Morecraft RJ, Van Hoesen GW (
Morecraft RJ, Geula C, Mesulam MM (
Nakamura K, Roesch MR, Olson CR (
Platt ML, Glimcher PW (
Porrino LJ, Crane AM, Goldman-Rakic PS (
Posner MI, Petersen SE, Fox PT, Raichle ME (
Procyk E, Joseph JP (
Procyk E, Tanaka YL, Joseph JP (
Rushworth MF, Walton ME, Kennerley SW, Bannerman DM (
Shidara M, Richmond BJ (
Shima K, Tanji J (
Sugrue LP, Corrado GS, Newsome WT (
Tremblay L, Schultz W (
Tremblay L, Hollerman JR, Schultz W (
Turken AU, Swick D (
Van Veen V, Carter CS (
Wallis JD, Miller EK (
Walton ME, Devlin JT, Rushworth M (