


Abstract
EphB2, a receptor tyrosine kinase regulated by the β-catenin/Tcf4 complex, is expressed in the proliferative compartment of mouse intestine and regulates bidirectional migration of intestinal precursor cells in the crypt-villus axis through repulsive interaction with Ephrin-B ligands. Recently, it has been shown that reduction of EphB activity accelerates colon tumour progression in the ApcMin/+ mice. In this study, we examined the expression of EphB2 in normal colon, adenomas, primary colorectal cancers (CRCs), lymph node metastases and liver metastases using immunohistochemistry on tissue microarrays. In addition, EphB2 was overexpressed in SW480 colon cancer cells to study its effect in vitro . We found that EphB2 was expressed in 100% of normal colon crypt base cells, 78% of adenomas, 55.4% of primary CRCs, 37.8% of lymph node metastases and 32.9% of liver metastases (all differences were statistically significant at P < 0.001 compared with primary CRCs). Patients with CRCs that lose EphB2 expression had more advanced tumour stage ( P = 0.005), poor differentiation ( P < 0.001), poor overall survival ( P = 0.005) and disease-free survival ( P = 0.001), with the latter being independent of tumour stage. In vitro studies showed that overexpression of EphB2 inhibited colon cancer cell growth in colony formation assay and activation of EphB2 receptor inhibited colon cancer cell adhesion and migration. Our data demonstrated a progressive loss of EphB2 expression in each critical step of colon carcinogenesis, including the onset of invasion, dedifferentiation and metastasis which are paralleled by adverse patient outcome. EphB2 may achieve its tumour suppressor function through regulation of cell survival, adhesion and migration.
Introduction
Eph receptors, members of the receptor tyrosine kinase family, are expressed in diverse cell types in both embryonic and mature tissue. They contribute to key developmental processes through regulation of cell sorting and cell migration. This is achieved through binding of Eph receptors to their ligands, ephrins, expressed on an adjacent cell surface, which leads to bi-directional signalling and results in cell-cell repulsion. This repulsive interaction has been shown to be important in cell sorting that contributes to body segmental patterning, axon guidance, synapse formation and angiogenesis [reviewed in refs ( 1 , 2 )]. Eph receptors are divided into two subclasses: A or B, according to their different ligands. A recent study has found a reverse gradient of expression of the EphB receptors and ephrin ligands in mouse intestine ( 3 ). This reverse gradient, together with the repulsive interaction of EphB/Ephrins, contributes to cell sorting and bi-directional migration of intestinal precursor cells. The expression of EphB2 in adult mouse intestine is of particular interest, as it is expressed in the proliferative/stem cell compartment of the crypt, whereas its ligands, Ephrin-B1 and Ephrin-B2, are expressed in the differentiating villus compartment. Furthermore, EphB2 −/− EphB3 −/− mice display intermingling and mal-positioning of proliferative and differentiating cells, thus implicating their roles in maintaining the correct positioning of the proliferative compartment in the crypt-villous axis.
Apart from development, emerging data also suggest the potential involvement of Eph receptors in tumorigenesis. Elevated expression levels of various Eph receptors, including EphB2, have been reported in diverse tumour types, including colorectal cancer (CRC). Elevated expression has been proposed to promote tumorigenesis by modulating cell motility, invasion, metastasis and angiogenesis [reviewed in ref. ( 2 )]. A strong association exists between activation of the wnt signalling pathway, a key physiological regulator of intestinal precursor cell growth that is commonly targeted by tumorigenesis and EphB2 expression. As an example, disrupting β-catenin/Tcf4 activity in CRC cells leads to down-regulation of EphB2 ( 4 ). Furthermore, knocking out the Adenomatous Polyposis Coli (APC) gene leads to up-regulation of EphB2 in mouse intestine ( 5 ), whereas adenovirus-mediated forced expression of the wnt antagonist Dickkpot-1 leads to the repression of EphB2 in mouse intestine ( 6 ). Moreover, the EphB2 expressing cells in mouse intestine coincide with the proliferative zone crypt cells which also show evidence of activated wnt signalling with nuclear β-catenin accumulation ( 4 ). Since constitutive activation of wnt signalling, mainly due to mutations in APC or β-catenin genes, occurs in the majority of CRCs and constitutes an early and critical step in adenoma development ( 7 , 8 ), it is plausible to expect that EphB2 would be substantially over-expressed in most colorectal tumours. Indeed, overexpression of EphB2 has been reported in colon cancer cell lines and tissues ( 9 , 10 ), as well as in diverse cancer types. However, there are conflicting data regarding EphB2 in different cancer types, especially on its putative function as an oncogene or a tumour suppressor gene. In breast cancer, over-expression of EphB2 was reported to be associated with poor survival ( 11 ). In brain tumours, EphB2 is over-expressed in glioblastoma compared with low grade glioma and normal brain, and forced expression promotes migration and invasion of glioma cells in vitro ( 12 ). However, in a recent study, inactivating mutation of EphB2 was discovered in a proportion of prostatic cancer. Transfection of wild-type EphB2 into a prostate cancer cell line lacking functional EphB2 resulted in the suppression of growth and colony formation, similar to that seen after transfection with wild-type p53 ( 13 ).
In a recent report, Batlle et al . ( 14 ) examined a small series of human colon adenomas and cancers, and noted a downregulated expression of EphB2 in most colon cancers but not in small adenomas or aberrant crypt foci, despite the presence of activated wnt signalling in these tumours. Furthermore, reduction of EphB activity by transgene expression of a dominant negative EphB2 promoted tumour formation in the colon and rectum of ApcMin/+ mice, providing strong evidence that the EphB receptor activity suppresses CRC progression. However, the human tumour sample size of the study was rather small, restricting statistical power for exploration of relationship with clinico-pathological parameters. As a result the relationship between EphB2 expression and clinical outcome was not determined. Also only a small number (six cases) of metastatic CRCs were examined. In this study, we examined the expression of EphB2 in a large series of colorectal normal mucosa, adenoma, carcinoma and their lymph node or liver metastases using tissue microarray (TMA). This method allowed us to elucidate the chronology of EphB2 expression and their roles in CRC progression, metastasis and prognosis. We further characterized the effect of EphB2 expression using in vitro system to gain an understanding of how the expression of EphB2 regulates colon cancer cell behaviour.
Materials and methods
Colon clinical samples and TMA construction
Paraffin blocks containing consecutive cases of colorectal adenomas, primary colorectal carcinomas, lymph node metastases and liver metastases were retrieved from the archives of the Department of Pathology, Queen Mary Hospital. Areas of adenoma, invasive carcinoma, lymph node and liver metastases were identified under microscope in the corresponding H&E stained slides and 0.6 mm diameter tissue cores were punched from the corresponding areas of the paraffin blocks and transferred to a recipient block using a Tissue Microarrayer (Beecher Instruments, Silver Spring, MD). For each specimen at least three cores of tumour tissue were arrayed. This 3-fold redundancy in TMA analysis has been validated as highly comparable with analysis of the whole section in CRC ( 15 ). In approximately one-third of cases corresponding normal colon tissues were included in the array for comparison. A small number of cases were eventually excluded from the study due to loss of tissue on the TMA, no cancer tissue on the histo-spot or absence of low molecular weight cytokeratin (anti-Cam5.2) expression indicating poor preservation of antigen. The TMA study finally included 345 primary CRCs from patients who underwent colectomy as their primary form of treatment, paired normal colon mucosa from 111 patients, paired lymph node metastases from 98 patients and paired liver metastases from 35 patients. In addition, hepatic resection of metastatic adenocarcinoma of colon from an independent group of 47 patients (giving a total number of 82 liver metastases) were also retrieved for comparison with primary CRC. One hundred adenomas derived from 73 patients were also included in the study. The clinical data of these cases were collected through review of the hospital record and summarized in Tables I and II . Whole paraffin sections from 14 cases of adenoma with malignant changes were included to examine for the topographical distribution of EphB2 expression in various parts of the tumours. This study was approved by the Ethics Committee of The University of Hong Kong and Internal Review Board of UCSF.
Clinico-pathological data of 345 CRC patients
| Sex |
|---|
| M = 190 (55.1%) |
| F = 155 (44.9%) |
| Age |
| Mean = 67.99 ± 11.8 (range 31–94) |
| Tumour side |
| Left = 241 (69.9%) |
| Right = 104 (30.1%) |
| Tumour type |
| Conventional = 326 (94.5%) |
| Mucinous or SRC = 19 (5.5%) |
| Differentiation |
| Well = 14 (4.1%) |
| Moderate = 285 (82.6%) |
| Poor = 46 (13.3%) |
| Dukes' stage |
| A = 27 (7.8%) |
| B = 134 (38.8%) |
| C = 126 (36.5%) |
| D = 58 (16.8%) |
| Adjuvant post-operative radiotherapy or chemotherapy |
| Yes = 147 (42.6%) |
| No = 159 (46.1%) |
Total number of patients with follow-up data = 330.
Median follow-up period for patient alive = 44.85 months [232 patients alive or censored, 98 patients (29.7%) died of disease].
274 (79.4%) patients have undergone curative resection, 71 (20.6%) patients have undergone palliative resection.
Clinico-pathological data of 100 colorectal adenomas derived from 73 patients
| Sex |
|---|
| M = 45 (62%) |
| F = 28 (38%) |
| Age |
| Mean = 66.18 ± 12.44 (range 23–87) |
| Tumour side |
| Left = 70 (70%) |
| Right = 30 (30%) |
| Polyp type |
| Tubular = 55 (55%) |
| Villous = 8 (9%) |
| Tubulo-villous = 37 (37%) |
| Dysplasia |
| Mild = 22 (22%) |
| Moderate = 55 (55%) |
| Severe = 18 (18%) |
| TIS = 5 (5%) |
| Tumour size (range 0.5–3.5 cm) |
| <1 cm = 44 (44%) |
| 1 cm or above = 56 (56%) |
Immunohistochemistry
Immunohistochemical staining was performed on 4 μm paraffin sections from the TMAs or whole tissue blocks. Heat-mediated antigen retrieval by microwave pretreatment (95°C for 20 min in 1 mM EDTA, pH 8.0 for EphB2; 100°C for 10 min then 95°C for 30 min in citrate buffer, ph 6.0 for β-catenin) was performed after deparaffinization. The specimens were incubated overnight with the primary antibodies (Goat anti-EphB2, dilution 1:100, R&D system; mouse anti-β-catenin, dilution 1:200, Transduction Laboratory) at 4°C. Amplification was achieved by polymer-peroxidase (DAKO EnVision+ System) at 37°C for 30 min. The reaction products of peroxidase were visualized by 3,3′-diaminobenzidine. Counterstaining was performed with haematoxylin. Immunohistochemical staining for low molecular weight cytokeratin (mouse anti-Cam5.2, 1:20, Becton Dickinson) was performed to ensure the integrity of protein in the tissue cores.
IHC assessment
EphB2 positive cells stained primarily the cell membrane. β-Catenin positive cells showed a variable degree of membranous, cytoplasmic and nuclear staining. For EphB2 staining, the membrane staining intensity in each tissue core was graded as negative 0; weak 1; moderate 2; strong 3; and a mean score was derived from assessment of all tissue cores available. A cut-off of mean score <1 was considered EphB2 negative whereas those ≥1 was considered EphB2 positive for categorical data analysis. Nuclear β-catenin staining in each tissue core was graded according to the percentage of positive tumour nuclei as 0% = 0; <10% = 1; 10–30% = 2; 30–70% = 3; >70% = 4. A mean score was derived from all tissue cores available and a cut-off of mean score ≥1.6 was taken as positive for aberrant nuclear β-catenin expression. Immunohistochemical grading was performed by two independent observers and cases with discrepancy were reviewed to arrive at a consensus.
Statistical analysis
Association between categorical parameters was evaluated using χ 2 -test. Pairwise comparison between expression of EphB2 in primary CRC and their lymph node or liver metastases was performed using Wilcoxon signed-ranks test. Kaplan–Meier survival analysis was used to examine relationship between categorical groups and survival or recurrence for univariate analysis. The multivariate Cox's proportion hazard model was applied to factors that were significant in univariate analysis in a stepwise forward method to detect independent prognostic factors. All computation was carried out using the SPSS software (SPSS, Chicago, IL).
Bisulphite genomic sequencing for promoter methylation of EphB2 in CRCs and demethylation treatment of CRC cell lines using 5-aza-2′-deoxycytidine (5-Aza-dC) and trichostatin A
The promoter region of EphB2 contains a dense 5′ CpG island. Promoter methylation analysis was performed in two CRC cell lines with low EphB2 level (SW480 and DLD1) and 35 CRCs with absent EphB2 expression by immunohistochemistry (IHC), amongst which 24 cases had aberrant nuclear β-catenin expression. DNA was extracted and subjected to bisulphite conversion based on previously published protocol. A pair of neutral primers flanking the region between nucleotide position −424 and −117 which contains 44 CpG sites, was designed that will amplify both the methylated or unmethylated alleles. The primer sequences were as follows: forward primer 5′-GTTGTTTTATTTGGAGGAGTTATAG-3′; and reverse primer 5′-ACCAACAAAATAAACCATCCAAC-3′. PCR amplification of the bisulphite converted DNA followed by direct DNA sequencing using the DyEnamic ET Terminator Cycle sequencing kit (Amersham, Little Chalfont, England) was performed and analysed using the ABI377 sequencer based on protocols previously described ( 16 ). The CpGenome™ Universal Methylated DNA was used as positive control (Chemicon International, USA).
SW480 and DLD1 cells were cultured in the presence of 5-Aza-dC and/or trichostatin A (TSA) using method previously described ( 16 ). In brief, 10 6 cells were seeded per 90 mm plate on day 0. On day 1, 5-Aza-dC was added at the final concentrations of 10 μg/ml using a 1μg/μl stock dissolved in water and incubated in 5% CO 2 for 24 h. On day 2, TSA (Sigma, St. Louis, USA) was added at a final concentration of 1 μM with a 1 mM stock dissolved in ethanol and incubated for an additional 24 h. On day 3, cells were harvested for RNA. Concurrently, cells were also treated with 5-Aza-dC alone, TSA alone, and as control, appropriate mock treatments. Expression of EphB2 was assessed using a Sybergreen based real-time RT-PCR protocol. Total RNA was treated with DNAse I digestion to remove any genomic DNA contamination. Reserve transcription was performed using Taqman RT Kit (Applied Biosystems). Human GAPDH was used as the normalization control in subsequent quantitative analysis. Quantification was performed using the ABI 7900HT and standard cycle condition. The relative expression of EphB2 in each sample was calculated as 2 −ΔCt , where Δ Ct = ( CtEphB2 − CtGAPDH ). The primers used in the study are: GAPDHF: GAA GGT GAA GGT CGG AGT C; GAPDHR: GAA GAT GGT GAT GGG ATT TC; EphB2F: ACC TGG CAG ACA TGA ACT ATG TTC; and EphB2R: CTT GCA GAC CAG GTT GCT GTT.
Cell lines, constructs and chemicals
SW480 and DLD1 cells were purchased from ATCC and grew in RPMI plus 10% FCS. Mouse EphB2/pcDNA3 was kindly provided by Dr T.Pawson from Samuel Lunenfild Research Institute at Toronto, Canada. The Fc fragment of human IgG, goat anti-human Fc and Texas red donkey anti-goat antibody was purchased from Jackson ImmunoResearch (Baltimore, MD). Recombinant mouse Ephrin-B1/Fc was purchased from R&D Systems (Minneapolis, MN). Texas red labelled phalloidin and the AlexaFlour568 labelled goat anti-mouse antibody was obtained from Invitrogen. The ROCK-inhibitor Y27632 was obtained from Calbiochem. BrdU was purchased from Sigma (St. Louis, MO) and the anti-BrdU antibody was purchased from Lab Vision (Fremont, CA).
Establishment of EphB2 stable cell line and confirmation of expression of functional EphB2 receptor in transfected cell line
SW480 cells were transfected with EphB2/pcDNA3 or pcDNA3 as a control using Lipofectamin 2000 (Invitrogen). After 2 weeks of Geneticin (500 ng/ml) selection, all Geneticin resistant clones were pooled. To further select cells expressing EphB2 at cell surface, cells were immunolabelled using goat anti-mouse EphB2 antibody followed by FITC-anti-goat secondary antibody. FITC positive cells were sorted and subsequently cultured. Immunoflorescence staining was performed to confirm EphB2 expression in the transfected cells. In brief, cells were cultured on eight-chamber slides, fixed with 4% paraformaldehyde for 20 min and then permeablized with 0.3% Triton X-100. Non-specific binding was blocked by incubating with 5% donkey serum at room temperature for 30 min. Goat anti-mouse EphB2 was added to the chamber at a concentration of 0.5 μg/ml at 37°C for 1 h. Texas red labelled donkey anti-goat IgG was then added and incubated for 45 min. After being washed with PBS, the slides were mounted with Vectashield mounting medium with DAPI (Vector Laboratories, Burlingame, CA).
To demonstrate the expression of a functional EphB2 receptor, SW480-EphB2 or SW480-pcDNA3 cells were cultured on 8-chamber slides and stimulated with Ephrin-B1-FC or clustered FC for 30 mins. Cells were then fixed with 4% paraformaldehyde, permeabilized with 0.3% Triton X-100 and stained for actin using Texas red labelled phalloidin.
Colony formation assay
For transient transfection and colony formation assay, SW480 cells were transfected with EphB2/pcDNA3 or control pcDNA3 constructs using lipofactemine 2000 (Invitrogen, Carlsbad, CA). Two days after transfection, cells were split 1:10 into six-well plates in triplicate and selected in medium containing 500 ng/ml of Geneticin. After 2 weeks of selection, individual Geneticin resistant colonies were fixed and stained using the Hema 3 staining Kit (Fisher) and colonies were counted. For stable cell colony formation assay, SW480/EphB2 or SW480/pcDNA3 cells were seeded in triplicate in 60 mm plates in a density of 1000 cells per plate and cultured in medium containing G418 for 3 weeks. Colonies were fixed, stained and then counted. All experiments were repeated at least twice.
BrdU labelling was performed to assay the proliferative activity of SW480/EphB2 or SW480/pcDNA3 cells. In brief, cells were cultured on cover slides and 1 μM of BrdU was added to the cells for 30 min. Slides were then fixed, denatured with HCl, neutralized with borate buffer and stained with anti-BrdU antibody, followed by AlexaFlour568 labelled secondary antibody. The nuclei of the cells were stained by Hoeschst and the slides were mounted.
Cell adhesion assay
96-well plates were coated with laminin or fibronectin (FN) at a series of concentrations starting at 20 μg/ml at 4°C overnight. Non-specific binding sites were blocked with 0.5% BSA/phosphate-buffered saline at 37°C for 1 h. Ephrin-B1-FC or FC was clustered with goat anti-human FC at 1:5 ratio on ice for 30 min before being added to adhesion medium. 1 × 10 5 cells were plated in each well in adhesion medium containing ephrinB1-FC or FC and allowed to adhere at 37°C for 30 min. Adherent cells were fixed with 4% paraformaldehyde and stained with 0.5% crystal violet. A550 was measured from the extracted dye using an enzyme-linked immunosorbent assay reader. All experiments were done in triplicate wells and repeated at least twice.
Cell migration assay
Modified Boyden chamber assays were performed to test for cell migration. The underside of filter inserts was coated with 20 μg/ml of FN overnight at 4°C and allowed to air dry before the cells were added. 1 × 10 5 cells in serum-free medium were plated in the top of insert. 1 μg/ml EphrinB1-FC or FC pre-clustered with goat anti-human FC was added to the lower chamber containing 10 μg/ml Collagen in 10% FBS medium. Cells were allowed to migrate through the filter at 37°C overnight. Cells on the topside of the filter were removed by scrubbing with cotton tipped swab moistened with medium. The cells on the lower surface of the membrane were stained with Hema 3 staining Kit and then counted. To test for the involvement of the Rho/ROCK pathway in cell migration, the above experiment was repeated by preincubating cells with 10 μm Y27632 on ice for 30 min before plating in the top chamber of the transwell. All experiments were done in triplicate wells and repeated at least twice.
Results
Reduced expression of EphB2 during colon cancer progression
Table III summarizes the results of TMA analysis of EphB2 expression in various stages of colon cancer progression and their clinico-pathological correlation. Representative examples of the IHC staining results are illustrated in Figures 1 – 3 .In normal colon mucosa, EphB2 was consistently expressed strongly in the membrane of epithelial cells located in the basal crypt region ( Figure 1 ). In tumours, we found that EphB2 was expressed (mean score ≥1) in 78% of adenomas, 55.4% of primary CRCs, 37.8% of lymph node metastases and 32.9% of liver metastases. The expression of EphB2 was significantly lower in CRCs compared with adenomas and in lymph node and liver metastases compared with primary CRCs ( P < 0.001 in all cases). Moreover, the expression of EphB2 was significantly lower in primary CRCs of Dukes' stage C and D (48%) compared with Dukes' stage A and B (63%) ( P = 0.005). Amongst the advanced stage CRCs, 98 paired CRCs and their corresponding lymph node metastases were studied for EphB2 expression and we found a significantly lower EphB2 expression score in the lymph node metastases compared with their primary cancers (Wilcoxon signed ranks test, P = 0.005; Figure 3A and B ). In another 35 patients in which paired CRCs and their corresponding liver metastases were available for analysis, the liver metastases again expressed a lower level of EphB2 compared with their primary cancers (Wilcoxon signed ranks test, P = 0.002; Figure 3C and D ). Among various clinico-pathological variables, loss of EphB2 expression in primary CRCs was significantly associated with poor tumour differentiation and mucinous or signet ring cell (SRC) morphology ( Table III ). Only 30.4% of poorly differentiated CRCs expressed EphB2 compared with 59.2% in well to moderately differentiated tumours ( P < 0.001). Similarly, only 15.8% mucinous/SRC CRCs expressed EphB2 compared with 57.7% in conventional CRCs. A similar significant difference in mean expression levels between these clinico-pathological variables was observed when the EphB2 expression score (the average score of 3 cores) was used as a continuous variable for analysis (data not shown). Examination of the various clinico-pathological variables amongst the 100 adenomas included in the TMA did not reveal any significant association of EphB2 expression with patient sex, age, polyp size, tumour location, tubular or villous morphology, or degree of dysplasia (See supplementary Table I for detail).
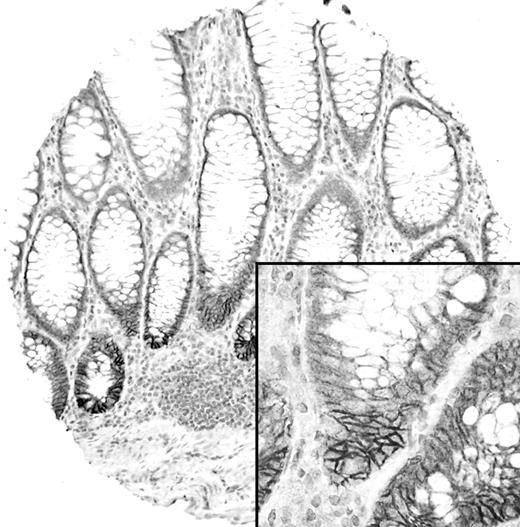
Expression of EphB2 in normal colon mucosa. Membranous EphB2 expression is limited to the basal crypt epithelial cells.
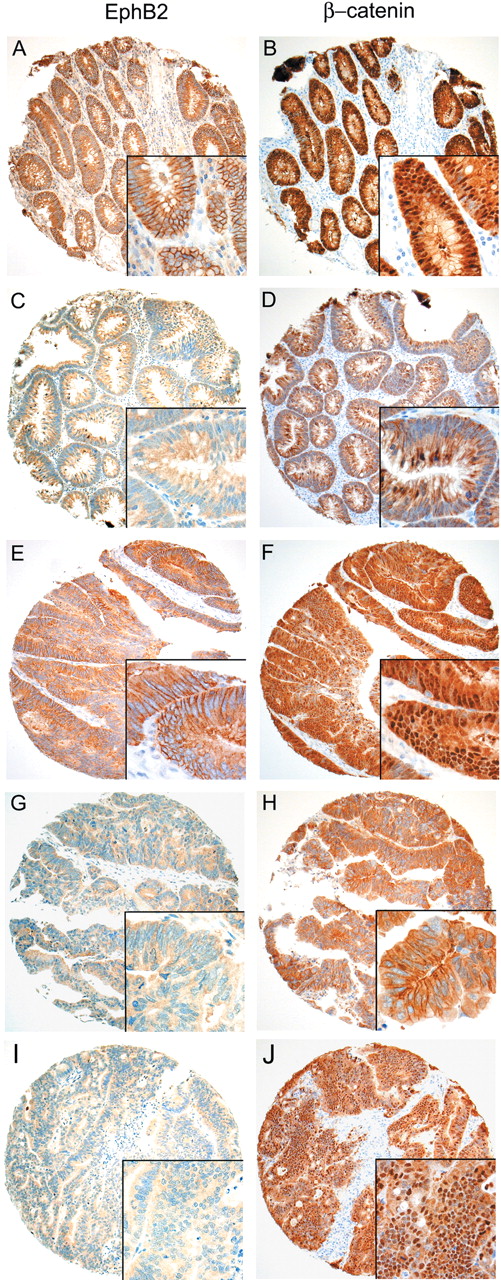
Expression of EphB2 and β-catenin in representative colorectal adenomas and carcinomas on a TMA. Insets depict the corresponding high power view. ( A – D ) Representative colorectal adenomas with (A) and without (C) membranous EphB2 expression. ( E – J ) Representative colorectal carcinomas with ( E ) and without ( G and I ) membranous EphB2 expression. Staining for β-catenin (right column) shows aberrant nuclear expression in the EphB2 positive tumours ( B and F ). Whilst some EphB2 negative cases demonstrate predominantly membranous β-catenin expression ( D and H ), there is clear-cut aberrant nuclear β-catenin in other cases ( J ).
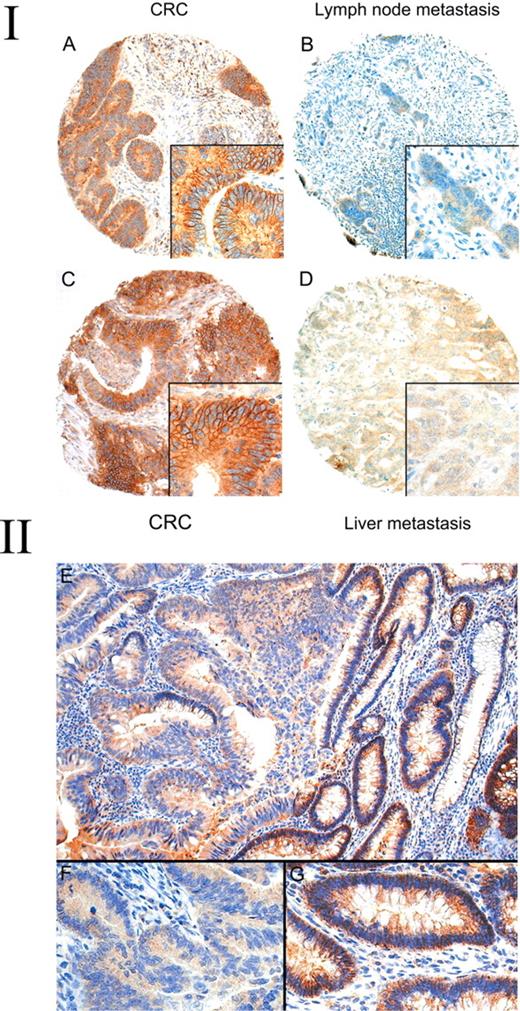
(I) Expression of EphB2 in colorectal carcinomas and their corresponding lymph node or liver metastases. Strong membrane expression of EphB2 is noted in a colorectal carcinoma ( A ) but absent in its lymph node metastases ( B ). Strong expression of EphB2 in another colorectal carcinoma ( C ) but absent in its liver metastases ( D ). (II) Expression of EphB2 in adenoma with malignant change arising from the colon. ( E ) The adenoma part (right field) shows strong membranous EphB2 expression but the invasive part (left field) shows no expression. The insets in the lower field depict high power view of the corresponding invasive ( F ) and adenoma ( G ) parts.
To further address the topographic distribution of EphB2 expression, we examined 14 cases of whole sections of adenoma with malignant change. Two distinct patterns were observed. In six cases both the adenoma parts and the invasive parts expressed EphB2 strongly. However, in eight cases (57.1%) we observed progressive loss of EphB2 expression in the invasive component ( Figure 3 ). In summary, our study indicated that there is progressive loss of EphB2 during colon cancer progression.
Loss of EphB2 expression is associated with poor prognosis in colon cancer patients
We next examined whether the loss of EphB2 expression is associated with clinical outcome. Figure 4 illustrated the Kaplan–Meier survival analysis amongst CRCs with or without EphB2 expression. CRCs with loss of EphB2 expression showed an adverse overall survival (log-rank test, P = 0.025) as well as disease-free survival ( P = 0.011) compared with those retaining EphB2 expression.
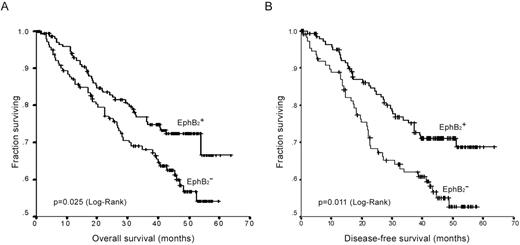
Kaplan–Meier plots of EphB2 expression in association with overall survival ( A ) and disease-free survival ( B ) in CRCs.
In univariate analysis of overall survival, tumour stage, differentiation, presence of peri-tumoural lymphovascular invasion and EphB2 expression scores were significant risk factors ( Table IV ). In multivariate analysis, only tumour stage ( P < 0.001) and differentiation ( P = 0.03) were found to be independent factors predicting overall survival. This is not surprising given the strong association of EphB2 expression with tumour stage and the strong effect of the later on survival.
Analysis of membranous EphB2 expression in colorectal adenomas, carcinomas and metastases and their relationship with clinico-pathological data
| Total no. | EphB2 expression (mean score ≥1) | P -value * | ||||
|---|---|---|---|---|---|---|
| Colorectal adenomas | 100 | 78 (78.0%) | <0.001 | |||
| Primary colorectal carcinomas | 345 | 191 (55.4%) | ||||
| Lymph node metastases | 98 | 37 (37.8%) | <0.001 | |||
| Liver metastases | 82 | 27 (32.9%) | <0.001 (compared with primary CRC) | |||
| Dukes' stage | ||||||
| Stage A | 27 | 17 (63.0%) | ||||
| Stage B | 134 | 85 (63.4%) | 0.005 (Stage A/B versus C/D) | |||
| Stage C | 126 | 61 (48.4%) | ||||
| Stage D | 58 | 28 (48.3%) | ||||
| Tumour differentiation | ||||||
| Well/moderate | 299 | 177 (59.2%) | ||||
| Poor | 46 | 14 (30.4%) | <0.001 | |||
| Tumour type | ||||||
| Conventional glandular | 326 | 188 (57.7%) | ||||
| Mucinous/SRCs | 19 | 3 (15.8%) | <0.001 | |||
| Nuclear β-catenin in CRCs | ||||||
| Aberrant expression (mean score ≥1.6) | 263 | 156 (59.3%) | ||||
| No aberrant expression | 77 | 34 (44.2%) | 0.018 | |||
| Nuclear β-catenin in adenomas | ||||||
| Aberrant expression (mean score ≥1.6) | 49 | 43 (87.8%) | ||||
| No aberrant expression | 51 | 35 (68.6%) | 0.021 | |||
Other variables analysed in CRCs (sex, age, tumour side, lymphovascular invasion) and adenomas (sex, age, tumour side, tumour size, tubular/villous morphology, degree of dysplasia) show no significant association.
χ 2 -test.
Univariate and multivariate analysis of variables related to overall survival in colorectal cancer patients
| Univariate analysis | Multivariate analysis | |||||||||||||||
|---|---|---|---|---|---|---|---|---|---|---|---|---|---|---|---|---|
| n | HR | 95% CI | P | n | Adjusted HR | 95% CI | P | |||||||||
| Overall survival | ||||||||||||||||
| Dukes' stage | <0.001 | <0.001 | ||||||||||||||
| Stage A&B * | 152 | 0.049 | 0.027–0.088 | <0.001 | 0.054 | 0.030–0.098 | <0.001 | |||||||||
| Stage C | 122 | 0.173 | 0.110–0.271 | <0.001 | 0.185 | 0.117–0.290 | <0.001 | |||||||||
| Stage D | 56 | |||||||||||||||
| EphB2 | 330 | 0.714 | 0.565–0.902 | 0.005 | ||||||||||||
| Differentiation | ||||||||||||||||
| Well/moderate | 285 | 0.387 | 0.246–0.610 | <0.001 | 0.601 | 0.378–0.956 | 0.032 | |||||||||
| Poor | 45 | |||||||||||||||
| Lymphovascular invasion | ||||||||||||||||
| Absent | 246 | 0.613 | 0.402–0.936 | 0.023 | ||||||||||||
| Present | 84 | |||||||||||||||
Variables analysed include sex, age, tumour stage, tumour differentiation, tumour type, tumour site (right or left side), lymphovascular invasion and EphB2 expression mean score (as continuous variable). Only variables with significant association with survival are listed.
Dukes' stage A&B are grouped together for analysis since there is no death recorded in Dukes' stage A.
In univariate analysis of disease-free survival, tumour stage, EphB2 expression score, tumour differentiation and peri-tumoral lymphovascular invasion were all significant risk factors for recurrence ( Table V ). Multivariate Cox analysis revealed that only tumour stage ( P = 0.002) and EphB2 expression score ( P = 0.007) were independent factors predicting disease-free survival.
Univariate and multivariate analysis of variables related to disease-free survival in CRC patients
| Univariate analysis | Multivariate analysis | |||||||||||||||
|---|---|---|---|---|---|---|---|---|---|---|---|---|---|---|---|---|
| n | HR | 95% CI | P | n | Adjusted HR | 95% CI | P | |||||||||
| DFS survival | ||||||||||||||||
| Dukes' stage | <0.001 | 0.002 | ||||||||||||||
| Stage A | 24 | 0.214 | 0.067–0.686 | 0.01 | 0.243 | 0.076–0.781 | 0.018 | |||||||||
| Stage B | 121 | 0.463 | 0.294–0.729 | 0.001 | 0.506 | 0.319–0.800 | 0.004 | |||||||||
| Stage C | 117 | |||||||||||||||
| EphB2 | 262 | 0.649 | 0.502–0.841 | 0.001 | 0.701 | 0.542–0.907 | 0.007 | |||||||||
| Differentiation | ||||||||||||||||
| Well/moderate | 232 | 0.514 | 0.294–0.899 | 0.020 | ||||||||||||
| Poor | 30 | |||||||||||||||
| Lymphovascular invasion | ||||||||||||||||
| Absent | 199 | 0.541 | 0.344–0.853 | 0.008 | ||||||||||||
| Present | 63 | |||||||||||||||
Variables analysed include sex, age, tumour stage, tumour differentiation, tumour type, tumour site (right or left side), lymphovascular invasion and EphB2 expression mean score (as continuous variable). Only variables with significant association with survival are listed.
Regulation of EphB2 expression in colon cancer samples
Since EphB2 is known to be induced by Wnt signalling, we examined the relationship between EphB2 expression and aberrant nuclear β-catenin expression. Indeed, we noted a moderate yet statistical significant association between EphB2 expression and aberrant nuclear β-catenin expression in both CRCs ( Table III , P = 0.018; Figure 2E–H ) and adenomas ( Table III , P = 0.021; Figure 2A–D ), suggesting that EphB2 expression in colon cancers are at least partially regulated by wnt signalling. However, we also observed many cases with aberrant nuclear β-catenin expression but without EphB2 expression ( Figure 2I–J ), indicating that other mechanisms may be involved in regulating EphB2 expression. One such possibility may involve the methylation of the EphB2 promoter. To test this hypothesis, we analysed the methylation status of EphB2 promoter. Bisulphite genomic sequencing of 35 CRCs (24 had aberrant nuclear β-catenin expression) and 2 CRC cell lines that were negative for EphB2 showed a complete absence of methylation in 44 CpG sites located in the EphB2 promoter (from nt −424 to −117), whilst methylated C-peaks were detected in the universal methylated DNA control (Supplementary Figure 1 ). Treatment of SW480 and DLD1 cells with 5-Aza-dC and/or TSA did not result in significant increase in EphB2 expression levels assayed using quantitative RT-PCR (Supplementary Table II ). Together these observations suggest that promoter methylation is not the main cause of EphB2 down-regulation in colon cancer cells.
Over-expression of EphB2 suppresses colony formation of colon cancer cells
The observed progressive down-regulation of EphB2 in CRC cells during invasion and metastases prompted us to examine the functional role of EphB2 expression in vitro . First, we assayed the expression of EphB2 expression in 19 colon cancer cell lines using real-time RT-PCR (data not shown). As observed in colon cancer tissues, colon cancer cell lines showed over 100-fold of variable expression levels of EphB2. Ls174T cells, known to responding to ephrin-B stimulation in vitro ( 3 ), showed high expression of EphB2; whereas other cell lines, including DLD1 and SW480, showed EphB2 at very low levels.
We chose SW480 cells for further study and established pooled clones of SW480 cells stably expressing EphB2 or control pcDNA3. To further enrich the cells which have high expression of EphB2, SW480/EphB2 cells were labelled with anti-EphB2 antibody and EphB2 positive cells were sorted using FACS and then cultured. Immunoflorescence staining confirmed the high expression of EphB2 in >90% of the resulting SW480/EphB2 stable cells (Supplementary Figure 2A and B ).
During the process of establishing EphB2 stable cell lines, we noticed that there was more colony formation in control pcDNA3 transfected cells than EphB2 transfected cells. The suppression of colony formation during transiently EphB2 transfection was observed consistently in SW480 cells (Supplementary Figure 3A and B ). We next performed colony formation assay using the stably transfected SW480/EphB2 or SW480/pcDNA3 cells. Again, we noted significant suppression of colony formation in the SW480/EphB2 cells compared with the mock transfectants ( Figure 5 , P < 0.01).
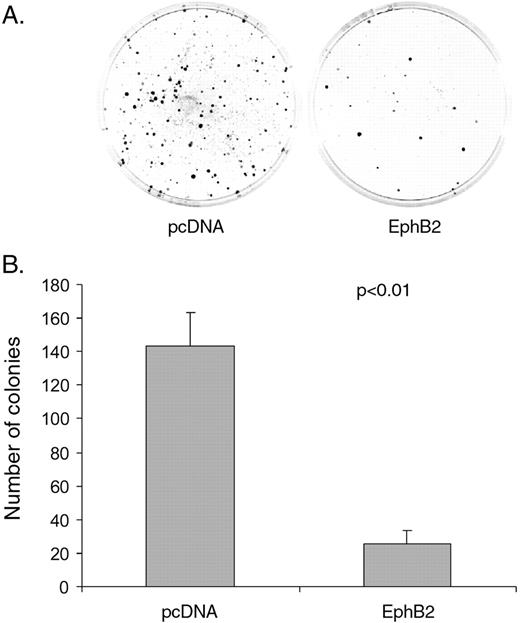
Over-expression of EphB2 inhibits colony formation in SW480 cells. ( A ) Representative images of colony formation in stably transfected SW480/EphB2 or EphB2/pcDNA3 cells. ( B ) Average number of colonies of SW480/EphB2 or EphB2/pcDNA3 cells. Values represent mean from triplicate wells, ±S.D.
To test whether the suppression of colony formation is related to inhibition of colon cell proliferation, we labelled SW480/EphB2 and SW480/pcDNA3 with BrdU and found that both cells showed similar percentage of BrdU positive cells (Supplementary Figure 3C and D ). Similar results were obtained when we stimulate the cells with ephrinB1-Fc (data not shown). In our routine culturing of SW480/EphB2 or SW480/pcDNA3 cells, we also noticed no difference in their growth rate.
Taken together, our data suggest that overexpression of EphB2 does not affect colon cancer cell proliferation. The inhibition of colony formation by EphB2 in colon cancer cells may be due to the inhibition of cell survival at low cell density.
Activation of EphB2 induces cell rounding, inhibits adhesion and migration in colon cancer cells
Activation of Eph receptors has been shown to induce cell rounding ( 3 ). Therefore, to test whether the transfected EphB2 receptor is functional, we treated SW480/EphB2 cells with ephrinB1-Fc. Indeed after 20–30 min of stimulation, a significant number of the SW480/EphB2 cells became round, whereas the control Fc treated cells or pcDNA3 transfectants remained in the spread-out phenotype (Supplementary Figure 2C and D and data not shown). In spread SW480/EphB2 cells, actin is mainly organized into bundled stress fibres that extend to membrane protrusions (Supplementary Figure 2E and G ). After Ephrin-B1 treatment, actin is recruited from stress fibres to the cortex (Supplementary Figure 2F and H ).
We next investigated the role of EphB2 in regulating cell adhesion. We found that SW480/EphB2 generally showed slightly decreased cell adhesion to matrix proteins compared with SW480/pcDNA3 cells. Furthermore, activation of EphB2 by ephrinB1-Fc can strongly inhibit SW480/EphB2 cell adhesion to both FN and laminin ( Figure 6A and B ). This effect is EphB2 specific, as no change was observed in the adhesion of SW480/pcDNA3 cells when treated with Ephrin-B1.
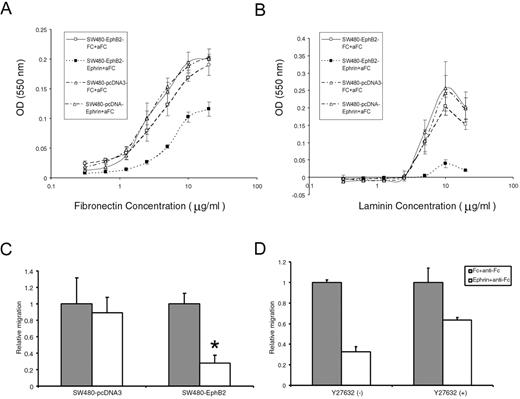
Activation of EphB2 receptors inhibits cell adhesion and migration in colon cancer cell line SW480. ( A and B ) Ephrin-B1 stimulation of EphB2 inhibits the adhesion of SW480/EphB2 cells to FN (A) and laminin (B) whereas the SW480/pcDNA.3 control cells show no change. ( C ) Ephrin-B1 stimulation of EphB2 inhibits SW480/EphB2 cell migration. Relative cell migration rate of SW480/pcDNA3 cells or SW480/EphB2 cells when treated with clustered Fc or ephrinB1-Fc. The cell migration in Fc treated cells is normalized to 1, asterisk indicates P < 0.01. ( D ) Treatment of Y27632, an inhibitor of Rho effector ROCK attenuates the negative effects of cell migration by ephrinB1-Fc on SW480/EphB2 cells. Values represent mean from triplicate wells, ±S.D.
We next examined the effect of EphB2 activation on cell migration. A modified Boyden chamber assay was performed to evaluate the cell migration toward immobilized fibronectin. We found that migration of SW480/EphB2 cells was significantly inhibited by ephrinB1-Fc. In contrast no change in migration was noticed in SW480/pcDNA3 cells ( Figure 6C ). It has been shown in some other cell types that ephrin induced cell migration inhibition is mediated by Rho GTPase ( 17 ). To test whether Rho/ROCK pathway is involved in Ephrin-B1 induced cell migration inhibition in colon cancer cells, we treated SW480/EphB2 cells with Y27632, an inhibitor of Rho effector ROCK. We found that Y27632 attenuated the negative effects of ephrinB1-Fc on SW480/EphB2 cell migration from 67.5 to 36.5% ( Figure 6D ).
In conclusion, our in vitro analysis demonstrated that activation of EphB2 induces cell rounding, inhibits adhesion and migration in colon cancer cells.
Discussion
In a recent report, Batlle et al . ( 14 ) reported the loss of EphB2 expression during colon malignant transformation. Furthermore, reduction of EphB activity by dominant negative EphB2 promoted tumour formation in the colon and rectum of ApcMin/+ mice, suggesting the EphB receptor activity suppresses CRC progression. Our study corroborate this study and using a much larger clinical sample set, provided strong evidence to support a putative tumour suppressor role for EphB2 in CRCs. We found progressive loss of EphB2 expression in each critical step of colon carcinogenesis, including the transition from adenoma to carcinoma (which signifies the occurrence of invasion), dedifferentiation and metastasis. Moreover, not only did patients with CRCs that expressed EphB2 had less advanced tumour stage and better overall survival, they were also less likely to develop a recurrence and had longer disease-free survival which were independent of tumour stage. Our findings were further supported by a recent report by Jubb et al. ( 18 ), which also demonstrated a positive association of EphB2 expression with prolonged overall and disease-free survival in a series of CRC patients using TMA. In addition, we have performed in vitro studies to show that activation of EphB2 receptor inhibits colon cancer cell adhesion and migration, as well as colony formation.
EphB2 is initially considered to be a putative oncogene based on its over-expression in various human cancers including CRCs ( 9 , 10 , 19 , 20 ). Indeed, we noted an ‘over-expression’ of EphB2 that closely parallels wnt activation (as evident by aberrant nuclear β-catenin accumulation) in colorectal adenomas and CRCs. Whilst EphB2 expression is restricted to the basal crypt cells in normal mucosa, in adenomas, expression of EphB2 can extend upward and reach the surface of the lesion ( Figure 2A ). In our previous expression profiling study of gastric cancer, we also noted over-expression of EphB2, axin2 and a group of other genes in gastric cancers with evidence of activated Wnt signalling ( 21 ). On the other hand, we observed an obvious loss of EphB2 expression in a distinct subgroup of CRCs that parallelled the onset of stromal invasion, lymph node or distant metastasis and poor tumour differentiation, and this loss occurred in tumours despite the presence of activated wnt signalling. Our in vitro functional assay showed that EphB2 does not affect the cell proliferation itself, but rather influences the cell survival, cell attachment and migration. The study is consistent with a recent report that showed reduced cell adhesion and migration of Ls174 colon cancer cells in response to stimulation by Ephrin-B1. However, since multiple EphB receptors are present in Ls174 cells, the study could not distinguish which EphB receptor is responsible for the stimulation by Ephrin-B1 ( 17 ). Moreover, we have shown that expression of EphB2 leads to suppression of colony formation in colon cancer cells, similar result has been observed in a prostate cancer cell line ( 13 ). Taken together, our data tend to suggest a role of EphB2 for regulation of cell survival, cell position and migration, which may function to suppress invasion and metastases in CRCs.
How EphB2 mediates these functions remains unclear. In fact, the Eph receptor families and their ligands have been well-known to signal complicated cellular processes which may result in distinct or sometimes even opposing effects on cell behaviour depending on context ( 22 ). Though a positive effect on tumourigensis by promoting cell motility, invasion, metastasis and angiogenesis has been proposed ( 2 ), the EphB2 receptor activation can also show anti-mitogenic effects through down-regulation of the Ras/mitogen-activated protein kinase signalling pathway or the abl tyrosine kinase phosphorylation in endothelial cells and neuronal cells ( 23 – 25 ). Whilst down-regulation of the Ras signalling pathway, if confirmed in colon cancer cells, may partly contribute to the suppression of colony formation by EphB2, our result tends to suggest a role of EphB2 signalling in controlling cell survival especially at low cell density, since colon cancer cell proliferation is not affected by EphB2. Thus, it would be important to study the possible interaction of EphB2 with pathways regulation apoptosis and cell survival, including the bcl-2 and the PTEN-Akt pathways. These further studies may reveal novel insight into the function of EphB2 in regulating colon cancer development. It has been noted that another member of the Eph family can function to mediate mesenchymal-epithelial transitions during somite morphogenesis in embryonic development. In this process, activation of EphA4 makes the mesodermal cells assume a columnar morphology and polarize to form epithelial cells ( 26 ). Interestingly, the reverse of this process, i.e. epithelial-mesenchymal transition, occurs during the dedifferentiation and progression of carcinoma and constitutes a key process that mediates invasion and metastasis ( 27 ). Given the increased invasion and metastatic potential and dedifferentiation associated with EphB2 loss, it is tempting to hypothesize that EphB2 may be involved in preventing epithelial-mesenchymal transition. Alternatively, Ephrin-B1/EphB2 signalling may be responsible for sorting cells towards the base of the crypt. In invasive carcinoma when the normal mucosal architecture is disrupted, Ephrin-B1/EphB2 signalling may still function to confine cells within the colon mucosa compartment and prevent invasion and metastasis to lymph nodes or distant organs.
The molecular events underlying the loss of EphB2 expression in CRCs despite presence of activated Wnt signalling remains unclear. EphB2 is localized at chromosome 1p35–p36.1, a frequent site of LOH in tumours, including CRCs. A previous study has examined a large series of CRC for genomic rearrangement and mutation and failed to detect any significant changes, though LOH involving the gene was found in 33% of cases ( 28 ). This suggests that other mechanism may be responsible for the EphB2 loss in CRC. Batlle et al. ( 14 ) have shown that the silencing of EphB receptors occurs in the transcriptional level in the majority of CRCs. The promoter region of EphB2 contains a dense CpG island which prompted us to examine whether there is aberrant methylation. However, we did not find evidence of methylation in the promoter using bisulphite genomic sequencing in a large number of EphB2 negative CRCs, including those with aberrant nuclear β-catenin expression. Though we cannot exclude the possible existence of methylation in other regions of the EphB2 promoter, treatment of SW480 and DLD1 cells with a global demethylating agent, 5-Aza-dC with or without TSA, failed to induce EphB2 expression, thus providing additional support that the down-regulation of EphB2 in CRCs occurs through other yet unknown mechanisms.
Reportedly over-expressed in many cancer types, the Eph family of receptor tyrosine kinases is attractive candidate for therapeutic target. Several recent studies have developed a monoclonal antibody, peptide or small molecules against EphB2 in an attempt to block its activation ( 19 , 29 , 30 ). Our findings raise caution towards this approach. If EphB2 indeed functions to suppress tumour metastasis, interrupting EphB2 signalling may further promote tumour invasion. On the other hand, further in-depth functional characterization of this gene is clearly necessary as genes that regulate cell positioning may constitute a new means for preventing cancer invasion and metastasis.
These authors contributed equally to this work.
We would like to thank Dr T.Pawson from Samuel Lunefeld Research Institute at Toronto, Canada for EphB2/pcDNA3 construct. This work is supported in part by grants from NCI (R03CA112638) to X.Chen and the Research Grants Council of the Hong Kong Special Administrative Region (HKU7440/03M) to S.Y.Leung and S.T.Yuen.
Conflict of Interest Statement : None declared.
References
Zisch,A.H. and Pasquale,E.B. (
Dodelet,V.C. and Pasquale,E.B. (
Batlle,E., Henderson,J.T., Beghtel,H. et al. (
van de Wetering,M., Sancho,E., Verweij,C. et al. (
Sansom,O.J., Reed,K.R., Hayes,A.J. et al. (
Kuhnert,F., Davis,C.R., Wang,H.T., Chu,P., Lee,M., Yuan,J., Nusse,R. and Kuo,C.J. (
Powell,S.M., Zilz,N., Beazer-Barclay,Y., Bryan,T.M., Hamilton,S.R., Thibodeau,S.N., Vogelstein,B. and Kinzler,K.W. (
Morin,P.J., Sparks,A.B., Korinek,V., Barker,N., Clevers,H., Vogelstein,B. and Kinzler,K.W. (
Kiyokawa,E., Takai,S., Tanaka,M., Iwase,T., Suzuki,M., Xiang,Y.Y., Naito,Y., Yamada,K., Sugimura,H. and Kino,I. (
Liu,W., Ahmad,S.A., Jung,Y.D., Reinmuth,N., Fan,F., Bucana,C.D. and Ellis,L.M. (
Wu,Q., Suo,Z., Risberg,B., Karlsson,M.G., Villman,K. and Nesland,J.M. (
Nakada,M., Niska,J.A., Miyamori,H., McDonough,W.S., Wu,J., Sato,H. and Berens,M.E. (
Huusko,P., Ponciano-Jackson,D., Wolf,M. et al. (
Batlle,E., Bacani,J., Begthel,H. et al. (
Jourdan,F., Sebbagh,N., Comperat,E., Mourra,N., Flahault,A., Olschwang,S., Duval,A., Hamelin,R. and Flejou,J.F. (
Chan,A.S., Tsui,W.Y., Chen,X., Chu,K.M., Chan,T.L., Chan,A.S., Li,R., So,S., Yuen,S.T. and Leung,S.Y. (
Miao,H., Strebhardt,K., Pasquale,E.B., Shen,T.L., Guan,J.L. and Wang,B. (
Jubb,A.M., Zhong,F., Bheddah,S., Grabsch,H.I., Frantz,G.D., Mueller,W., Kavi,V., Quirke,P., Polakis,P. and Koeppen,H. (
Mao,W., Luis,E., Ross,S. et al. (
Iwase,T., Tanaka,M., Suzuki,M., Naito,Y., Sugimura,H. and Kino,I. (
Chen,X., Leung,S.Y., Yuen,S.T. et al. (
Holmberg,J. and Frisen,J. (
Yu,H.H., Zisch,A.H., Dodelet,V.C. and Pasquale,E.B. (
Kim,I., Ryu,Y.S., Kwak,H.J., Ahn,S.Y., Oh,J.L., Yancopoulos,G.D., Gale,N.W. and Koh,G.Y. (
Elowe,S., Holland,S.J., Kulkarni,S. and Pawson,T. (
Barrios,A., Poole,R.J., Durbin,L., Brennan,C., Holder,N. and Wilson,S.W. (
Thiery,J.P. (
Oba,S.M., Wang,Y.J., Song,J.P., Li,Z.Y., Kobayashi,K., Tsugane,S., Hamada,G.S., Tanaka,M. and Sugimura,H. (
Toledo-Sherman,L., Deretey,E., Slon-Usakiewicz,J.J. et al. (
Author notes
1Department of Pathology, The University of Hong Kong, Queen Mary Hospital, Pokfulam, Hong Kong, 2Department of Biopharmaceutical Sciences, University of California, San Francisco, USA and 3Department of Surgery, Beijing Cancer Hospital, Peking University School of Oncology, Beijing, China
