


Abstract
The production of multicellular gametangia in green plants represents an early evolutionary development that is found today in all land plants and advanced clades of the Charophycean green algae. The processing of cell walls is an integral part of this morphogenesis yet very little is known about cell wall dynamics in early-divergent green plants such as the Charophycean green algae. This study represents a comprehensive analysis of antheridium development and spermatogenesis in the green alga, Chara corallina.
Microarrays of cell wall components and immunocytochemical methods were employed in order to analyse cell wall macromolecules during antheridium development.
Cellulose and pectic homogalacturonan epitopes were detected throughout all cell types of the developing antheridium including the unique cell wall protuberances of the shield cells and the cell walls of sperm cell initials. Arabinogalactan protein epitopes were distributed only in the epidermal shield cell layers and anti-xyloglucan antibody binding was only observed in the capitulum region that initially yields the sperm filaments. During the terminal stage of sperm development, no cell wall polymers recognized by the probes employed were found on the scale-covered sperm cells.
Antheridium development in C. corallina is a rapid event that includes the production of cell walls that contain polymers similar to those found in land plants. While pectic and cellulosic epitopes are ubiquitous in the antheridium, the distribution of arabinogalactan protein and xyloglucan epitopes is restricted to specific zones. Spermatogenesis also includes a major switch in the production of extracellular matrix macromolecules from cell walls to scales, the latter being a primitive extracellular matrix characteristic of green plants.
INTRODUCTION
The structure and development of plant tissues and organs is a manifestation of the coordinated activities of their inclusive populations of cells. The synchronization of the expression of selected gene sets, cell cycle activities and signal transduction pathways all contribute to the construction of the final functioning morphological unit. The inclusive sub-compartmentalized units of cells often display considerable structural and physiological diversity but ultimately contribute to the functional competency of the total unit. One fundamental example of this developmental process in multicellular green plants is the production of gametangia during the sexual reproductive phase of their life cycles. In primitive non-vascular plants (e.g. bryophytes) or in the gametophyte phase of primitive vascular plants (e.g. pteridophytes), specific ‘pre-gametangial’ cells undergo multiple cell divisions and their derivative units differentiate into specialized structures such as the antheridium or archegonium (Bell and Hemsley, 2000; Renzaglia et al., 2000). These units are further delineated into specific sub-compartments such as the jacket and a developing mass of sperm cells in the antheridium, or in the archegonium, the neck, venter and the egg. In gymnosperms and angiosperms, gametogenesis yields significantly reduced gametangial units such as pollen and archegonia or egg sacs embedded within a protective ovule. All of these gametogenesis-based developmental events and the resulting, functional morphological units optimize strategies for gamete production, protection, transfer and the ultimate fertilization event.
In plants, the production of the cell wall is central to morphological development. This entails the synthesis, secretion and post-secretory remodelling of multiple cell wall polymers that are guided by complex gene expression patterns and multiple signal transduction cascades responding to environmental cues (Lerouxel et al., 2006; Geisler et al., 2008). For most plant cells, this includes the establishment of a network of cellulose microfibrils tethered by non-cellulosic cross-linking polymers (commonly referred to as hemicelluloses) and embedded in a matrix of pectins, various proteoglycans and, in some specialized cells, phenolic (e.g lignins) or phenylpropanoid polymers (e.g. sporopollenin) (Carpita and McCann, 2000). The most widely studied examples of cell wall structure, biochemistry and development in plant gametogenesis are from angiosperms and gymnosperms, especially those relating to the unique anisotropic growth mechanism exhibited during post-pollination pollen tube development (Hepler et al., 2001; Cardenas et al., 2008; Lee and Yang, 2008). Here, coordinated modes of cell wall macromolecule production in the tube yield distinct polymer gradations and microloci (including oscillations) that result in pronounced unipolar growth toward the egg. The egg itself is the product of a complex differentiation process and it is embedded in its own unique gametophyte tissue that is surrounded by protective sporophyte tissue. However, there is a virtual absence of information concerning cell wall dynamics during gametogenesis in early-divergent plants including bryophytes and their algal ancestors, the Charophycean green algae or CGA (Streptophyta, Virideplantae; Lewis and McCourt, 2004). Advanced clades of the CGA such as the Charales and Coleochaetales display complex thallus morphology including the production of multicellular gametangia that, in some cases, exhibit notable similarity to those found in primitive land plants. This lack of information creates a significant gap in our basic understanding of the evolution of developmental processes in multicellular plants as gametangia represent one of the first, specialized multicellular units derived from a vegetative thallus in green plants. Likewise, the absence of data severely limits our understanding of the evolutionary origins of, and adaptations associated with, sexual reproductive strategies in green plants. Elucidation of cell wall dynamics during gametangium development in early-divergent plants would provide important insight into the structural and functional roles of specific cell wall polymers during the evolution of green plants and in their complex life cycles.
Detailed analysis of cell walls during gametangium development in the CGA and early-divergent land plants is technically challenging because of the short period of time during the year that male and female gametangia are available for study, and their small size makes it hard to obtain enough material for traditional biochemical studies. However, a large panel of molecular probes, monoclonal antibodies (mAbs) and carbohydrate-binding modules (CBMs) has been developed that enables cell wall components to be studied in muro (Willats et al., 2000; Willats and Knox, 2003). Moreover, a recently developed technique (comprehensive microarray polymer profiling or CoMPP) that combines the specificity of mAbs and CBMs with the high throughput capacity of microarrays enables the rapid analysis of cell wall polysaccharide composition in diverse samples (Moller et al., 2007; Sørensen et al., 2008). In this study, which forms part of a long-term study of the cell walls of the CGA, both immunocytochemical and CoMPP analyses were utilized to undertake a detailed survey of cell wall polymer distribution during antheridium development and spermatogenesis in Chara corallina.
MATERIALS AND METHODS
General
Chara corallina was collected from a freshwater wetland in Porter Corners, NY (USA) and was subsequently cultured in aquaria in the Greenhouse facility of Skidmore College. Thalli with antheridia were obtained during the month of May when water temperature reached 21 °C and the photoperiod was 14 h light/10 h dark. Antheridium-laden thalli were excised 10 cm from the apical tip and placed in sterile well water till further use.
Antheridium excision for CoMPP
Thalli were washed gently with deionized water and then placed on the stage of a Wild M36 stereo microscope (Wild, Heerbrugg, Switzerland). Individual antheridia were excised by hand and placed in ice-cold (4 °C) 80 % ethanol. After 90 min the antheridia were spun down at 500 g on an International Clinical Centrifuge (Needham, MA, USA) and the ethanol was removed. The antheridia were resuspended in 10 ml of 80 % ethanol at 4 °C for 90 min. This process was repeated twice more. The antheridia were then washed three times with acetone and air dried in a fume hood. The resultant material was collected and stored at −20 °C until further use.
CoMPP
CoMPP was carried out essentially as described in Sørensen et al. (2008). Starting material was 10 mg of alcohol-insoluble residue (AIR). Cell wall polymers were sequentially extracted with 50 mmtrans-1,2-diaminocyclohexane-N,N,N′,N′-tetraacetic acid (CDTA), pH 7·5 and 4 m NaOH with 0·1 % (v/v) NaBH4, and extractions printed in three dilutions and six replicates, giving a total of 18 spots per sample. The entire experiment was repeated three times and the data represent an average of these. The data were converted into a heatmap format using the online BAR heatmapper tool (http://bar.utoronto.ca/ntools/cgi-bin/ntools_heatmapper.cgi). Binding specificity of each mAb/CBM is provided in Table 1.
Summary of antibodies employed and results of immunocytochemical labeling
| mAb/CBM/dye | Specificity | Shield cells | Sperm cell initials | References |
|---|---|---|---|---|
| Cellulose | ||||
| Calcofluor | β-Glucans, cellulose | ++ | ++ | Hughes and McCully (1975) |
| CBM3a | Crystalline cellulose | ++ | ++ | Blake et al. (2006) |
| Pectins | ||||
| JIM5 | Low DE HG | ++ | ++ | Clausen et al. (2003) |
| JIM7 | High DE HG | + | + | Clausen et al. (2003) |
| LM7 | Partial DE, non-blockwise | − | − | Willats et al. (1998) |
| LM5 | (1–4)-Galactan | − | − | Jones et al. (2003) |
| LM6 | (1–5)-Arabinan | − | + | Freshour et al. (2003) |
| LM13 | Arabinan | − | + | Verhertbruggen et al. (2009) |
| LM8 | Xylogalacturonan | − | − | Willats et al. (2004) |
| Xyloglucan | ||||
| CCRC-1 | Fucosylated XyG | − | − | |
| LM15 | Non-fucosylated XyG | − | + capitulum | Marcus et al. (2008) |
| Mannan | ||||
| BS-400-4 | β(1–4)-Mannan/galacto-β(1–4)-mannan | − | − | Pettolino et al. (2001) |
| Xylan | ||||
| LM10 | (1–4)-Xylan | − | − | McCartney et al. (2005) |
| LM11 | β(1–4)-Xylan/arabinoxylan | − | − | McCartney et al. (2005) |
| β1–3 glucan | ||||
| BS-400–2 | β(1–3)-Glucan | + | − | Tormo et al. (1996) |
| AGP | ||||
| LM2 | AGP | − | − | Smallwood et al. (1996) |
| JIM13 | AGP | ++ | − | Knox (1991) |
| JIM8 | AGP | ++ | − | |
| Extensin | ||||
| LM1 | Extensin | − | − | McCabe et al. (1997) |
| JIM19 | Extensin | − | − | Smallwood et al. (1994) |
| JIM20 | Extensin | − | − | Smallwood et al. (1994) |
Key: ++, intense labelling; +, labeling; −, no label; DE, degree of methyl esterification.
Light microscopy (LM)
An Olympus SZX12 stereo microscope equipped with a DP70 camera (Olympus, Melville, NY, USA) was used for obtaining overview images of antheridial position on the thallus. For cytochemical work, thalli containing one nodal zone containing lateral branches with antheridia were excised with a scalpel and fixed for 1 h at 4 °C in 1 % paraformaldehyde (EMS, Fort Washington, PA, USA) in 0·05 m cacodylate buffer with 2 mm CaCl2 (pH 7·4). The antheridia were washed in 0·05 m cacodylate buffer with 2 mm CaCl2, three times for 10 min each. The antheridia were then slowly dehydrated over 6 h in a series of ethanol solutions and then placed in a 1 : 1 ratio of ethanol–London resin (LR; EMS) overnight. The antheridia were then infiltrated with 100 % LR for 2 d at 4 °C (three times) and then placed in cold LR in flat-bottomed Beem capsules. The antheridia were then UV polymerized. Sections of the antheridia (0·5 µm) were cut with a diamond knife on a Reichert Ultracut ultramicrotome (MOC, Valley Cottage, NY, USA). Sections were collected in wells of an immunoslide (EMS) coated with 1 % silane (Sigma Chemical, St Louis, MO, USA). Immunolabelling of the sections followed previously described protocols (Domozych et al., 2007) with tetramethylrhodamine isothiocyanate (TRITC)-conjugated anti-rat secondary antibodies. Antibodies were obtained from Plant Probes (Leeds, UK) or BioSupplies (Parkville, Australia). In order to determine if xylan, xyloglucan (XyG) or mannan epitopes were being masked by pectins in the cell wall, some sections were first incubated in a 100 µg mL−1 solution of pectolyase (Sigma Chemical; in a pH 4, CAPSO buffer, Herve et al., 2009) for 2 h at room temperature or in 50 mm CDTA (pH 6·9) for 2 h. at room temperature. The treated sections were washed five times in deionized H2O and then labelled with mAbs as described above. Control samples excluded primary mAb incubation. CBM3a labelling was performed essentially as described in Blake et al. (2006). For general labelling of β-glucans, sections were treated with 0·1 µg mL−1 Calcofluor (Sigma) for 2 min and then repeatedly washed with deionized H2O. LM and fluorescence light microscopy (FLM) imaging employed an Olympus BX-60 light microscope (Olympus, USA) equipped with fluorescence optics and a DP-70 camera.
Transmission electron microscopy (TEM) cytochemistry
Excised antheridia were fixed with 0·5 % glutaraldehyde at 4 °C for 1 h in cacodylate buffer (see above). After 30 min, the antheridia were washed with cacodylate and then lightly fixed for 1 h in 0·5 % OsO4/0·05 m cacodylate buffer. After washing with cacodylate buffer three times (10 min each), the antheridia were dehydrated in acetone, infiltrated in an acetone/Spurrs low viscosity medium (EMS) and then embedded in flat-bottomed Beem capsules using heat polymerization (60 °C, 9 h). Sections of 60–80 nm were cut on the ultramicrotome and collected on gold or nickel, formvar-coated grids. Immunogold labelling followed previously described protocols (Domozych, 2007) and used goat anti-rat antibody conjugated with 15 nm gold particles. For determination of potential pectin masking, sections on grids were treated with pectolyase or CDTA as described above before immunogold labelling. For control experiments, the primary antibody incubation was excluded. TEM imaging took place on a JEOL 1010 TEM at 80 kV (JEOL, Peabody, MA, USA).
RESULTS
Antheridia were present on thalli from May to August when water temperature exceeded 21 °C. The appearance of antheridia typically preceded oogonia by 1–2 d and full antheridial development was completed within 3–4 d. Antheridia arose from the axillary regions of lateral branches emerging from the first 2–3 nodes of apical portions of thalli. Antheridia were juxtaposed to oogonia on the lateral branches (Fig. 1A) and were easily recognizable by the bright orange pigmentation of the epidermal-like shield cells (Fig. 1B).
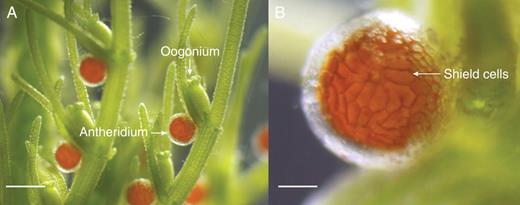
The gametangia of C. corallina. (A) An overview of antheridial positioning on a lateral branch. Each antheridium is closely situated near an oogonium. Scale bar = 400 µm. (B) A magnified view of an antheridium and highlighting the brightly coloured shield cells of the epidermis. Scale bar = 90 µm.
Mature antheridia were excised from lateral branches and used for CoMPP and microscopy-based studies. CoMPP provides semi-quantitative information about the relative abundance of epitopes occurring on cell wall components, and the data are presented as a heatmap (Fig. 2). In the heatmap, mean spot signals from the CoMPP arrays are correlated to colour intensity, and the highest value in the entire data pool was set to 100 and all other values adjusted accordingly. The heatmap shows the signals obtained for cell wall components extracted with CDTA and NaOH, two solvents that in land plants extract predominantly pectic and hemicellulosic polysaccharides, respectively. CoMPP indicated that antheridia contained the pectic homogalacturonan (HG) epitope with a low degree of methyl esterification that is recognized by mAb JIM5, but not the partially methyl-esterified HG epitopes recognized by mAbs LM7 and JIM7. β(1–4)-galactan and α(1–5)-arabinan often occur as side chains on land plant pectins and whilst β(1–4)-galactan was not detected in antheridia, α(1–5)-arabinan (recognized by mAb LM6) was. Interestingly, LM6 binding was strongest in the NaOH rather than the CDTA fraction, suggesting that in antheridia this epitope may be associated primarily with hemicellulosic rather than pectic polymers. The presence of cellulose and callose was indicated by the binding of CBM3a and mAb BS 400-2, respectively, and three hemicellulosic epitopes were also detected; a mannan epitope recognized by mAb BS 400-4, a xylan-containing epitope recognized by mAb LM11 and a XyG epitope recognized by mAb LM15. It is noteworthy that the fucosylated XyG epitope recognized by mAb CCRC-M1 was not detected and also that, in contrast to most studies on land plant cell walls, LM15 bound more strongly to CDTA- rather than to NaOH-extracted material. This suggests that XyG is less tightly held in the cell wall than is typical in land plants, and may be associated with the pectic matrix in antheridia. Three arabinogalactan protein (AGP) epitopes (recognized by mAbs LM2, JIM8 and JIM13) were detected in both CDTA and NaOH extractions, but three anti-extensin mAbs (LM1, JIM19 and JIM20) did not produce signals above background.
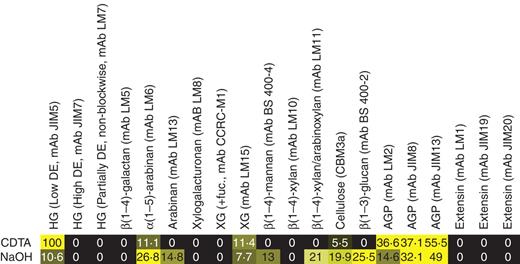
CoMPP profile of the antheridium. The printed microarrays were probed with a panel of monoclonal antibodies and a CBM listed above the heatmap. CDTA and NaOH refer to the signal values from the two different extractions. BS, Biosupplies.
For immunofluorescence studies, 500 nm sections of fixed and LR-embedded antheridia were obtained. Table 1 summarizes the immunocytochemistry-based results of this study. The cell walls of all regions of the antheridium were labelled with Calcofluor and CBM3a (Fig. 3A–C), which label β-glucans and crystalline cellulose, respectively. Both the end walls and cross-walls of developing sperm cell initials, organized in filaments, were labelled as well. The cell walls of all areas of the antheridium including the sperm cell initials were also labelled with the anti-HG mAb JIM5 (Fig. 3D, E). JIM7, an mAb which labels relatively highly esterified HG, also labelled the cell walls of all components of the antheridium including those of the sperm cell initials (Fig. 3F). The anti-α(1 → 5)-arabinan mAb LM6 labelled only the cell walls of the sperm cell initials (Fig. 3G), whilst the anti-AGP mAb JIM13 labelled just the cell walls of the outer epidermal layer of shield cells (Fig. 3H, I). This was also the case for the anti-AGP, JIM8, as its binding was restricted to just the outer cell wall of the epidermal cells (Fig. 3J). Binding of the anti-XyG mAb, LM15, was highly restricted and was confined to certain cell walls of the capitulum and its immediate derivatives (Fig. 4A). Control preparations that included elimination of primary antibody incubation did not reveal any labelling (Fig. 4B). Treatment of sections with pectolyase or CDTA prior to labelling did not result in enhanced labelling of LM15 (Fig. 4C, D) or labelling with LM11 or BS 400-4 (data not shown).
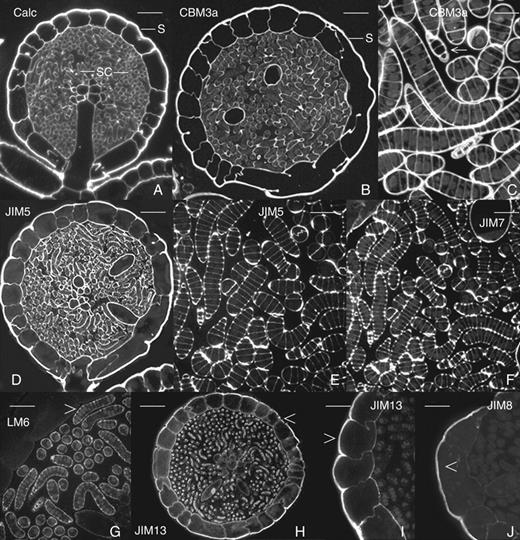
Immunofluorescence and Calcofluor images of the antheridium and developing sperm cell initials. (A) The cell walls of all cell types of the antheridium are labelled with Calcofluor including the shield cells (S), sperm cell initials (SCI), the capitulum (C) and pedicel (P). Scale bar = 35 µm. (B) A CBM3a-labelled antheridium. The cell walls of all component cells are labelled including the sperm cell initials (SCI) and shield cells (S). Scale bar = 45 µm. (C) A magnified view of the sperm cell initials labelled with CBM3a (arrow). Note that both the thick end walls and thin cross-walls are labelled. Scale bar = 9 µm. (D) An antheridium labelled with JIM5. Note that the cell walls of all cell types are labelled. Scale bar = 35 µm. (E) A magnified image of sperm cell initials labelled with JIM5. Note that both end and cross-walls label. Scale bar = 21 µm. (F) A view of the sperm cell initials labelled with JIM7. Scale bar = 20 µm. (G) A magnified view of the sperm cell initials (arrow) labelled with LM6. These are the only antheridial cells that label with this mAb. Scale bar = 20 µm. (H) An antheridium labelled with JIM13. The shield cells (arrow) are the only cells that are labelled with this mAb. Scale bar = 35 µm. (I) A magnified view of the shield cell epidermis labelled with JIM13. Only the shield cells are labelledf Scale bar = 20 µm. (J) A JIM8-labelled antheridium demonstrating that only the shield cells are labelled (arrow). Scale bar = 15 µm.
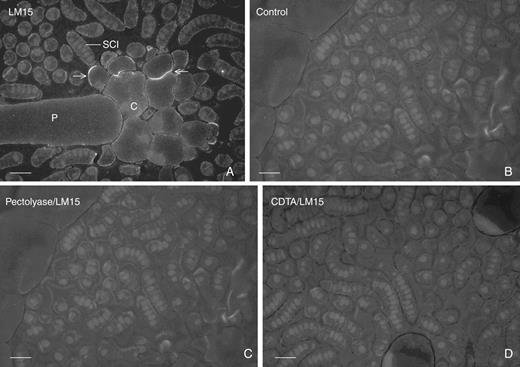
Immunofluorescence profiles. (A) An antheridium labelled with LM15. Only the cell walls of the immediate cell products of the capitulum (C; arrows) are labelled. The sperm cell initials (SCI) and pedicel (P) are also apparent. Scale bar = 15 µm. (B) A control preparation whereby the primary antibody was eliminated from the labelling process. Scale bar =15 µm. (C) A preparation whereby sections were treated with pectolyase before LM15 labelling. No new labelling is apparent. Scale bar = 15 µm. (D) A preparation whereby sections were treated with CDTA before LM15 labelling. No new labelling is apparent. Scale bar = 15 µm.
TEM-based ultrastructural and immunogold analyses of 60–80-nm sections demonstrated the microarchitectural characteristics and refined polymer mapping of the cell walls of the various regions of the antheridium. The most distinct region of the antheridium was the sperm filament that included as many as 25–40 sperm cell initials attached end to end (Fig. 5A). Each cell was surrounded by a cell wall, and the cross-walls between the sperm cell initials were perforated by plasmodesmata (Fig. 5B, C). The cross-walls of the sperm cell initials were formed by a cell plate during cytokinesis (Fig. 5B; also see Cook et al., 1998). The side walls of the sperm cell initials were thin and the junctions between the side and cross-walls were distinctively V-shaped (Fig. 5D). During latter stages of development, the sperm cell initial protoplast condensed and retracted from the cell wall (Fig. 5C). A noticeable, moderately osmiophilic substance filled the spaces between sperm filaments and was never found to label with any mAb, Calcofluor or CBM3a in either LM or TEM preparations. During the late stages of development when sperm cells started to retract from the cell walls, no antibody labelling was ever found upon sperm cell membranes where scales were located. The epidermis of the antheridium consists of thick-walled shield cells. The outermost region of the cell wall of the shield cells was thick and fibrous with a higher density of fibres situated on the outer loci (Fig. 6A). The side walls were considerably thinner (Figs 5B and 6B) and in many cases ended in distinct protuberances that only partially separated adjacent cells (Fig. 6C). This created large expanses of cytoplasmic continuity between shield cells. Chloroplasts lined the outer cytoplasmic strata and possessed distinct accumulations of pigment globules (Fig. 5A; see also Pickett-Heaps 1975). These globules most probably represented the carotenoid depositions that produced the distinct orange coloration of the antheridium.
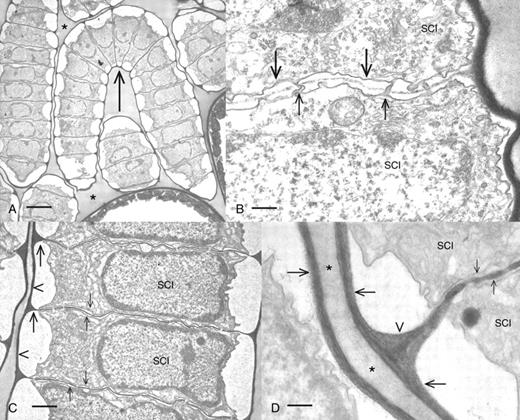
Ultrastructural features of spermatogenesis. (A) A longitudinal section through an antheridial filament (arrow). Each filament contains 20–30 sperm cell initials (SC) and each cell is surrounded by a cell wall. The sperm cell initials sit is a moderately electron-dense material (*) within the antheridium. Scale bar = 4 µm. (B) Cell plate formation in the antheridial filament. The plate (large arrows) develops in centripetal fashion between the daughter sperm cell initials (SCI) and entails the formation of plasmodesmata (small arrows). Scale bar = 375 nm. (C) A magnified view of sperm cell initials (SCI) during a later stage of development. Note that the protoplast is beginning to condense and retract from the end wall (arrowhead). The cross-walls (small arrows) remain intact. V-shaped junctions are present where the cross-walls meet with the end wall (large arrows). Scale bar = 1 µm. (D) A magnified view of the V-shaped cell wall junctions (arrowhead) of developing sperm cell initials (SCI). These are the zones where the end walls (large arrows) and cross-walls (small arrows) merge. Scale bar = 250 nm.
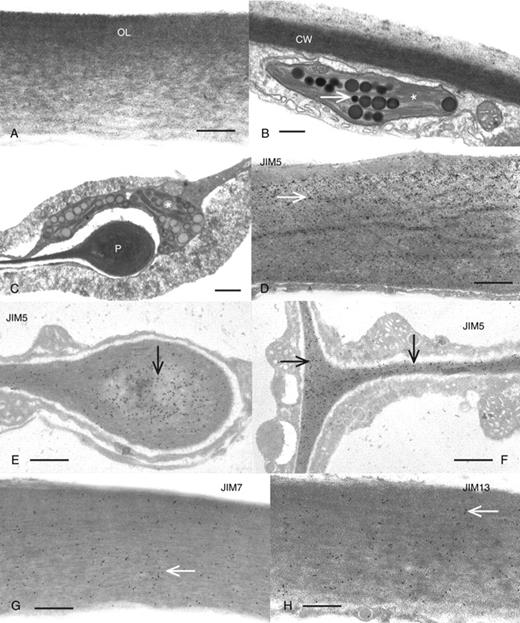
Ultrastructure and immunogold labelling of the shield cells of the antheridium. (A) An image of the thick cell wall (CW) on the outside of the shield cells. The cell wall is fibrillar with a gradient of thick fibrillar density on the outer layer (OL) and less density on the inside. Scale bar = 500 nm. (B) The cross-wall (CW) between shield cells. This cell wall is thinner than that of the outer cell wall and is adjacent to thin peripheral layers of cytoplasm carrying the globule-containing (arrow) plastids (*). Scale bar = 420 nm. (C) A cell wall protuberance (P) characteristic of many of the shield cells. The terminus of the protuberance ends in the middle of the cell. Note the plastid (*) in the peripheral cytoplasm adjacent to the terminus. Scale bar = 750 nm. (D) The outer wall region of a shield cell labelled with JIM5. Note the abundance of label (arrows) throughout the cell wall. Scale bar = 520 nm. (E) A JIM5-labelled protuberance showing the dense labelling in the protuberance swelling (arrow). Scale bar = 550 nm. (F) A JIM5-labelled region (arrows) of the cross-wall of a shield cell. Scale bar = 430 nm. (G) A view of the outer region of the shield cell labelled with JIM7. Note the label throughout the cell wall (arrow). Scale bar = 575 nm. (H) The outer wall of a shield cell labelled with JIM13. The label is also found throughout the cell wall (arrow). Scale bar = 560 nm.
JIM5 labelled all portions of the shield cell cell wall (Fig. 6D) including the thick protuberances and the cross-walls (Fig. 6E, F). JIM7 (Fig. 6G) and JIM13 (Fig. 6H) also labelled all of the various regions of the shield cell cell walls. The cell walls of sperm cell initials were also labelled with JIM5 (Fig. 7A), especially at the V-shaped junctions where cell walls of individual cells met (Fig. 7B). JIM7 also labelled the sperm cell initial cell walls, with higher labelling in the cross-wall region and lesser labelling in the V-shaped junction (Fig. 7C, D). JIM13 did not label any region of the cell wall of sperm cell initials (Fig. 7E). LM6 labelled only the sperm cell initial cell walls including the cross-wall region (Fig. 7F). However, unlike other antibody labelling, it appeared as if the label was localized on the plasma membrane of the cross-wall region. The electron-dense material found between the sperm cell filaments was not labelled with any of the antibodies. Control labelling included elimination of primary antibody incubation (Fig. 7G). During the final stage of spermatogenesis, the sperm cell protoplasts retract from the cell wall, condense, produce flagella (Fig. 8A) and become coated with small scales (Fig. 8B). At this time, no part of the plasma membrane or flagellar membrane surfaces or material found between the cell and old cell wall was labelled with any of the antibodies.
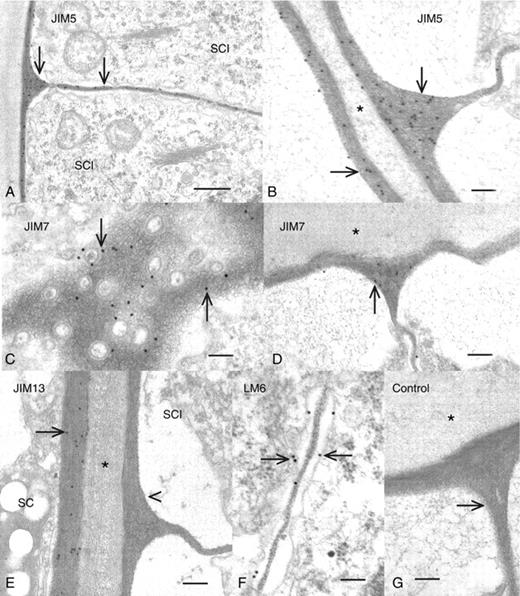
Immunogold labelling of sperm cell initials. (A) A sperm cell initial (SCI) labelled with JIM5. The end and cross-walls are all labelled with the mAb (arrows). Scale bar = 1 µm. (B) A magnified view of the V-shaped junction and end walls of sperm cell initials labelled with JIM5. Note that there is no labelling in the material outside of the walls (*) Scale bar = 400 nm. (C) A view through a cross-wall of a sperm cell initial labelled with JIM7. The label is found throughout the cell wall (arrows) that is interrupted by plasmodesmata. Scale bar = 150 nm. (D) A view of the V-shaped junction labelled with JIM7 (arrow). Note that there is no labelling in the material in the space outside of the wall (*). Scale bar = 200 nm. (E) The JIM13-labelled interface between the inner wall of a shield cell (large arrow) and the end wall of a sperm cell initial (SCI). Note that the shield cell wall is labelled with the mAb but not the cell wall of the sperm cell initial. Scale bar = 200 nm. (F) The cross-wall region of sperm cell initials labelled with LM6. Note the labelling at this zone, including the plasma membrane of this region (arrows). (G) A control preparation where the primary antibody was eliminated during labelling. No labelling is found in the cell walls (arrow) or the material outside of the cell walls (*). Scale bar = 400 nm.
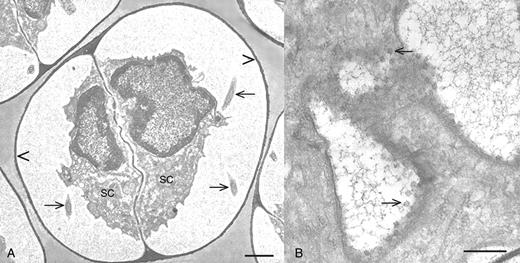
Ultrastructure of the last stages of spermatogenesis. (A) An overview of sperm cell initials transforming into sperm cells. Note that the protoplasts condense and retract from the cell walls and flagella emerge (arrows). Scale bar = 1 µm. (B) A JIM5-labelled sperm cell initial during sperm cell development. Not that the mAb labels the cell wall (large arrows) but not the scales upon the flagellar surface (small arrow) or material (*) between the sperm cell flagellum and cell wall. Scale bar = 205 nm.
DISCUSSION
This study represents the first detailed study of the cell wall components in C. corallina antheridia cell walls using an extensive panel of cell wall probes. The CoMPP technique enabled a large number of epitopes to be surveyed using a small amount of material and also provided information about the extractabilities and possible inter-relationships of cell wall components. The LM and TEM immunolocalization studies provided insights into the cellular locations of the epitopes. In general, there was a close agreement between the observations from the CoMPP and immunolabelling studies. However, for certain epitopes this was not the case. For example, JIM7 bound strongly to sections through antheridia cell wall, but did not produce a signal above background in CoMPP. One explanation for this could be that the JIM7 epitope was not extracted by the CDTA extraction used – possibly because the polysaccharide bearing the JIM7 epitope was very firmly held in the cell wall by association with other polymers. Conversely, the β(1–4) xylan/arabinoxylan and β(1–4) mannan epitopes recognized by LM11 and BS 400-2 were detected by CoMPP, but not in the immunolabelling studies, and one reason for this might be masking of these epitopes by other cell wall components. It has been shown in land plants that hemicellulosic epitopes can be masked in immunolabelling studies by pectin and can be unmasked by pectinolytic enzymes (Herve et al., 2009). However, treatment of LM and TEM antheridia sections with pectolyase and CDTA before labelling failed to demonstrate any new or enhanced labelling with these mAbs, and it is possible that these epitopes may be masked by cell wall epitopes other than pectins. The results obtained in this study generally corresponded well with previous biochemical studies of total thallus cell wall chemistry of Chara (Gillet et al., 1992, 1998; Gillet and Liners, 1995; Popper and Fry, 2003; Proseus and Boyer, 2006; Popper, 2008) in that pectins and cellulose were determined to be abundant cell wall polymers. However, previous screening for XyG in Chara has yielded inconclusive results (Popper and Fry, 2003; Van Sandt et al., 2005; Popper, 2008). The disaccharide, isoprimeverose, is produced by the digestion of XyG (but no other polymers) by the enzyme driselase, and this effect is generally assumed to be diagnostic for XyG. A study by Popper and Fry failed to detect isoprimeverose upon driselase digestion of C. corallina cell wall material. The material used for this study did not contain antheridia (S. Fry, University of Edinburgh, UK, pers. comm.). Labelling with LM15 indicated a highly restricted location of the LM15 epitope and it is possible that the material selected for driselase treatment simply did not include XyG-containing cell walls. It is also possible that XyG in C. corallina has a somewhat different structure from that of land plant XyGs and is not driselase digestible. The LM15 mAb was generated using a XXXG heptasaccharide (i.e. an oligosaccharide consisting of four contiguous 1,4-linked glucose resides, three of which bear 1,6-linked xylose residues; Herve et al., 2009); however, LM15 also binds to XXXG that is further substituted with galactose. The possibility cannot be excluded that C. corallina XyG is substituted such that it is detectable by LM15 but not digestible by driselase. Although LM15 has been shown not to cross-react with a wide range of other cell wall polymers, it is also formally possible that the LM15 labelling observed represents LM15 binding to a non-XyG cell wall component.
The formation of an antheridium in C. corallina represents a rapid developmental phenomenon originating with an adaxial cell positioned on the lateral branches near the thallus apex. These cells are located at a nodal region, i.e. a central location for the initiation of many morphogenetic events in the alga, and undergo multiple cell divisions to yield an octant of undifferentiated cells (Pickett-Heaps, 1975). From this octant, further cell divisions and subsequent differentiation events yield three layers of cells, the outer epidermis, the medial manubrium and the internal capitulum. Further divisions and differentiation yield the mature components of the functioning antheridium. These developmental events are regulated by environmental cues including long photoperiods and warm water temperatures, as well as chemical signals including the gibberellin, GA3 (Kazmierczak, 1999; Kazmierczak et al., 1999; Kazmierczak and Stepinski, 2005). The production of antheridia is also temporally orchestrated with the formation of oogonia and, ultimately, both gametangia are geographically positioned in closely set pairs. The proximity of the male and female gametangia most probably increases the rate of success of sperm transfer to the egg and subsequent fertilization. The mature antheridium is a highly distinctive structure and includes: (a) a pedicel or stalk that connects the antheridium to the vegetative branch; (b) an epidermis or jacket consisting of a layer of shield cells; (c) the manubrium that sits internal to the jacket and yields the capitulum; and (d) the capitulum (i.e. both primary and secondary capitula, sensuPickett-Heaps, 1969) whose cells ultimately give rise to sperm cells. The epidermal shield cells are brightly coloured due to the accumulation of carotenoid pigment globules in their chloroplasts, a characteristic also found in the antheridia of some bryophytes (Shaw and Goffinet, 2000). The shield cells often possess incomplete cross-walls that terminate in distinct swollen protuberances. These protuberances are labelled with Calcofluor, CBM3a, JIM5 and JIM7, but not with LM5 or LM6. These results indicate the presence of cellulose and HGs with varying degrees of esterification but not rhamnogalactouran I (RG-I)-like macromolecules. Pectin-containing cell wall protuberances like those found here are not commonly found in plant cells but have been described in some taxa of most of the major groups of land plants (Leroux et al., 2007). Many of these protuberances have been found in cells that are associated with specific physical stress stimuli including wounding and grafting (Davies and Lewis, 1981; Donaldson and Singh, 1984). Likewise, cell wall thickenings of strategically placed cells have been implicated in the forceful dissemination of gametes and spores of bryophytes (Shaw and Goffinet, 2000). The functional role of the protuberances in the Chara's shield cells has yet to be definitively described but it is possible that they contribute to the dehiscence mechanism exhibited by the mature antheridia. Immediately prior to sperm release, the antheridial epidermis ruptures and forcefully unravels in a rosette pattern (Pickett-Heaps, 1975) that, in turn, facilitates the spread of the sperm. The alternation of the thick protuberances with the more uniform outer and inner wall regions of the shield cells may contribute to the generation of a controlled, i.e., organized, centripetal action that displaces the sperm outward from the antheridium. Further work will be needed to elucidate both the functional role of the protuberances and the specific role of its pectin constituents in Chara. This includes analysis of rapid remodelling of HG chemistry that might allow for dramatic changes in cell wall charge and shield cell osmotic conditions that ultimately lead to rupture.
One of the more unique and spectacular events during antheridial development in Chara is the production of sperm cells. These gametes are derived from cells that arise in distinct, elongate filaments known as antheridial or spermatogenous filaments. In the early stages of spermatogenesis, the sperm cell initials are covered with thin cell walls and are produced by a cytokinetic mechanism that includes a phragmoplast and tubulo-vesicular cell plate. Fields of plasmodesmata in the cross-walls between sperm cell initials are created during the cytokinetic process (Pickett-Heaps, 1975; Cook et al., 1998, 1997). The cell walls contain both cellulose and HGs with varying degrees of esterification. The cell walls of sperm cell initials also labelled with LM6, which is specific for α(1–5)-arabinan side chains of RG-I and sometimes considered a marker of AGP glycans (Lee et al., 2006). Interestingly, immunogold labelling with LM6 was found both on the plasma membrane and cell walls of the sperm cell initials. JIM13 and JIM8, which label a glycan component of AGPs, did not label the cell walls of sperm initial cells but did label the shield cell cell walls. These results suggest that AGPs are components of the antheridum's epidermis but are not involved in spermatogenesis. The LM6 labelling may simply be recognizing RG-I epitopes involved in early sperm cell initial formation. XyG localization with LM15 was limited to the capitular cells and early sperm cell initials but not in cells of the maturing filaments. This demonstrates a role for XyGs during the key, early transformation of capitulum cells into young sperm filaments and their inclusive sperm cell initials but not in later stages of sperm cell initial multiplication. All of these results demonstrate that antheridial development and spermatogenesis employ cell wall polymers similar to those found in the vegetative thallus of Chara or in the primary cell walls of land plants. Further biochemical analyses will be required in order to refine the identity of these polymers and to identify specific moieties unique to the cell walls of C. corallina and specifically its antheridium.
The development of the spermatogenous filaments in Chara entails many distinct transformational events (Kwiatkowska, 2003). When a sperm cell initial transforms into a functioning sperm cell, the protoplast retracts from the cell wall, becomes helical, produces two flagella and, most importantly, becomes covered with small scales. The scales cover both the sperm cell's plasma membrane and flagellar membranes. In the immunocytochemical part of this study, we found no antibody labelling of the sperm cell surface once scales appeared upon the retracted protoplast. This demonstrates a fundamental switch in extracellular matrix polymer production during the final stage of sperm development, i.e. the conversion of a cell-wall-covered cell to a scale-covered cell. A scale covering is a condition that is commonly seen in the motile cells of the primitive green algal group, the Prasinophyceae, and the basal taxon of the CGA, Mesostigma viride (Domozych et al., 1991). Scales consist of polymers that contain 2-keto sugars and are very different from those found in the cell walls of green plants (Becker et al., 1991, 1994; Domozych et al., 1991). The functional significance of scales in primitive green algae and on motile sperm cells of advanced CGA remains unknown. However, the production of scales during the last phase of spermatogenesis demonstrates that gene expression controlling scale synthesis occurs quickly, precisely and in a coordinated fashion amongst sperm cells. Also, the secretory apparatus (e.g. Golgi apparatus and secretory vesicle network) must switch over rapidly from processing cell wall macromolecules to scales. Conversely, the production of scales occurs only in the motile phase of the Chara lifecycle (e.g. sperm) while all other cells are covered with cell wall. These observations lend support to the idea that cell wall polymers most probably arose in non-motile phases (Mattox and Stewart, 1984). Further analyses will be needed to determine if cell wall macromolecules similar to those found in land plants are found in the non-motile phases of prasinophytes or Mesostigma.
Approximately 470 million years ago, land plants evolved from a group of green algal ancestors that are currently represented by the CGA. Gametangium development during sexual reproduction phases of the life cycle represents a critical phenomenon that is necessary for gene transfer and survival. Cell wall development is an integral part of this morphogenesis. The green algal ancestors of land plants, the CGA, evolved mechanisms that employed many cell wall polymers also found in land plants to yield complex gametangia like the antheridium. Further studies will be needed to investigate the cell wall dynamics of other structures including the oogonia and zygotes in the CGA in order to elucidate more fully the evolution of the cell wall and its roles in sexual reproduction.
ACKNOWLEDGEMENTS
We thank Amy Snyder for her efforts in isolating antheridia, and Catherine R. Domozych for her help in reviewing this manuscript. We thank J. Paul Knox of the University of Leeds for many of the antibodies used in this study. Part of this work was supported by a grant from National Science Foundation (DBI-0419131; to D.S.D.).
