

Abstract
Conversion/alloying materials (CAMs) represent a potential alternative to graphite as a Li-ion anode active material, especially for high-power applications. So far, however, essentially all studies on CAMs have been dealing with nano-sized particles, leaving the question of how the performance (and the de-/lithiation mechanism in general) is affected by the particle size. Herein, we comparatively investigate four different samples of Zn0.9Co0.1O with a particle size ranging from about 30 nm to a few micrometers. The results show that electrodes made of larger particles are more susceptible to fading due to particle displacement and particle cracking. The results also show that the conversion-type reaction in particular is affected by an increasing particle size, becoming less reversible due to the formation of relatively large transition metal (TM) and alloying metal nanograins upon lithiation, thus hindering an efficient electron transport within the initial particle, while the alloying contribution remains essentially unaffected. The generality of these findings is confirmed by also investigating Sn0.9Fe0.1O2 as a second CAM with a substantially greater contribution of the alloying reaction and employing Fe instead of Co as a TM dopant.
Export citation and abstract BibTeX RIS

Original content from this work may be used under the terms of the Creative Commons Attribution 4.0 license. Any further distribution of this work must maintain attribution to the author(s) and the title of the work, journal citation and DOI.
1. Introduction
The demand for electrochemical energy storage devices and specifically lithium-ion batteries (LIBs) has increased dramatically in recent years, and is expected to continuously grow at an even faster rate due to the rising importance of electric mobility [1–4]. The most used electrode active materials in LIBs are insertion/intercalation compounds due to their highly reversible de-/lithiation process and, thus, excellent cycling stability [5–7]. The negative electrode, which is usually referred to as the anode in the scientific literature and also in this work (although this is only correct for the discharge, i.e. when the negative electrode is oxidized), is most commonly composed of graphite. However, its reversible capacity is limited to 372 mAh g−1 and the sluggish lithiation limits fast charging, especially at low temperatures [8]. Potential high-capacity alternatives are based either on an alloying or a conversion mechanism, or the combination of these two—frequently referred to as conversion/alloying materials (CAMs) [9–15]. Two of the most investigated CAMs are transition metal (TM)-doped zinc oxides [16–21] and tin oxides [22–29]. The introduction of the TM(s) and its reduction to the metallic state upon lithiation allows for the reversible formation of Li2O by suppressing significant crystal growth of the metallic nanograins formed upon lithiation, thereby ensuring the maintenance of electron conducting percolating networks within the original particle [19, 30–32]. The enhanced reversibility of the conversion and alloying reaction greatly boosts the specific capacity to more than 900 mAh g−1 for zinc oxides and about 1,300 mAh g−1 for tin oxides [9]. In addition to these high capacities, such materials show very good rate capability [33–35]. It should be noted, though, that essentially all studies on CAMs (just like for pure conversion- and alloying-type materials) have been focusing on nano-sized (primary) particles, which certainly adds to the high rate capability as a result of the shorter transport pathways for lithium ions and electrons [36–38]. However, the use of nanomaterials can result in issues concerning safety and the handling requires more safety measures to prevent exposure to workers [39–41]. Furthermore, the large surface area of smaller particles leads to an increased reactivity and a decreased Coulombic efficiency due to more solid electrolyte interphase (SEI) formation at the active material–electrolyte interface [42, 43]. Finally, a smaller particle size of the active material also results in a lower tapped density and thereby also a lower volumetric energy density of the resulting battery. These issues might be addressed by realizing micron-sized secondary particles [33]—as has been done for common cathode materials [44–46]—or simply increasing the size of the primary particles, as recently done for layered lithium TM oxide cathodes [47, 48].
Following the latter approach, we comparatively investigate herein the influence of the (primary) particle size on the electrochemical behavior of Co-doped ZnO (Zn0.9Co0.1O) as a CAM-type lithium-ion anode by varying the particle size from around 30 nm to about 1–2 μm—with a particular focus on the impact on the conversion and the alloying contribution. Moreover, we investigate the influence of the particle size on the electrochemical reaction at three different length scales, i.e. its impact on the integrity of the electrode layer, the preservation of the particle structure, and its impact on the reaction mechanism at the microscopic level. Finally, we confirm the generality of these findings by extending our study to a comparative investigation of Fe-doped SnO2 (Sn0.9Fe0.1O2) with a varying particle size, which is characterized by a substantially larger contribution of the alloying reaction and Fe instead of Co as TM dopant.
2. Experimental section
2.1. Material synthesis
The synthesis of nano-sized Zn0.9Co0.1O (Zn0.9Co0.1Onano) was performed according to the procedure described by Mueller et al [30]. In brief, stoichiometric amounts of zinc(II) gluconate hydrate and cobalt(II) gluconate hydrate (both from ABCR) were dissolved in deionized water, resulting in a total metal ion concentration of 0.2 M. This solution was added to an aqueous 1.2 M sucrose solution and stirred for 15 min. Subsequently, the water was evaporated at 160 °C and the solid residue was dried at 300 °C, manually ground and calcined for 3 h at 400 °C under ambient atmosphere (heating rate: 3 °C min−1) in a tube furnace (Nabertherm, RD 30/200/11). The Zn0.9Co0.1O samples with an increased particle size were prepared by sintering the Zn0.9Co0.1Onano powder at different temperatures, ranging from 750 °C to 1000 °C (heating rate: 3 °C min−1) in a tube furnace for 3 h under ambient atmosphere (for the samples sintered at >750 °C) or under argon atmosphere (for the sample sintered at 750 °C). In all cases, 1 g of the as-synthesized Zn0.9Co0.1Onano powder was manually ground and pressed into a pellet at 5 t for 1 min to ensure high inter-particle contact. For the subsequent sintering, the pellet was placed in an yttria-stabilized zirconia crucible. For the carbon coating, 1 g of Zn0.9Co0.1O was mixed with 0.5 g of sucrose and 2 g of ultra-pure water. The mixture was homogenized by planetary ball milling (Pulverisette 4, Fritsch) for 1.5 h and dried at 80 °C. For the carbonization of the sucrose, the mixture was thermally treated at 500 °C for 4 h under argon atmosphere in a tube furnace. These procedures were exactly the same for the Sn0.9Fe0.1O2 samples, with the initially obtained Sn0.9Fe0.1O2 nano being synthesized as reported earlier by Mueller et al [22]. The only difference was that the sintering was conducted under ambient atmosphere for all the different temperatures.
2.2. Physicochemical characterization
The investigation of the crystal structure was conducted via x-ray diffraction (XRD) using a Bruker D8 Advance diffractometer (Cu–Kα radiation, λ = 0.154 nm) within a 2θ range from 20° to 100°. Scanning electron microscopy (SEM) was conducted by means of a Zeiss Crossbeam 340 field-emission electron microscope. Tranmission electron microscopy (TEM) was carried out using a JEOL JEM-3000. The ex situ samples were galvanostatically cycled in Swagelok-type cells with a lithium counter and reference electrode and a 1 M solution of LiPF6 in a mixture of ethylene carbonate (EC) and diethyl carbonate (DEC) (EC:DEC 3:7 w/w) as the electrolyte. After cycling, the cells were disassembled in an argon-filled glove box, and the electrodes were rinsed with dimethyl carbonate (DMC). Subsequently, the rinsed electrodes were transferred to the SEM using an airtight transport box. The mass ratio of the carbon coating was determined by thermogravimetric analysis (TGA; Model Q5000, TA Instruments) under oxygen atmosphere in the temperature range from 40 to 850 °C (heating rate: 10 °C min−1). The Brunauer–Emmett–Teller (BET) surface area was determined via nitrogen adsorption using an Autosorb-iQ (Quantachrome).
2.3. Electrode preparation
Electrodes were prepared by mixing the active material and carbon black (Super C65, Imerys) and adding this mixture to a 1.25 wt% solution of sodium carboxymethyl cellulose (CMC, Dow Wolff Cellulosics) in ultra-pure water. The dry composition of all electrodes was 75 wt% of the active material, 20 wt% carbon black, and 5 wt% CMC. The resulting dispersion was mixed by planetary ball-milling for 2 h. The homogenized slurry was cast on dendritic copper foil (Schlenk, thickness ∼20 μm) utilizing a laboratory-scale doctor blade with a wet film thickness of 120 μm. The electrode sheets were dried initially at 80 °C for 5 min and subsequently at room temperature overnight. Disc electrodes were punched (⊘ = 12 mm) and dried at 120 °C for 12 h under vacuum. The average active material mass loading was about 1.5 mg cm−2.
2.4. Cell assembly and electrochemical characterization
The electrochemical characterization was performed in three-electrode Swagelok-type cells and in two-electrode coin cells (Hohsen). All cells were assembled in an argon-filled glove box (MBraun; oxygen and water content <0.1 ppm). A sheet of glass fiber fleece (Whatman, GFD), soaked with a 1 M solution of LiPF6 in a mixture of EC and DEC (EC:DEC 3:7 w/w, UBE) served as the separator. Battery-grade lithium metal (Honjo) served as both counter and reference electrodes. Galvanostatic cycling was conducted at 20 °C using a Maccor Battery Tester 4300 with the cells being placed in a climatic chamber (BINDER). A dis-/charge rate of 1 C corresponds to a specific current of 1000 mA g−1.
2.5. Simulation
For the simulation of the volume changes of the CAM anodes with different particle sizes, the commercial finite element package ABAQUS was used. In order to solve the mass diffusion problem, the volume expansion was simulated by heat transfer, which shows analogies to mass diffusion, according to Prussin [49]. The assumed volume increase during lithiation was taken from the literature [14]. In the simulation, the active material was treated as a solid-element with a Young's modulus of 133 000 MPa and the liquid electrolyte as a smoothed particle hydrodynamics (SPH) element with a Young's modulus of 100 MPa. The boundary conditions allowed the sample to move freely in the y-direction and did not allow any expansion in the other directions. To simulate the large expansion upon lithiation, the sample was 'heated' to 2000 K in the simulation. The probed sample volume was 100 × 100 × 100 LE3 and the particles had a radius of 10 LE for the smaller particles and 15 LE for the larger ones. While this difference in size does not completely reflect the difference in particle size of the real sample, it was chosen as a compromise to keep the computational time acceptable.
2.6. Operando XRD
Operando XRD upon electrochemical cycling was performed by using a self-designed two-electrode cell [50]. The electrode slurry, with the same composition as mentioned above, was homogenized by planetary ball-milling for 2 h and cast on a beryllium (Be) disc (25 mm diameter, 0.25 mm thickness; Materion electrofusion). The beryllium disc served simultaneously as the current collector and 'window' for the x-ray beam. After the coating, the Be disc was dried for 4 h at room temperature and at 60 °C under vacuum overnight. Metallic lithium served as the counter and reference electrode and glass fiber fleeces (diameter 19 mm), drenched with 300 μL of the electrolyte (1 M LiPF6 in EC:DEC 3:7 w/w, UBE) served as the separator. The 21 range was set to 20°–65°.
3. Results and discussion
3.1. Synthesis and physicochemical characterization: Zn0.9Co0.1O
First, we synthesized nano-sized Zn0.9Co0.1O (Zn0.9Co0.1Onano) according to an earlier reported procedure [30]. This material served as reference (with regard to our previous studies [16, 30]) and 'precursor' for the compounds with a larger particle size, which were obtained via sintering at different temperatures [51]. Sintering is a process that involves applying thermal energy to a compacted powder by subjecting it to elevated temperatures below its melting point. Under these conditions the small particles of the powder aim to minimize their surface energy and the thermally enabled atomic/ionic diffusion yields a densification and growth of the particles [52]. The growth of particles during sintering is also called coarsening. During the sintering the temperature is practically the most important factor and there is an increase in grain size with an increasing temperature owing to the greater diffusion of the atoms/ions [53]. Targeting a range of elevated particle sizes, we chose three different sintering temperatures, i.e. 750 °C, 900 °C, and 1000 °C. The corresponding samples are hereinafter referred to as Zn0.9Co0.1O-750, Zn0.9Co0.1O-900, and Zn0.9Co0.1O-1000, respectively. Figure 1(a) shows the comparison of the XRD patterns recorded for these four samples. All samples have a hexagonal wurtzite structure, matching the reference PDF 01-071-6424 reference data, and do not reveal any additional reflections. This indicates that the Co dopant has been successfully introduced into the ZnO crystal structure and that this structure was well preserved during the sintering step, independent of the temperature applied. Nonetheless, the width of the reflections is continuously decreasing when applying the additional sintering step along with an increasing temperature, which is in line with the expected increase in crystallite size. Accordingly, the BET surface area is decreasing when applying the subsequent sintering and with an increasing sintering temperature, from 32 m2 g−1 (Zn0.9Co0.1Onano) to 4.5 m2 g−1, 1.7 m2 g−1, and 0.8 m2 g−1 for Zn0.9Co0.1O-750, Zn0.9Co0.1O-900, and Zn0.9Co0.1O-1000, respectively (figure 1(b)). Performing SEM and TEM further supports these findings by revealing a particle size of about 30 nm for Zn0.9Co0.1Onano (figure 1(c)) and around 100–250 nm for Zn0.9Co0.1O-750 (figure 1(d)), 300–750 nm for Zn0.9Co0.1O-900 (figure 1(e)), and 1–2 μm for Zn0.9Co0.1O-1000 (figure 1(f)).
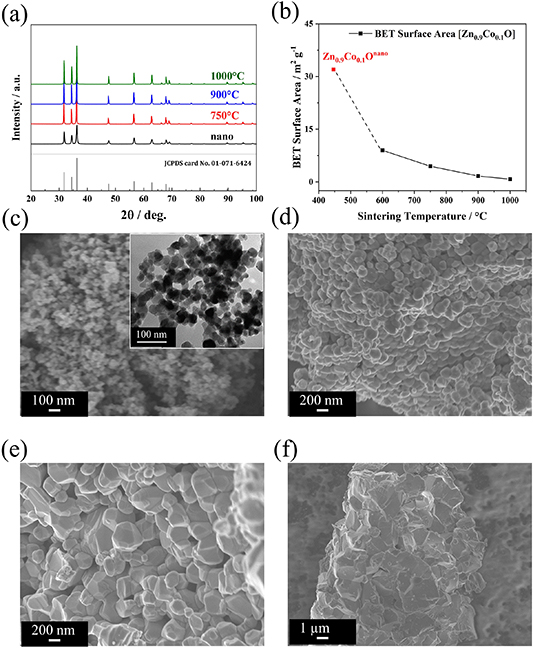
Figure 1. (a) Comparison of the XRD patterns for Zn0.9Co0.1Onano (in black), Zn0.9Co0.1O-750 (in red), Zn0.9Co0.1O-900 (in blue), and Zn0.9Co0.1O-1000 (in green) with the PDF reference 01-071-6424 for wurtzite ZnO given at the bottom. (b) Comparison of the BET specific surface area for these samples. (c)–(f) SEM micrographs of (c) Zn0.9Co0.1Onano (with a TEM micrograph as inset), (d) Zn0.9Co0.1O-750, (e) Zn0.9Co0.1O-900, and (f) Zn0.9Co0.1O-1000.
Download figure:
Standard image High-resolution image3.2. Electrochemical characterization: Zn0.9Co0.1O
To investigate the influence of the particle size on the electrochemical behavior, we prepared electrodes based on the different active materials and cycled these in half-cell configuration with lithium metal counter (and reference) electrodes. The dis-/charge profiles for the first (figure 2(a)) and second (figure 2(b)) cycle generally reveal the same shape as reported in a previous study [30], indicating that the overall reaction mechanism, i.e. the reduction to LiZn, Co0, and Li2O and subsequent reoxidation is the same for all samples studied herein. Please note that the choice of the of the upper cut-off voltage of 3.0 V is motivated by the scientific interest to be able to study the complete de-/lithiation reaction of this material. Practical applications would require a much lower delithiation cut-off [54], which, as a matter of fact, would beneficial for the energy density and energy efficiency also for CAMs, as reported earlier [15]. Nonetheless, for the sake of scientific interest, we applied a significantly higher delithiation cut-off for our investigation. In the case of Zn0.9Co0.1Onano, the first cycle discharge profile (figure 2(a)) shows a higher capacity at potentials above the voltage plateau and, consequently, also a higher overall discharge capacity. This is assigned to the small particle size and relatively highest specific surface area, favoring the decomposition of the electrolyte at the electrode/electrolyte interface and the formation of the SEI at about 0.8 V [55, 56]. Upon the subsequent charge (delithiation), the voltage profiles of all samples are very similar during the dealloying reaction (below 1 V). This indicates that the initial lithiation reaction, including both conversion (i.e. the reduction of the oxide to metallic cobalt and zinc) and alloying (i.e. the formation of LiZn), is complete—independent of the particle size. The capacity of the reconversion reaction, occurring at higher potentials, however, gradually decreases with increasing particle size, leading to a decreasing overall delithiation capacity. It is thus concluded that the particle size is mostly affecting the reconversion reaction, i.e. the reoxidation of the (dealloyed) metals to the oxide(s). For the second cycle (figure 2(b)), this consequently results in a lower lithiation capacity, while the dealloying capacity is essentially the same for all four samples and the trend of a reduced reversibility of the reconversion reaction remains. Given the rather continuous trend in electrochemical behavior as a function of particle size, we focused for the following experiments on the comparison of Zn0.9Co0.1Onano (with the smallest particle size) and Zn0.9Co0.1O-1000 (with the largest particle size). Figure 2(c) shows the evolution of the specific capacity of these two samples upon constant current cycling at C/20 (50 Ma g−1). The capacity of around 800 mAh g−1 recorded for Zn0.9Co0.1O-1000 is stable for a few cycles, before it starts to decrease gradually. This gradual decrease largely originates from a steadily decreasing contribution of the reconversion reaction at elevated potentials as apparent from the corresponding dis-/charge profiles presented in figure 2(d), but there is also a little decrease for the dealloying reaction. For Zn0.9Co0.1Onano, the capacity is initially much higher with more than 900 mAh g−1 and remains being higher, and even increases gradually after 12 cycles. This increase is caused by an increase in capacity close to the upper cut-off voltage for the delithiation reaction, which has been assigned to the quasi-reversible SEI formation [31, 43, 50]. Besides the additional capacity close to the cut-off potentials, the voltage profiles of Zn0.9Co0.1Onano reveal little changes over the course of 20 cycles.
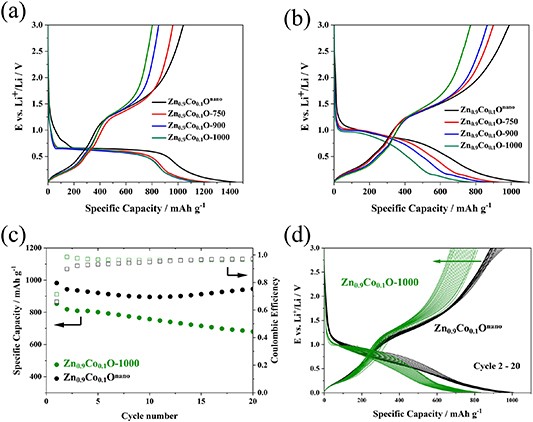
Figure 2. Electrochemical characterization of Zn0.9C0.1O with different particle sizes in half-cells (cut-off voltages: 0.01 and 3.0 V). (a) The dis-/charge profiles for the first cycle at C/40 (25 mA g−1) with Zn0.9Co0.1Onano in black, Zn0.9Co0.1O-750 in red, Zn0.9Co0.1O-900 in blue, and Zn0.9Co0.1O-1000 in green; (b) the dis-/charge profiles for the second cycle at C/20 (50 mA g−1); (c) comparison of the evolution of the reversible specific capacity recorded for Zn0.9Co0.1Onano and Zn0.9Co0.1O-1000 upon constant current cycling (first cycle at C/40, following cycles at C/20); (d) the corresponding dis-/charge profiles for the cycles 2–20.
Download figure:
Standard image High-resolution imageSummarizing, there are two main differences in the electrochemical performance for small Zn0.9Co0.1Onano, and large Zn0.9Co0.1O-1000 particles. First, the reversible capacity of Zn0.9Co0.1O-1000 is lower from the start due to a partially irreversible reconversion reaction. Second, the increased particle size leads to capacity fading, which sets in after a few cycles and then progresses continuously. To understand this behavior, we investigated the influence of the particle size on the electrochemical performance on three different length scales: the electrode (i.e. many particles), the particle, and the crystal structure (i.e. at the atomic level).
3.3. Impact of the particle size at the electrode level
At the electrode level, one potential reason for capacity fading when using CAMs as the active material is the continuous volume variation upon cycling [14], which can lead to contact loss with the conductive carbon and the current collector [57]. To investigate this issue for the different particle sizes, we simulated the mechanical stress and the displacement of individual particles upon lithiation (figure 3). According to a previous study, zinc-based CAMs expand by about 120% at the particle level upon lithiation [14]. This volume increase leads to mechanical stress in the electrodes, which might cause a degradation of the microstructure. Generally, the overall deformation in an electrode can be expressed as the sum of the mechanical deformation (including elastic and elastic-plastic deformations), thermal and chemical deformation. The biggest contribution upon cycling is related to the chemical deformation owing to the incorporation of lithium. Given the analogy between chemical and thermal deformation, however, one may assess the eventual behavior of the electrode also by simulating a thermally induced volume expansion of the particles. Additionally, we restricted any expansion of the electrode to the z direction (i.e. the thickness of the electrode, commonly being in the μm range) as the most relevant one and fixed the dimensions in the x and y direction (i.e. the length and width of the electrode, commonly being in the range of several cm at least). For the sake of simplicity, the CAM particles were simulated as rigid balls (a solid element with a Young's modulus of 133 MPa) and the pores between the particles were filled with the electrolyte (with a Young's modulus of 100 MPa, figure 3(a)). We limited the model to these two components, as the amount and nature of the binder and conductive carbon was the same for both electrodes. The sample size had a volume of 100 × 100 × 100 LE3 (units of length) and the small and large particles were represented by spheres with a radius of 10 UL and 15 LE, respectively. The electrochemical lithiation was simulated by 'heating' the sample to 2000 K. During the expansion, a displacement of the particles was observed (figures 3(b) and (c)). Mapping the displacement after the expansion, revealed that the electrode with the smaller particles expands rather homogenously (figure 3(b)), while severe local displacement was observed for the larger particles (figure 3(c)). This displacement might eventually result in contact loss and electronic isolation of the induvial particles, which then do not contribute to the electrochemical reaction anymore. Accordingly, the capacity fading recorded for Zn0.9Co0.1O-1000 is anticipated to originate—at least in part—from the substantially greater displacement upon cycling—especially when considering the much greater difference in size between Zn0.9Co0.1Onano and Zn0.9Co0.1O-1000 compared to the two modeled electrodes.
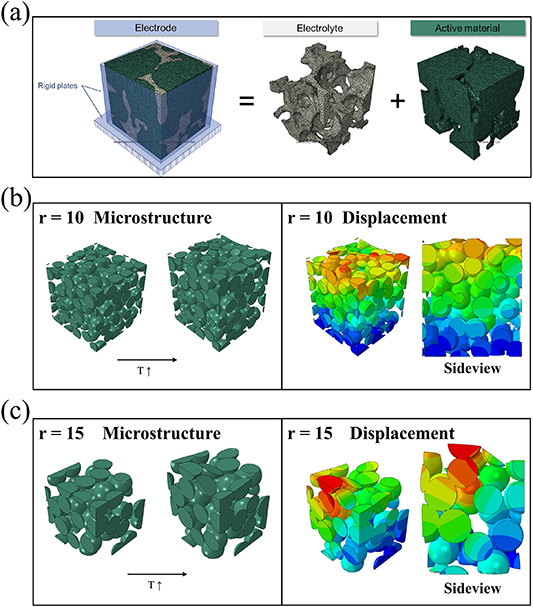
Figure 3. (a) Simulated electrode structure comprising the active material particles (i.e. Zn0.9Co0.1O, in green) and the electrolyte (in grey). (b), (c) Simulated displacement owing to the volume expansion of the particles when setting the radius to (b) 10 LE and (c) 15 LE. The color coding from blue over green and yellow to red indicates an increasing mechanical strain.
Download figure:
Standard image High-resolution image3.4. Impact of the particle size at the particle level
The large expansion of the CAM particles does not only have an impact on the electrode integrity, but also on the integrity of the particles as such, potentially causing fracturing of the particles, which would further add to a capacity loss upon cycling [58]. In fact, for silicon with a much greater volume variation of about 300%, it has been found that the particles crack when exceeding a diameter of around 150 nm [59]. To investigate, if a larger particle size can also lead to cracking in CAMs, we subjected electrodes based on Zn0.9Co0.1Onano and Zn0.9Co0.1O-1000–10 de-/lithiation cycles and conducted an ex situ SEM analysis. The results are presented in figure 4. The Zn0.9Co0.1Onano nanoparticles (as expected) do not reveal any fracturing (figure 4(a)). Differently, the much larger Zn0.9Co0.1O-1000 particles show some elongated cracks (figure 4(b)). Together with the displacement observed at the electrode level via simulation, this cracking at the particle level is expected to further add to the capacity fading in the case of Zn0.9Co0.1O-1000.
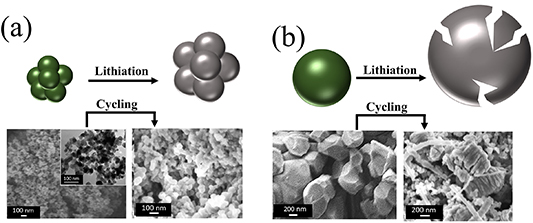
Figure 4. Schematic illustration and SEM micrographs of (a) Zn0.9Co0.1Onano and (b) Zn0.9Co0.1O-1000 before and after electrochemical cycling for 10 cycles.
Download figure:
Standard image High-resolution image3.5. Impact of the particle size at the atomic level
In order to better understand the reason for the particle-size dependent reversibility of the reconversion reaction, we performed a comparative operando XRD analysis of Zn0.9Co0.1Onano (figure 5) and Zn0.9Co0.1O-1000 (figure 6). In both cases, the discharge and charge process can be roughly divided into five different regions, i.e., Region A–C for the lithiation (discharge) as well as Region D and E for the delithiation (charge), depending on the structural changes occurring. The detailed reaction mechanism has already been discussed in detail earlier [16, 30–32]. Therefore, the structural changes are only discussed briefly in the following to maintain the focus on the differences observed for the different particle sizes. For Zn0.9Co0.1Onano (figure 5), during the first five scans in Region A, the potential decreases to the onset of the voltage plateau at about 0.55 V. In this region, the intensity of the main reflections of the wurtzite structure remains essentially unchanged, which agrees with the abovementioned electrolyte decomposition and SEI formation taking place in this voltage range. In Region B, the reflections corresponding to the wurtzite structure are significantly decreasing and a very broad reflection between 41.0° and 45.0° appears starting from scan #6, with a maximum intensity at around 42.6°. The intensity further increases during the following scans (see the corresponding close-up in figure 5). This 2θ value is slightly lower than the 2θ value of 43.0° reported for the main reflection of metallic zinc (PDF 00‐004‐0831), which might indicate the formation of a CoZn alloy, as recently found for Zn0.9Fe0.1O in the vicinity of the TM dopant, i.e., the formation of a FeZn alloy in that case [31]. In fact, the main reflection reported for a Co1.76Zn13.24 alloy (PDF 01-072-9823) appears at 42.8°, very close to the value that we observed—potentially owing to a higher cobalt content. Accordingly, we assigned this newly appearing reflection to a CoZn alloy with an unknown composition (Cox Zn). Nevertheless, considering the broadness of the reflection, the simultaneous formation of an additional Zn0 reflection cannot be excluded—and appears likely, indeed. Besides, the very broad shape of this refection clearly indicates a very small crystallite size, presumably in the range of a few nanometers only. Upon further lithiation, in Region C, the intensity of this reflection with a maximum at 42.6° decreases and a new reflection at 41.0° appears, which is in excellent agreement with the reference data for the LiZn alloy (PDF 03‐065‐3016).

Figure 5. Contour plot of the operando XRD analysis of Zn0.9Co0.1Onano at a specific current of 50 mA g−1 (cut-off voltages: 0.01 and 3.0 V) with the corresponding voltage profile of the de-/lithiation on the right-hand side and close-ups of the XRD patterns recorded upon lithiation and delithiation divided into the five different regions A-E, depending on the structural changes occurring (the given scans are mentioned accordingly in each plot; the intense and constant reflection at about 46° observed also for Zn0.9Co0.1O-1000 is presumably related to an impurity of the Be window).
Download figure:
Standard image High-resolution image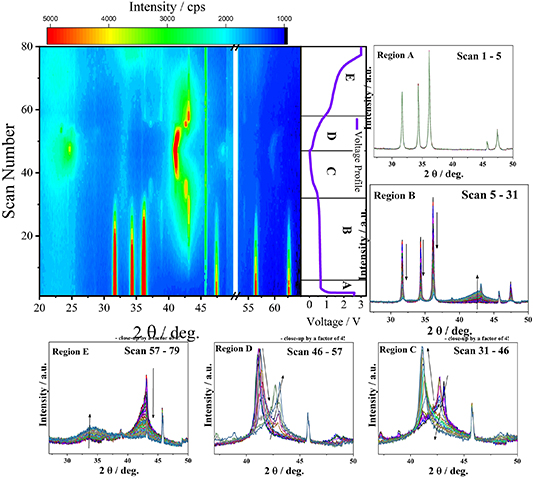
Figure 6. Contour plot of the operando XRD analysis of Zn0.9Co0.1O-1000 at a specific current of 50 mA g−1 (cut-off voltages: 0.01 and 3.0 V) with the corresponding voltage profile of the de-/lithiation on the right-hand side and close-ups of the XRD patterns recorded upon lithiation and delithiation divided into the five different regions A–E, depending on the structural changes occurring (the given scans are mentioned accordingly in each plot; the intense and constant reflection at about 46° observed also for Zn0.9Co0.1Onano is presumably related to an impurity of the Be window).
Download figure:
Standard image High-resolution imageUpon delithiation (charge), the alloying reaction is reversed, as indicated by the decrease of the LiZn reflection at 41.0° and the appearance of a broad reflection between 40.0° and 45.0° (see a close-up of Region D in figure 5). However, in contrast to the broad refection in Region B (i.e. during the lithiation), the new feature shows an additional shoulder at 43.0° and thereby appears to be composed of two reflections, presumably corresponding to the formation of metallic Zn0 and CoxZn (at 43.0° and 42.6°, respectively). In Region E, the reflection at 42.6°/43° decreases in intensity and completely vanishes at 3.0 V. Simultaneously, a broad reflection between 30° and 38° appears, which indicates the reappearance of a wurtzite-structured oxide phase, but with a substantially reduced crystallinity and/or crystallite size compared to the pristine material.
We may note that a minor fraction of the original wurtzite Zn0.9Co0.1Onano remains throughout the experiment, which we ascribe to an issue with the electronic contact for these remaining particles, as a previous study has revealed the complete reduction [30]. Nevertheless, this does not affect the major findings concerning the comparison with Zn0.9Co0.1O-1000 as discussed in the following.
The results for the operando XRD analysis of Zn0.9Co0.1O-1000 are presented in figure 6. The general evolution of the crystal structure is the same as observed for Zn0.9Co0.1Onano, as also indicated by essentially the same voltage profile (see also figure 2). Also in this case, in Region A, the potential drops to around 0.55 V, and the main reflections corresponding to the wurtzite structure remain basically unchanged. In Region B, the intensity of these reflections decreases and a very broad reflection with a maximum at around 42.6° forms, which has been earlier assigned to a Cox Zn alloy with a very small crystallite size (and low crystallinity). Different from Zn0.9Co0.1Onano, however, a very clear additional refection with a maximum at 43.0° appears already during the lithiation, which is significantly narrower than the one at 42.6°, and continues to grow in intensity upon further discharge. As mentioned above, this 2θ value of 43.0° is in excellent agreement with the position of the main reflection reported for metallic zinc (PDF 00‐004‐0831). The narrower shape indicates a substantially larger crystallite size and/or crystallinity compared to the observations for Zn0.9Co0.1Onano. In Region C, this reflection at 43.0° decreases and completely vanishes in scan #33. Simultaneously, new reflections appear at about 37.0°, 41.0°, and 42.7°. The positions and relative intensity of these new reflections are in excellent agreement with the data reported for Li0.105Zn0.895 (PDF 01‐071‐9525), i.e. a lithium-poor alloy with zinc. These findings reveal that the metallic zinc starts to alloy electrochemically with lithium, forming a Lix Zn alloy with an initially low lithium content. From scan #38 onwards, the reflections corresponding to this lithium-poor Lix Zn alloy phase vanish and a rather narrow reflection at 41.0° appears, i.e., the main reflection corresponding to LiZn (PDF 03‐065‐3016), which continues to increase in intensity until it reaches its maximum in scan #46.
Upon delithiation (charge), the alloying reaction is reversed, as indicated by the decrease in intensity of the LiZn-related reflection at 41.0° and the increase of the Lix Zn-related reflections at about 37.0°, 41.0°, and 42.0°. Starting from scan #52, the reflections corresponding to the Lix Zn alloy disappear again and a reflection at 43.0° (corresponding to Zn0) was observed and increases in intensity upon scan #52 to scan #57. In Region E, the reflection at 43.0° decreases in intensity and completely vanishes at 3.0 V. Simultaneously and comparable to Zn0.9Co0.1Onano, a broad reflection appears between 30° and 38°, which indicates the reappearance of a wurtzite-structured oxide phase with a rather small crystallite size and/or low crystallinity.
In sum, the comparative operando XRD analysis reveals that the size of the Zn0.9Co0.1O particles affects the reaction mechanism with regard to the crystallite size of the metallic zinc alloying phases. In fact, for Zn0.9Co0.1Onano, all new reflections occurring upon lithiation and delithiation remain very broad, reflecting a small crystallite size. Differently, for Zn0.9Co0.1O-1000, the Zn0 and LiZn phases are characterized by a comparably very narrow shape, indicating a rather large crystallite size. This is highlighted in figures 7(a) and (b) by directly comparing the XRD patterns recorded for Zn0.9Co0.1Onano and Zn0.9Co0.1O-1000 at the end of Region C (figure 7(a)) and Region D (figure 7(b)), showing the reflections corresponding to the LiZn and the Zn0 (as well as the Cox Zn) phase, respectively. In both cases, the reflections recorded for Zn0.9Co0.1O-1000 are much sharper and more intense compared to the ones observed for Zn0.9Co0.1Onano. For a rough estimation of the crystallite size, we used the Scherrer equation (equation (1)) to evaluate exemplarily the reflections corresponding to the LiZn phase (41.0°) at the end of Region C (figure 7(a)). The calculation revealed a crystallite size of about 60 Å and 150 Å, for Zn0.9Co0.1Onano and Zn0.9Co0.1O-1000, respectively.
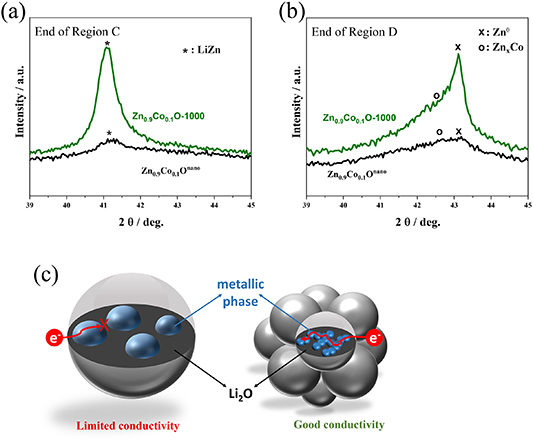
Figure 7. Comparison of the XRD patterns recorded (a) at the end of the alloying reaction (Region C) and (b) at the end of the dealloying reaction (Region D) for Zn0.9Co0.1Onano (in black) and Zn0.9Co0.1O-1000 (in green). (c) Schematic illustration of the findings concerning the size of the metallic zinc and alloying phases formed for the two different samples depending on the initial particle size and the current density applied per unit surface area.
Download figure:
Standard image High-resolution imageIn this equation, FWHM is the full width at half-maximum of the diffraction reflection, k is a dimensionless shape factor, λ is the x-ray wavelength, D is the crystallite size and θ is the Bragg angle. We may note that these values have to be taken with a certain care, but the trend is evident. An initially smaller particle size favors the formation of very fine metallic zinc and alloying phases, which apparently affects particularly the reversibility of the conversion reaction at elevated potentials. Generally, the nucleation and growth of metallic nanograins in a Li2O matrix is a complex solid-state reaction which involves charge and mass transport. According to a previous study on metal fluorides [60], the size of the metallic nanograins is decisive for the reversibility of the conversion reaction and larger metallic nanograins are less capable of ensuring an electronically conductive network within the original active material particle. This is in agreement with our findings, as the reconversion is apparently hindered when larger metallic zinc and alloying phases are formed as in the case of Zn0.9Co0.1O-1000 (see figure 7(c) for a schematic illustration).
3.6. Impact of the applied current
Given the fact that the chemical composition of the two materials is the same, one might wonder why the larger particles show the tendency to form larger zinc (alloy) grains. One possible explanation might be the different current density per unit surface area of the samples—comparable to the different initial reaction pathway reported for Co3O4 [61, 62]—as the surface area is substantially different for the two samples (see figure 1(b)). To investigate the impact of the applied specific current on the reversibility of the conversion and alloying reaction, we studied the de-/lithiation at different dis-/charge rates. For this purpose, however, we first applied a carbonaceous coating (hereinafter referred to by adding a 'C' to the sample name) to overcome the capacity fading observed earlier for Zn0.9Co0.1O-1000 (see figures 2(c) and (d)). The carbon content was in the range of 8.5–11.0 wt% for all samples (figure S1). The coating and additional carbonization step at 500 °C did not significantly alter the original particle morphology or crystal structure (figure S2), neither did they affect the general trend concerning the electrochemical behavior as a function of the particle size, i.e., the reversibility of the conversion reaction was still decreasing with an increasing particle size (figure S3). Accordingly, we focused again on the comparison of Zn0.9Co0.1Onano-C and Zn0.9Co0.1O-1000-C (figure 8). Figure 8(a) presents the constant current cycling at C/5 (200 mA g−1) of half-cells employing working electrodes with Zn0.9Co0.1Onano-C (in black) and Zn0.9Co0.1O-1000-C (in green) as the active material. The capacity is very stable for both compounds with about 880 mAh g−1 for Zn0.9Co0.1Onano-C and around 720 mAh g−1 for Zn0.9Co0.1O-1000-C. The carbon coating was apparently effective in stabilizing the capacity. The corresponding dis-/charge profiles are depicted in figure 8(b), revealing that the contribution of the alloying reaction at potentials up to about 1 V was essentially the same for both materials and that the lower capacity in the case of Zn0.9Co0.1O-1000-C was related to a limited reconversion reaction at elevated potentials—just as found also for the non-coated materials. Subsequently, we subjected the cells to a series of different dis-/charge rates (after an initial formation cycle at C/20), ranging from C/10 to 10 C (i.e. up to 10 000 mA g−1). The plots of the specific capacity vs. the cycle number are shown in figure 8(c). At lower C rates, the capacity is higher for Zn0.9Co0.1Onano-C with, e.g., about 870 mAh g−1 compared to 750 mAh g−1 for Zn0.9Co0.1O-1000-C at C/10. This is consistent with the previous findings. However, the difference is decreasing with an increasing C rate. In fact, for very high C rates of 5 C and 10 C, the specific capacity is essentially the same for the two samples, maybe even slightly higher for Zn0.9Co0.1O-1000-C. This is counterintuitive at first view, since nano-sized materials commonly show a better rate capability due to the shorter transport pathway for the lithium cations and the higher electrode/electrolyte contact area, resulting in a lower current density per unit surface area. The careful inspection of the corresponding dis-/charge profiles (figure 8(d)) revealed that the contribution of the alloying reaction was fairly the same for both compounds at all C rates up to 2 C (remarkably, also the corresponding overpotential), while the extra capacity for Zn0.9Co0.1Onano-C was obtained at elevated delithiation potentials, i.e., related to the contribution of the conversion reaction. At very high C rates of 5 C and 10 C, however, the overpotential was higher for Zn0.9Co0.1Onano-C, resulting in a slightly lower overall capacity. This suggests that the SEI formed upon cycling, which is more pronounced in the case of Zn0.9Co0.1Onano-C (see figure S3), eventually determines the achievable specific capacity by hindering the charge transport (in)to the active material particles. While this observation highlights the need for a well-designed interface with the electrolyte (as well as the interphase formed), the most intriguing finding was that the kinetics of the alloying reaction are very little, if at all, affected by the Zn0.9Co0.1O particle size. In fact, this, in turn, indicates that the Li+ transport within the active material particles is not limiting the achievable capacity, since this would expectedly result in a significantly lower capacity for larger particles. Moreover, a rough separation of the contribution of the reconversion and dealloying reaction by considering the change in slope at about 1 V (increasing with an increasing specific current; figure 8(d)) shows that the contribution of the (de-)alloying reaction is decreasing less with an increasing C rate compared to the contribution of the (re-)conversion reaction. Accordingly, the nanosized particles are losing their 'capacity advantage' at very high C rates, which also contributes to the comparably greater decrease in overall capacity at 5 C and 10 C.

Figure 8. Comparative electrochemical characterization of Zn0.9C0.1Onano-C and Zn0.9C0.1O-1000-C in half-cells (cut-off voltages: 0.01 and 3.0 V; 1 C = 1000 mA g−1). (a) Comparison of the evolution of the reversible specific capacity upon constant current cycling (first cycle at C/20, following cycles at C/5); (b) the corresponding dis-/charge profiles for the cycles 2–20; (c) evaluation of the rate capability by applying elevated C rates ranging from C/10 to 10 C (first cycle at C/20); (d) the corresponding charge (delithiation) profiles for the third cycle at each C rate.
Download figure:
Standard image High-resolution imageThese findings are important with respect to the potential application in lithium-ion cells, for which the upper cut-off potential will have to be limited to 1.5 V or even lower values in order to realize a reasonably high output voltage for the full-cell. In this regard, the independence of the alloying reaction from the particle size and the favorable de-/lithiation kinetics for the alloying contribution at low potentials in combination with the fast Li+ transport within the particle are, indeed, beneficial.
3.7. Extension to Sn0.9Fe0.1O2
In order to confirm the applicability of the results for CAMs in general, we extended the investigation also to Sn0.9Fe0.1O2, which provides a relatively higher contribution of the alloying reaction (ca. 50% compared to about 30% [15]) and contains Fe rather than Co as TM dopant. The XRD patterns, BET analysis, and SEM micrographs for the as-synthesized Sn0.9Fe0.1O2 nano as well as the samples sintered at different temperatures (i.e., 750, 900, and 1000 °C) are presented in figure S4. Also, in this case, the additional sintering step results in an increasing crystallite and particle size, ranging from around 10 nm (Sn0.9Fe0.1O2 nano) over 40 nm (Sn0.9Fe0.1O2-750) and 80 nm (Sn0.9Fe0.1O2-900) up to 0.5 μm (Sn0.9Fe0.1O2-1000), accompanied by a continuous decrease in specific surface area. Subsequently, we applied a carbon coating prior to the electrochemical characterization in order to obtain stable cycling [26, 63]. The results are presented in figure 9. In fact, just like for Zn0.9Co0.1O, an increase in particle size led to lower capacities (figure 9(a)), originating from a reduced (re-)conversion capacity, while the capacity obtained by the alloying contribution was not affected by the different particle size (figure 9(b)). Moreover, the comparison of the rate capability, depicted in figure 9(c) exemplarily for Sn0.9Fe0.1O2 nano-C and Sn0.9Fe0.1O2-1000-C, revealed that the difference in reversible capacity was decreasing with an increasing C rate. At very high C rates of 5 C and 10 C, the capacity was eventually the same for the two samples. The plot of the corresponding charge (delithiation) profiles (figure 9(d)) shows that the contribution of the alloying reaction decreased only very little up to 1 C and slightly at 2 C, before dropping to substantially lower values at 5 C and 10 C for both samples, while the contribution of the conversion reaction decreased at a faster pace with an increasing current applied. Moreover, also for Sn0.9Fe0.1O2, the polarization was greater for Sn0.9Fe0.1O2 nano-C at very high C rates, indicating that the charge transport through the (in this case more pronounced) SEI became rate-determining.

Figure 9. (a), (b) Comparative electrochemical characterization of Sn0.9Fe0.1O2 nano-C (in black), Sn0.9Fe0.1O2-750-C (in blue), and Sn0.9Fe0.1O2-1000-C (in orange) in half-cells (cut-off voltages: 0.01 and 3.0 V; 1 C = 1000 mA g−1). (a) Comparison of the evolution of the reversible specific capacity upon constant current cycling (first cycle at C/20, following cycles at C/5); (b) the corresponding dis-/charge profiles for the cycles 2–6. (c) Evaluation of the rate capability for Sn0.9Fe0.1O2 nano-C and Sn0.9Fe0.1O2-1000-C by applying elevated C rates ranging from C/10 to 10 C (first cycle at C/20); (d) the corresponding charge (delithiation) profiles for the third cycle at each C rate.
Download figure:
Standard image High-resolution image
4. Conclusions
The particle size is an important parameter for the electrochemical behavior of CAMs, and the reversible capacity decreases with an increasing particle size. For large particles, the capacity is fading faster, which originates from particle cracking and the displacement of the particles at the electrode level. The generally lower capacity is essentially related to a decreasing contribution of the (re-)conversion reaction due to the formation of relatively larger zinc (alloy) nanograins upon de-/lithiation, resulting in less effective electronic wiring within the active material particle. The formation of these larger Zn0 and LiZn nanograins, however, does not affect the contribution of the alloying reaction, which is essentially independent of the active material particle size, rendering the alloying kinetics rather fast compared to the reconversion kinetics. The comparative investigation of Zn0.9Co0.1O and Sn0.9Fe0.1O2, with a different ratio of the alloying contribution and being composed of different cationic species, renders these findings generally applicable for CAMs—and potentially also for pure conversion- and alloying-type materials.
5. Future perspectives
The development of new Li-ion anode materials is of major importance for the realization of new batteries with increased energy density and fast charging capability. For this reason, the scientific community is investing a lot of efforts in designing new and/or optimized materials. With regard to the anode, in fact, most of the research focuses on enhancing the performance by optimizing the particle morphology, engineering the composition of the bulk material, or its surface, frequently including the development of advanced nanostructured material architectures. While this generally leads to shorter diffusion pathways (and thereby enhanced kinetics), it also adds some disadvantages for the commercial implementation of the compound, namely a higher reactivity of the surface (and thereby a lower Coulombic efficiency) and more challenging synthesis procedures and handling regulations. Additionally, to what extent the nano-structuration eventually adds to a (commonly) superior performance remains frequently overlooked. In this work we investigated the impact of the particle size of conversion-alloying anode materials on the electrochemical behavior and the reaction mechanism by comparatively studying the same material with varying particle sizes. We may encourage others to add to an enhanced understanding of the impact of the particle size also for other charge storage mechanisms in order to benefit from micro-sized particles whenever possible and use nano-sized particles whenever needed.
Acknowledgments
Financial support from the Vector Foundation within the NEW E2 Project and the Helmholtz Association is kindly acknowledged. Moreover, the authors would like to acknowledge the financial support from the Young Investigator Network (YIN) at KIT via the YIN Grant.
Conflict of interest
The authors declare that they have no known competing financial interests.
Supplementary data (1.4 MB DOCX)