

Abstract
Fluorescence spectroscopy is commonly employed to study the excited-state photophysics of organic molecules. Planar Fabry-Pérot microcavities play an essential role in such studies and a strategic cavity design is necessary to attain an enhanced light-matter interaction. In this work, we computationally study different geometries for a planar metallic Fabry-Pérot microcavity tuned for the absorption of Sulforhodamine 101, a typical dye for fluorescence spectroscopy. The cavity consists of a polymer layer enclosed between two silver mirrors, where the thicknesses of all the three layers are varied to optimize the cavity. Our transfer-matrix and finite-difference time-domain simulations suggest that a cavity with 30 nm thin top mirror and 200 nm fully reflective thick bottom mirror, thus having only reflection and absorption and no transmission, is an optimal design for maximizing the Purcell factor and spectral overlap between the cavity and molecule, while still sustaining an efficient measurability of the fluorescence.
Export citation and abstract BibTeX RIS

Original content from this work may be used under the terms of the Creative Commons Attribution 4.0 licence. Any further distribution of this work must maintain attribution to the author(s) and the title of the work, journal citation and DOI.
1. Introduction
Low-Q planar Fabry-Pérot (FP) microcavities, doped with photoactive organic molecules, are essential in exploring light-matter interactions under weak [1–4] and strong coupling limit [5, 6], and often employed in the studies of excited-state photochemistry [7, 8], photovoltaics [9], and cavity-quantum electrodynamics [10].
Planar metallic FP microcavities are popular in spectroscopy [3, 6] since they are simpler to fabricate and realize than dielectric cavities [11, 12]. However, implementing them in fluorescence spectroscopy is challenging, because usually one can tune the cavity resonance and thus the enhancement either for molecular absorption or emission, but not fully for both. The usual choice has been to do the excitation or detection via light leaking through a thin enough mirror, which, however, limits the quality factor ( ) of the microcavity to well below hundred. However, mode volumes (
 ) of the all-metallic microcavities are really small, which in the case of multimolecule coupling is enough to drive the system even to an ultrastrong coupling regime [13].
Performance of a FP cavity in fluorescence spectroscopy depends on its field-confinements in temporal ( ) and spatial (
 ) domains. Here
  where
where  is the wavelength of the cavity resonance and
  is the full-width at half-maximum of the resonance peak [14]; and,
 ![${{\rm{V}}}_{{\rm{m}}}=\left[\displaystyle \int {\epsilon }{\left|{\boldsymbol{E}}\right|}^{2}dV\right]/[\,\max \left({\epsilon }{\left|{\boldsymbol{E}}\right|}^{2}\right)],$](https://content.cld.iop.org/journals/2633-1357/2/1/015205/revision2/iopsnabec2bieqn8.gif) where
where  is the dielectric function and
  is the electric-field amplitude inside the interaction volume
  [15]. Purcell factor determines the fluorescence enhancement inside the cavity and it is
  where
where  is the refractive index in
  [16]. Increasing
  and decreasing
  readily improves
  However, increasing
  often requires highly reflective mirrors, incurring a reduced cavity transmission, which further reduces the measurability of the fluorescence. Thus, an optimized compromise is needed.
In addition, the aforementioned  is 'ideal', assuming—perfect spectral overlap of the cavity mode with the fluorescence spectrum, and emitter location at the antinode of the cavity mode with its transition dipole aligned with the local electric field [17]. In reality, matching of the cavity mode of doped microcavities, with the emission spectrum of an ensemble of emitters spatially distributed within the cavity field with randomly oriented dipoles, can be challenging [18]. Hence, only a fraction of the emission couples to the cavity leading to an effective
  much lower than the ideal [4].
Improving the effective  can be done by spectral tuning between the cavity mode and the emitter responses. Increasing the spectral overlap between the molecular emission
  and the cavity absorption
  i.e. emission overlap
 will increase the fraction of the emission coupled to the cavity, resulting in more efficient fluorescence enhancement [19]. Similarly, excitation efficiency of the fluorescent molecules inside the cavity depends on the spectral overlap between
  and the molecular absorption
  i.e. absorption overlap
 which has to be high for an efficient cavity-molecular coupling [20].
Taking into account the above excitation efficiency (
 ) and considering that—only a fraction of the molecular emission coupled with the cavity absorption (
 ) is enhanced by a factor of
  and collected through a cavity mirror possessing an average transmissivity
  , the total integrated fluorescence intensity measurable outside of the microcavity can be formulated as
  .
.  is an estimation of the measurability of fluorescence, which is not necessarily optimal at optimal
  Therefore, a strategic cavity design is needed to attain an optimal
  ,
,  ,
,  and
and  to obtain the best
  which we use as our main criteria for the cavity here.
In this work, we computationally study different geometries for a planar metallic FP microcavity. To calculate  we have chosen sulforhodamine 101 (SR101) dye as our model molecule and tuned the cavities for its absorption maximum (576 nm). The cavity consists of a polymer layer enclosed between two silver mirrors, and the thicknesses of all the three layers are varied to optimize the cavity properties. Our transfer-matrix method (TMM) and finite-difference time-domain (FDTD) based simulations suggest that a reflective (non-transmitting) cavity is an optimal choice in maximizing
  ,
,  ,
,  and especially
  . Our findings provide insights on designing low-Q all-metal FP microcavities for fluorescence spectroscopy.
2. Materials and methods
Planar metallic FP microcavities with different geometries were studied using TMM [21, 22] and FDTD [23, 24] simulations. The two silver (Ag) mirrors with thicknesses  and
and  , and a layer (thickness
  ) of poly-vinyl alcohol (PVA) embedded in between, form the cavity (see figure 1). PVA was chosen since it is a suitable polymer matrix for SR101 molecules. The cavity mode was always tuned to the absorption maximum of SR101 (576 nm) by varying
  . A thin PVA layer (30 nm) was also considered on top of the top Ag mirror as a protection layer, which prevents the oxidation of Ag in ambient condition in the case of real cavities. The glass (SiO2) substrate and the surrounding medium (air, refractive index is 1.0) were considered as semi-infinite. The material models for Ag, PVA and SiO2 were extracted from [25–27], respectively. The absorption and emission spectra of SR101 were taken from [28].
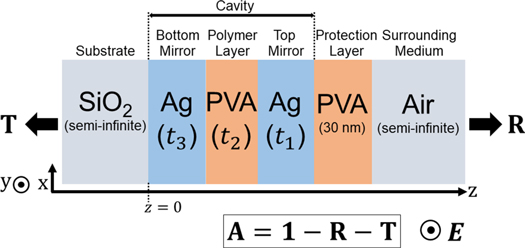
Figure 1. Schematic of FP microcavity.
Download figure:
Standard image High-resolution imageReflection, transmission and absorption ( ) of the modelled microcavities were calculated using TMM where
  The
The  values were calculated from the cavity absorption. Electric field distribution and mode volume in each cavity were computed using 3D-FDTD simulations where normal incidence of linearly polarized light with polarization defined in figure 1 was considered as an excitation. The entire radiation zone of the cavity mode, as illustrated by the white dotted boundary in the field-distribution plot shown in figure 2(a), was considered as
  in
in  calculation.
  were calculated as the average transmission of the top mirrors (
 ) within the SR101 emission (560–700 nm) as reported in figure 2(b). Spectral overlaps (
 and
and  ) were calculated as an integral of the common area (shaded yellow/magenta regions) under the cavity absorption (black) and the molecular absorption/emission (blue/red) curves for each cavity, as shown in figures 2(c), (d).
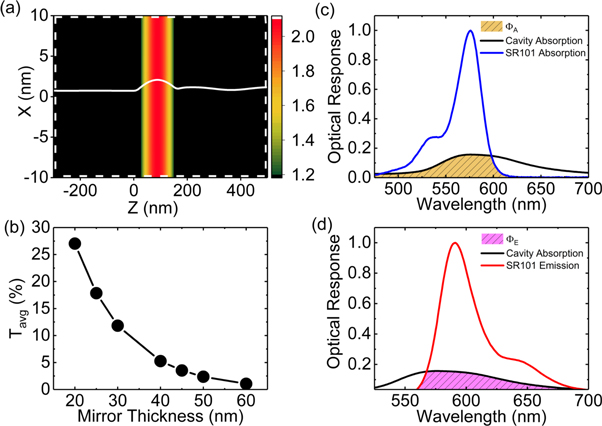
Figure 2. (a)  -field distribution in the microcavity. (b)
  as a function of top mirror (
 ) thickness. Spectral overlap of cavity absorption with (c) absorption and (d) emission of SR101. In (a), (c) and (d), the studied cavity is C1 (see table 1).
Download figure:
Standard image High-resolution image3. Results and discussions
In our first approach, we designed symmetric cavities where both mirrors had equal thicknesses. Five cavities (C1–C5) with increasing mirror thicknesses were considered with their geometrical parameters reported in table 1, while figures 3(a)–(c) show their  analysis. From figures 3(c), (d), it is clear that an increment in cavity mirror thickness makes the cavity absorption linewidth narrower, resulting a drastic fall in
  and
and  . However, it simultaneously improves cavity
 and
and  as shown in figures 3(e), (f). The cavity C5 (50 nm mirrors) provides highest
  but it yields poorest spectral overlaps and
  (see figure 2(b)). Consequently,
  drops at the highest
  .
.
Table 1. Geometries for symmetric microcavities.
| Cavity |

|
|---|---|
| C1 | 20/132/20 |
| C2 | 25/138/25 |
| C3 | 30/142/30 |
| C4 | 40/146/40 |
| C5 | 50/148/50 |
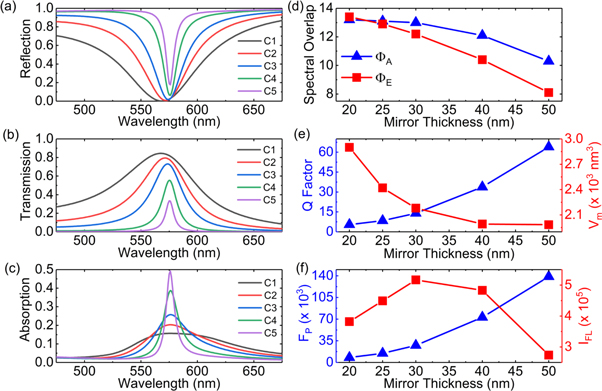
Figure 3. (a) Reflection, (b) Transmission, and (c) Absorption of the symmetric cavities. (d) Spectral overlaps, (e)  and
and  (f)
(f)  and
and  as a function of cavity mirror thickness.
Download figure:
Standard image High-resolution imageTo overcome this limitation we designed asymmetric cavities where we made one mirror thin (leaky) for fluorescence collection while keeping the other mirror thick. Five cavities (C6–C10) were considered with increasing  (
( ) with their geometrical parameters reported in table 2 and their
  analysis shown in figures 4(a)–(c).
Table 2. Geometries for asymmetric microcavities.
| Cavity |

|
|---|---|
| C6 | 60/146/30 |
| C7 | 45/145/30 |
| C8 | 30/145/45 |
| C9 | 30/145/60 |
| C10 | 30/145/90 |
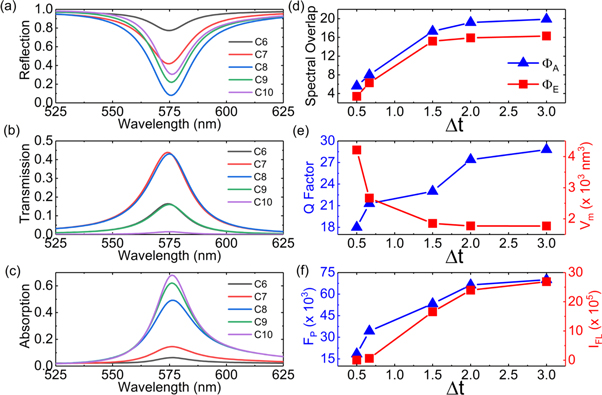
Figure 4. (a) Reflection, (b) Transmission, and (c) Absorption of the asymmetric cavities. (d) Spectral overlaps, (e)  and
and  (f)
(f)  and
and  as a function of
Download figure:
Standard image High-resolution imageFigures 4(c), (d) show that the cavities with thin top and thick bottom mirrors ( C8-C10) yield higher cavity absorption and spectral overlaps than the cavities with thick top and leaky bottom mirrors (
 C6-C7). An increment in
  improves cavity
 ,
,  and
and  as shown in figures 4(e), (f). The cavity C10 (
 ) provides highest
  ,
,  ,
,  and
and  . Moreover, the change in the cavity geometry from symmetric to asymmetric yields 7.54% drop in
  with 223.33% rise in
  on average. Therefore, by making a very thick bottom mirror with a thin top mirror, one can ensure a healthy trade-off between
  and
and 
Such findings motivated us to design a reflective (non-transmitting) cavity having a very thick bottom mirror and thin top mirror so that the cavity transmission becomes zero ( ) and the absorption becomes
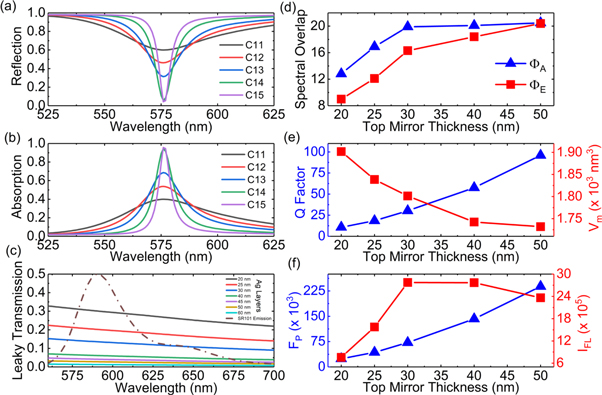
  Five reflective cavities (C11–C15) with increasing top mirror thickness were considered while the bottom mirror thickness was kept constant. Figures 5(a), (b) present their
  analysis with their geometries specified in table 3. Figure 5(c) depicts the leaky transmissivity of the top mirrors used for all the cavities. It was computed by considering an Ag layer between semi-infinite PVA and air. From C11 to C15, as the top mirror thickness is increased, the cavity absorption,
  and
and  are increased with a significant drop in the transmissivity of the top mirrors, as shown in figures 5(b)–(d). However, a simultaneous improvement in cavity
 and
and  is also observed as depicted in figures 5(e), (f).
Figure 5. (a) Reflection and (b) Absorption of the reflective cavities. (c) Transmission of leaky mirrors over SR101 emission. (d) Spectral overlaps, (e)  and
and  (f)
(f)  and
and  as a function of leaky mirror thickness.
Download figure:
Standard image High-resolution image
Table 3. Geometries for reflective microcavities.
| Cavity |

|
|---|---|
| C11 | 20/140/200 |
| C12 | 25/143/200 |
| C13 | 30/145/200 |
| C14 | 40/148/200 |
| C15 | 50/149/200 |
In a reflective cavity, due to the non-transmitting bottom mirror, the omnidirectional fluorescence emission can only exit through the thin top mirror. Therefore, a fall in the leaky mirror transmissivity, as shown in figure 5(c), directly results a drop in  at highest
  as shown in figure 5(f). Nevertheless, the change in the cavity geometry from symmetric to reflective results 98.55% rise in
  alongwith 386.56% rise in
  on average and clearly outperformed the asymmetric cavities. Therefore, we can conclude that of the cavities studied here, the reflective cavities, and more precisely C13 is the optimal choice for fluorescence spectroscopy of SR101, providing the best possible
4. Conclusions
We computationally investigated different geometries of a planar metallic FP microcavity tuned for the absorption of SR101. The cavities were modelled using TMM and FDTD simulations to optimize the Purcell factor, the spectral overlap between the cavity mode and the molecular responses, and the measurability of fluorescence. To quantify the total fluorescence measurability, we defined  , which takes into account all the above properties. However, we also analyzed the different properties separately since they can be important for other studies.
Our findings revealed that the symmetric cavities are limited in providing high Purcell enhancement along with an acceptable measurability of fluorescence. Asymmetric cavities can provide more efficient light-matter interaction while maintaining a pathway to collect the fluorescence through the leaky top mirror. Finally, we achieved an optimal design, i.e. a reflective cavity (C13) with 30 nm thin/leaky top mirror and 200 nm thick/non-transmitting bottom mirror, which provides high Purcell factor and spectral overlaps, and most importantly, the best  for fluorescence spectroscopy of SR101.
Acknowledgments
The authors gratefully acknowledge Academy of Finland (Projects: 323995, 289947) for the funding.
Data availability statement
The data that support the findings of this study are available upon reasonable request from the authors.