
Abstract
In this study we are presenting the synthesis of MnO2 nanorods using hydrothermal method assisted by facile tri-ethanolamine-ethoxylate. Structural (x-ray diffraction, Rietveld refinement), functional (Fourier Transform Infrared spectroscopy and x-ray Photoelectron Spectroscopy) and morphological (Field emission scanning electron microscope, Transmission electron microscopy) characterization conform the β-MnO2 nanostructure with a rod-like morphology and uniform thickness. The morphological variations of the nanorod thickness can be easily controlled by simply monitoring the reaction temperature. Comparative investigations of β-MnO2 samples synthesized at two different reaction temperatures (viz. 100 °C and 120 °C) used as a supercapacitive electrode material have been performed with the aid of different electrochemical techniques. With different electrolytes (Li2SO4 and Na2SO4), supercapacitor device is tested using Cyclic voltammetry, impedance spectroscopy and galvanostatic charge discharge. Interestingly, the low temperature synthesized β-MnO2 nanorods sample exhibit superior electrochemical performance in 1 mol l−1 Li2SO4 electrolyte in terms of high specific capacitance (462 Fg−1 at10 mVs−1), energy density (9.72 WhKg−1), and outstanding cyclic stability (90.26% over 2000 cycles).
Export citation and abstract BibTeX RIS

Original content from this work may be used under the terms of the Creative Commons Attribution 4.0 licence. Any further distribution of this work must maintain attribution to the author(s) and the title of the work, journal citation and DOI.
1. Introduction
Society is facing several problems among them one of the biggest problems is of energy crisis and storage of energy in small dimension. Energy storage components are effective solution of the said problem. Such components have their application in all electronic devices as laptops, mobile phones, smart watches etc. Engineers have challenge to produce energy storage components which must be small in size but its weight must be light. Due to high demand, it must be cost effective and environmentally friendly [1]. Electronic industry is extensively using conventional capacitors and batteries as energy storage devices in portable electronic devices and hybrid vehicles. Capacitor and batteries both are used equally according to energy demand due to their own merits however both devices need some improvement due to their demerits [2]. Power density and energy density are the two physical properties which decides the performance of device. Supercapacitor are getting its place in industry to having more power density than batteries. However batteries are still main component of industry due to having higher energy density than supercapacitors [3]. Recent electronic devices and electric vehicles demand high energy density with high power density, large shelf life, maximum efficiency, and low cost [4]. Amongst the various energy storage devices, recently, prototype supercapacitors have been developed by most of the research community as it has shown remarkable improvement in its performance. Compare to other energy storage devices, supercapacitors have more advantages such as higher energy density than conventional capacitors, higher power density than batteries, fast charge-discharge rates, long cycle and shelf life and low cost [5–7]. However, the possibility to enhance energy density is the major drawback of supercapacitors, especially for application in recent consumer electronic applications [3, 8]. According to electrode materials and reaction mechanisms for energy storage, supercapacitors are divided into three categories: pseudocapacitors, electric double layer supercapacitor (EDLCs) and hybrid capacitors [9]. The EDLCs employs carbon-based materials like graphene, single wall nanotubes, multiwall nanotubes, aerogel etc as electrode materials, and their principle of functioning is based on non-Faradaic energy storage [10]. Pseudocapacitors use transition metal oxides, transition metal hydroxides, transition metal sulphide and conducting polymers as electrode material and the energy storage mechanism is based on Faradaic oxidation-reduction [11]. However most of the time pseudocapacitance is present in EDLCs also due to presence of some active elements on the surface of carbon based electrode materials. Furthermore, hybrid capacitor is the superposition of EDLCs and pseudocapacitors [2, 4].
The performance of the supercapacitor (value of specific capacitance and energy density) is highly depends on the active material used in electrode [12]. The electrical conductivity, surface morphology, surface area, and porosity of the electrode material are important key parameters to monitor the value of specific capacitance and to enhance the energy density of supercapacitors [13]. Carbon and related materials used as electrodes in EDLCs have very high surface area, but poor electrical conductivity limits their application [14]. Whereas, the electrode materials used in pseudocapacitors, such as transition metal oxides, have many advantages over carbon material and many possibilities to improve electrical conductivity, surface morphology and surface area [11, 15]. Transition metal oxides have low cost, environmental in nature, provide high surface area, uniform porosity and are easy to synthesize [14, 16–18]. Now a day, transition metal oxides are widely accepted as electrode material for high energy density pseudocapacitor application [19]. Among different metal oxides which have been used as electrode material, still the RuO2 has reported to be the highly stable and best electrode material [20]. Its high cost hinders practical applications. To tackle this significant challenge, the scientific community has been continuously working to find low cost transition metal oxides. So far, among different metal oxides used for pseudocapacitor application, different crystalline structure of manganese based metal oxides (α-MnO2, β-MnO2 and γ-MnO2) are known to be the low cost, highly stable and most efficient substitute material for pseudocapacitor application [21–24]. In addition to this, manganese based metal oxides offer many attracting properties such as large structural diversity, environmental in nature, high electrochemical stability, and high theoretical capacitance (1370 Fg−1) [4, 14, 25]. However, the low energy density as result of low electrical conductivity bounds its practical applicability.
To address this practical problem, many systematic approaches have adapted by scientific community. A recent report have shown that MnO2 nanostructures (nanowires, nanorods, nanotubes, nanoparticles, porous nanoflakes) provide large accessible surface area to used electrolyte ions, short diffusion path for electrons/ions transfer, better stress/stain accommodations and enhanced electrochemical properties [18]. 1D MnO2 nanostructures can be synthesised by different synthesis methods such as chemical precipitation [26], electrochemical synthesis [27] and DC magnetron sputtering [28]. Such methodologies of synthesis are difficult to scale up and require sophisticated instrumentations. In this prospective, a low cost and easy scalable synthesis method of 1D nanostructures is highly desirable and represents a great challenge. Hydrothermal method is the one of the simple, cost effective, easy to scale-up synthesis method for fabricating nanomaterials with controlled shape and size [29–33]. Furthermore, the surfactant assisted hydrothermal synthesis approach is advantageous for fine tuning and morphology controlled synthesis of 1D nanostructures [34, 35]. Up to date, many surfactant such as cationic, anionic and neutral surfactants has been adopted in literature to improve specific surface area and surface morphology of the nanostructured material [4, 11, 15]. For example, Mehata et al reports the fivefold increase in surface area of mesoporous MnO2 by using a mixture of cationic and anionic surfactant [36]. Li et al [37] studied the preparation and comparative electrochemical performance of MnO2 synthesized via cetyltrimethylammonium bromide (CTAB) or cetyltrimethylammonium chloride (CTAC) mediated electrodeposition technique. Dubal et al [38] studied the synthesis of MnO2 thin films via electrodeposition in the presence of a neutral surfactant (Triton X-100) and reported higher specific capacitance of 345 Fg−1 at 5 mV s−1. MnO2 crystallography strongly affect the capacitive behaviour [39]. Liu et al [40] demonstrated micro/nano hollow urchin β-MnO2 formation via hydrothermal method in the short reaction time with higher lithium ion storage. Selim et al [41] prepared β-MnO2 single crystallites by thermal annealing of γ-MnOOH at 400 °C for 4 h, although γ-MnOOH was synthesis by hydrothermal method. Uke et al reported that triethanol amine ethoxylate surfactant helps to improve surface and porosity of NiCo2O4 synthesized by hydrothermal method [42].
Considering the advantages of surfactants and the needs of low cost and high energy storage supercapacitors, in this paper we have studied an easy method for synthesis of nanostructured β-MnO2 via tri-ethanolamine ethoxylate (TEA-EO) assisted hydrothermal route. The prepared β-MnO2 electrodes show excellent electrochemical performance in 1 mol l−1 Na2SO4 electrolyte and exhibit high specific capacitance, energy density and high rate capability.
1.1. Materials
Analytical grade reagents (KMnO4 and MnSO4·H2O) were purchased from Qualigen SD. Fine-Chem Ltd India. Tri-ethanol amine ethoxylate was purchased from Venus chemicals, Goa, India. Ethanol and double distilled water were used as a solvent for all the experiments. Graphite sheets (∼250 μm thick), was purchase from Nickunj Eximp Entp., India.
1.2. Synthesis of MnO2 nanostructures
Synthesis of hierarchical nanostructured MnO2 have been carried out by adding 2 g KMnO4 and 0.8g MnSO4·H2O in 50 ml double distilled water to a 5 ml solution of tri-ethanolamine ethoxylate(TEA-EO) under magnetic stirring. The obtained mixture was stirred magnetically at ambient temperature for 30 min to obtain homogenous mixture. Further the mixture was sifted to Teflon-lined stainless steel autoclave (capacity 250 ml). After sealing the autoclave properly it was heated at different temperatures for 12 h. The hydrothermal reaction temperature was conducted at 100 °C and 120 °C overnight to obtained two types of samples. After treatment autoclave was cooled up to room temperature to collect the prepared precipitate. Sample was collected using 4–5 times centrifugation (5000 rpm up to 5 min). It was washed with ethanol and using deionized water several times to maintain pH 7. Afterward, the synthesized precursors were calcined at 300 °C in the presence of air for 6 h to get the final product. Temperature was increased with scanning rate of 1 °C per min. The resulting samples synthesised at 100 °C and 120 °C are named S1 and S2, respectively.
1.3. Fabrication of the electrodes
Graphite sheet (area = 1 cm2) as current collector (substrate) was used to fabricate the working electrode was fabricated. In the whole process acetylene black worked as conducting agent and polyvinylidene fluoride (PVDF) worked as binder. The ratio of active material, conductive additive and binder was fixed as 90:5:5. To achieve the homogeneous mixture said materials were initially grinded in a mortar pestle. Obtained mixture was further dispersed in dimethyl formamide (DMF) forming a slurry, then coated on graphite sheet and dried at 60 °C. The weight of active mass loaded on the graphite electrode was measured by sensitive electrical balance. The deposited mass of β-MnO2 on the current collector was estimated using weight balance of least count 0.01 mg. In different electrodes the mass of β-MnO2 was found to be in the range of 0.8–1.1 mgcm−2.
2. Characterization
2.1. Structural and morphological characterizations
Elemental composition, crystal structure and surface morphologies, of as-synthesized β-MnO2 nano-rods samples were studied using transmission electron microscope (FEI TECNAI G2), x-ray diffractometry (Bruker AXS, D8 advance) operating at 20 kV and 40 mA with CuKa radiation (λ = 1.5418 Å) and field emission scanning electron microscopy (Carl Zeiss, Ultra plus). A detailed study of the β-MnO2 structure of samples synthesized at 100 °C and 120 °C was obtained by Rietveld refinement at 2θ (5°–95°) with slow scan rate (0.01880°) on 4788 points. Both the sample's data were refined by the same file available at Crystallography Open Database (COD-9009081). The simulated pattern was done by use of FULLPROF program. X-ray Photoelectron Spectroscopy measurements were performed using XPS analyser (Perkin Elmer model 1257), while FT-IR data obtained by FT-IR analyser (Nicolet NEXUS Aligent 1100).
2.2. Electrochemical characterization
Electrochemical workstation (CHI 680) was used to carry out electrochemical studies. For carrying out cyclic voltammetry three electrode system was adopted. Prepared electrode material was used as working electrode and Ag/AgCl was used as a reference electrode. For aqueous system most popular counter electrode is platinum which is chosen as counter electrode in present study also. Electrochemical studies were performed using 1 mol l−1 Li2SO4 and 1 mol l−1 Na2SO4 electrolyte with said electrode system within the potential window 0 V–0.8 V. Impedance spectroscopic studies was carried out within the frequency range 1 Hz to 100 kHz at open circuit potential and 5 mV AC perturbation.
For the developed prototype supercapacitor device, the values of specific capacitance (Cs) (Fg−1), energy density E (WhKg−1), power density P (kW kg−1) and coulomb efficiency (η) (retention capacity) were calculated by using equations (1)–(4), respectively [2].


where m is the mass of electrode material deposited over graphite sheet (gcm–1), I(v) (mA) is the response current per unit area of the MnO2 electrode. V is known as scan rate and (Vc − Va ) is measured in (V) is called the operational potential window. Id and td is known as discharge current and discharge time respectively however Va and Vc are known as anodic current and cathodic current respectively.
3. Results and discussions
3.1. X-ray diffraction (XRD)
Phase and purity of synthesized β-MnO2 samples S1 and S2 were analysed by x-ray diffractometry. Figure 1(a) depicts the XRD pattern of both the samples in the 2θ range of 20° to 80°. As shown in figures 2(a) and (b), the resulting XRD pattern is well fitted by Rietveld refinement analysis with space group P42/mnm [43]. XRD patterns of both the samples show intense diffraction peaks. The characteristic peaks at 28.696°, 37.389°, 42.852°, 56.710°, 59.423°, 64.924° and 72.486° are assigned to (110), (101), (111), (211), (220), (002) and (112) planes of β-MnO2 with lattice dimensions a = b = 4.3985Å and c = 2.8701Å [44]. Obtained spectral data are compared with JCPDS data file no. 81-2261. The high intense peaks in XRD patterns reveal the formation of high crystalline nanostructure. The arrangement of atoms in the crystal structure of sample S1 was confirmed by the models as depicts by figures 2(c) and (d), which clearly confirm that as-synthesized β-MnO2 materials have a tetragonal crystal structure [45].
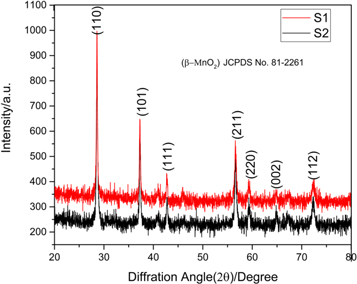
Figure 1. XRD Pattern of β-MnO2 samples (S1 & S2).
Download figure:
Standard image High-resolution image
Figure 2. (a) and (b) Rietveld refinement of sample S1 & S2, (c) side view and (d) tetragonal crystal structure of β-MnO2 (sample S1).
Download figure:
Standard image High-resolution image3.2. X-ray photoelectron spectroscopy (XPS)
Bond bonding and oxidation states of β-MnO2 samples were investigated using XPS measurements. Figure 3(a) shows the survey scan of XPS spectrum relating to β-MnO2 prepared at 100 °C in a wide range of binding energy (0–1100 eV). The spectrum revealed the typical characteristic peaks of Mn2p, C1s and O1s. In full XPS scan no impurity peaks are founds, which revels high compositional purity of prepared sample. Further, in this spectrum, the C1s peak is relatively intense and probably arises from the existence of carbon in atmosphere of analyser, which has a fix binding energy (B.E) (284.8 eV) and used to calibrate the whole spectra. However, the core level spectra of Mn2p and O1s were also acquired in a confined range as depicted in figures 3(b) and (c). The spin–orbit doublet peak was observed in core level Mn2p spectra as shown in figure 3(b) at B.E of 642.2 eV & 653.9 eV, corresponding to Mn2+, Mn3+ and Mn4+ oxidation states of Mn2p3/2 and Mn2p1/2core levels, respectively. The four-valent manganese (Mn+4) is present in the prepared sample is confirmed by the above results [46]. The characteristic core level XPS spectra of O1s was also acquired and depicted in figure 3(c). This core level HR-XPS spectrum is broad and deconvoluted into four sub peaks positioned at 527.75 eV, 527.98 eV, 528.35 eV and 529.67 eV corresponding to various oxidation state of oxygen, endorsing the formation of Mn–O, OH, C–O & C=O groups, respectively. To the end, XPS results revealed that the prepared sample has a less oxygen deficient area, which would be accountable for good electrochemical activities. Figure 3(d) depict the Raman spectra of investigated β-MnO2 sample synthesis at 100 °C in frequency region 200 to 1000 cm−1. Three bands are recognised at 538, 651 & 758 cm−1 as fundamental modes of tetragonal β-MnO2 and agrees with the literature [47, 48]. The peak of stretching mode vibrations of Mn–O is observed at 651 cm−1. Nevertheless, the two peaks located at 538 and 758 cm−1 can be assigned to the deformation modes of the metal-oxygen chain of Mn–O–Mn in the MnO2 octahedral lattice [49, 50].
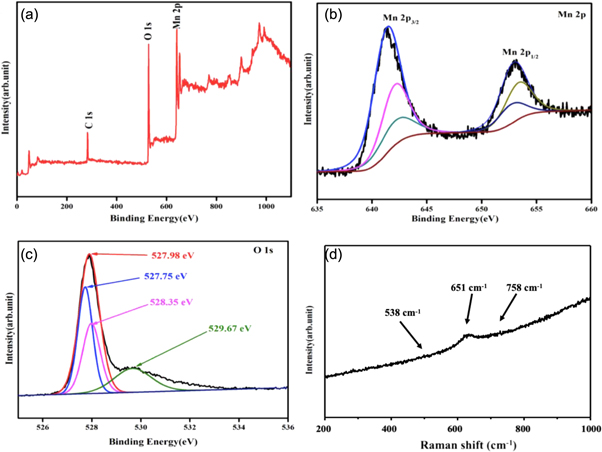
Figure 3. XPS and Raman spectra of sample S1 (a) Full scan XPS spectra, (b) XPS-Mn2p, (c) XPS-O1s spectra, and (d) Raman spectrum of β-MnO2 nanorods (sample S1).
Download figure:
Standard image High-resolution image3.3. Field emission scanning electron microscope (FESEM)
The FESEM images of synthesized samples S1 and S2 are shown in figures 4(a), (b) and (d), (e), respectively. The rod-like structure of both the samples can be seen clearly. The average length and diameter of nanorods of sample S1 is 200–500 nm and 20–50 nm respectively. Nanorods of sample S2 show lower diameters. Further, EDX spectra of the as-synthesized samples S1&S2 are shown in figures 4(c) and (f). This results show the elements of manganese and oxygen are uniformly distributed in the samples.
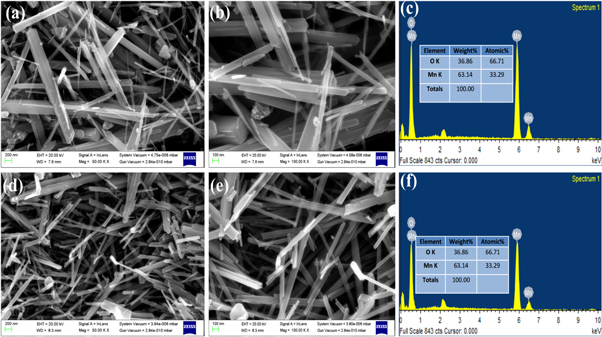
Figure 4. (a), (b) FE-SEM images of sample S1, (c) EDX spectra of sample S1, (d), (e) FE-SEM images of sample S2, and (f) EDX spectra of sample S2.
Download figure:
Standard image High-resolution image3.4. Transmission electron microscopy (TEM) analysis
Further investigations of sample S1 nanostructures were analysed by TEM. TEM images of figures 5(a) and (b) reveal the smooth surfaces with uniform diameters of nanorods. Additionally, there is not any noticeable dislocation or defect in the nanorods. Moreover, the high resolution TEM image shown in figures 5(c) and (d)) display the lattice fringes with 3.12 Å & 2.406 Å the d-spacing corresponding to (110) and (101) crystal planes β-MnO2 in the SAED pattern [51]. The lattice fringes indicate the (110) growth direction and high purity of as-synthesized nanorods relating to the separation with neighbouring lattices due to (101) crystal plane. A single nanorod is demonstrated with its growth direction and dominant crystal fact in figure 5(e). This result anticipates the improvement in employment ratio of MnO2 electrode for better electrochemical behaviour facile to deintercalation [52, 53].
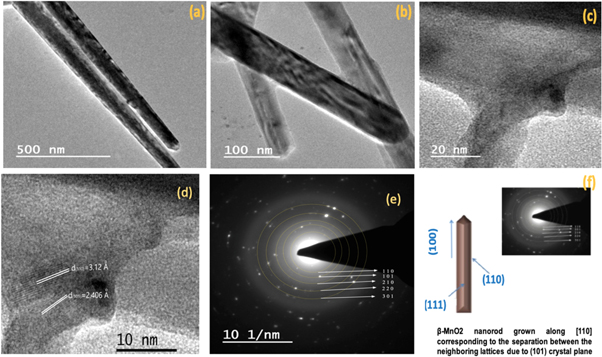
Figure 5. (a) and (b) TEM image, (c) and (d) HR-TEM image (e) SAED pattern, (f) A schematic of a single nanorod with its growth direction and crystal facets.
Download figure:
Standard image High-resolution image3.5. Fourier transform infrared spectroscopy (FTIR)analysis
To characterize the functionality of as-synthesized nanostructured β-MnO2 samples, FTIR analysis was illustrated and performed in figure 6. As from the FTIR spectrum, the main absorption bands were found at 3431.2, 2931.4, 1631.2, 1385.1, 1118.8 and 707.1 cm−1. The absorption peaks 3431.2 cm−1 represents O–H stretching of water molecules and 2931.4 cm−1 corresponds to C–H stretching in residual TEA–ethoxylate that may be present [52]. The absorption peak at 1631.2 cm−1 was assigned to O–H group binding vibration [53]. The principle bonds at 1118.8 and 1385 cm−1 are due to C=O and C=C stretching [54]. The main absorption characteristic peaks at 529.2 cm−1, which is corresponds to Mn–O stretching modes of the octahedral layers in the β-MnO2 nanostructure [55].
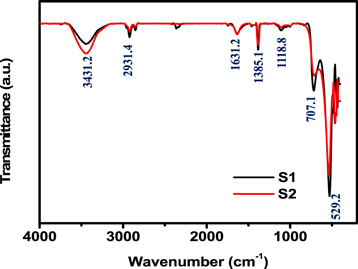
Figure 6. Fourier Transform Infrared spectroscopy (FTIR) of MnO2 samples (S1 and S2).
Download figure:
Standard image High-resolution image3.6. Electrochemical characterization
The electrochemical (EC) study of as fabricated β-MnO2 electrodes is carried out by three electrode arrangement, in this arrangement β-MnO2 as working electrode, platinum as counter electrode & Ag/AgCl as reference electrode has been used. In this study, we have compared the electrochemical behaviour of β-MnO2 electrodes in two different electrolytes, namely 1M L−1 Li2SO4 and 1 M L−1 Na2SO4, within the voltage window 0 V to 0.8 V. During electrochemical analysis the manganese oxide electrodes undergo reversible transformation between Mn3+ to Mn2+ found to stable in this particular range of potentials [56]. To provide excellent electrochemical performance, the selection of a suitable electrolyte for a supercapacitor device is a very important step. For manganese-based electrode supercapacitors H2SO4, Na2SO4, KCl, KOH, K2SO4, LiSO4 electrolytes are commonly used [11, 57]. Considering the migration speed of hydrated ions in electrode's inner pores and in bulk of electrolyte, Na2SO4, and Li2SO4 liquid solution are found to be more suitable electrolytes for β-MnO2 electrode [58, 59]. Thus we have recorded cyclic voltammeter (CV) curves of electrodes S1 and S2 in Na2SO4 & Li2SO4 electrolytes at scan rate (10 mVcm−2) and constant electrolyte concentration (1 ML−1) (figures 7(a) and (b)). We observed that both the electrodes show the best electrochemical performance in Li2SO4 than Na2SO4. Previous reports also suggested that the electrolyte Li2SO4 is best suited for MnO2 [60–62]. Hence, further electrochemical analysis of β-MnO2 electrodes S1 and S2 have been analysed in (1M L−1) Li2SO4.
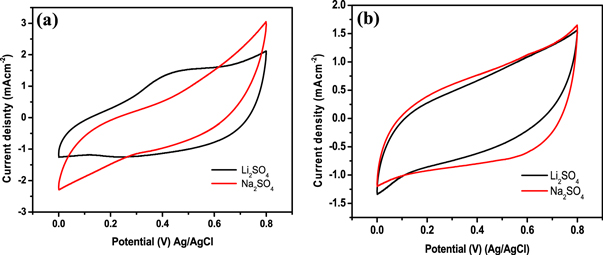
Figure 7. Cyclic voltammetry (CV) curves of electrode (a) S1 working electrode and (b) S2 working electrode.
Download figure:
Standard image High-resolution imageCV curves of β-MnO2 nanostructured S1 and S2 electrodes in 1 mol l−1 Li2SO4 electrolyte at scan rates 10, 20, 50 and 100 mVcm−2 are represented in figures 8(a) and (b), respectively. It shows nearly rectangular shape CV curve at higher and lower scan with broad peak in the cathodic and anodic direction. The rectangular CV curve conforms the formation of electric double layer and resulting capacitance via non-faradaic mechanics. This is formed due to surface absorption of electrolyte cations (Li+ or Na+) on nanostructured β-MnO2 electrode, as demonstrated by the reaction (5) [56, 63, 64]. Furthermore, the broad peak in the anodic and cathodic direction of the CV reveals the oxidation and reduction reaction of MnO2 surface. Such redox reaction occurs at β-MnO2 electrode due to the intercalation of cations from the electrolyte (Li+ or Na+) via reduction and de-intercalation upon oxidation (reaction (6)). The capacitance results via redox reaction at β-MnO2 electrode and has a pseudocapacitive nature [56]. Hence, as-synthesised β-MnO2 electrodes demonstrates a mixed behaviour of the ideal pseudocapacitive behaviour EDLCs [8, 65].


By CV curve, the obtained specific capacitance (Cs) from equation (1) at different scan rates is shown in table 1. The highest Cs for sample S1 and S2 is found to be 462 and 289 Fg−1, respectively in 1M Li2SO4. The high Cs provided by electrode S1 can be due to 1D nanostructure, mesoporous of structure and high surface area of β-MnO2. The CV curves of sample S1 and S1 is given in figures 8(c) and (d) for electrolyte Li2SO4 respectively.
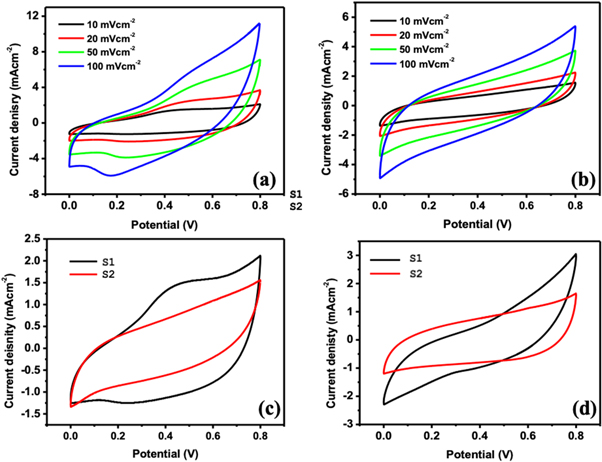
Figure 8. (a) CV curves (a) S1 working electrode, (b) S2 working electrode; comparative CV of working S2 and S2 electrode in (c) In 1M L−1 Li2SO4 and (d) 1M L−1 Na2SO4.
Download figure:
Standard image High-resolution imageTable 1. Specific capacitance obtained for sample S1 and S2 in 1M L−1 Li2SO4 electrolyte.
| Specific capacitance (Fg−1) of Sample's | ||
|---|---|---|
| Scan rate | S1 | S2 |
| 10 mVcm−2 | 462 | 289 |
| 20 mVcm−2 | 364 | 203 |
| 50 mVcm−2 | 239 | 126 |
| 100 mVcm−2 | 160 | 89.4 |
The obtained values of specific capacitance higher as previously reported data relating to β-MnO2 pseudocapacitors (table 2). Samal et al observed a capacitive behavior of layered δ-MnO2 which shown the specific capacitance 518 Fg−1 at 3 Ag−1 in a 3M KOH with a cyclic stability of 83.95% after 2000 cycles [66]. The present study found higher cyclic stability as discussed in recent literature in table 2. Punnusamy et al synthesized polymorphs MnO2 of different 2 × 2, 1 × 1 tunnel structure and simulated by DFT to confirm higher B.E [67]
Table 2. Comparison Cs values with previous reported in for MnO2 nanostructure electrodes.
| Sr no | Synthesis method | Electrolyte | Morphology | Specific capacitance (Fg−1) | Scan rate (Ag−1) | Cyclic stability | References |
|---|---|---|---|---|---|---|---|
| 1 | TEA assisted hydrothermal | 1M Li2SO4 | Rod-like | 462 | 10 mVcm−2 | 90.26@ 2000 | In present study |
| 2 | Hydrothermal | 1M Na2SO4 | Nano rod with a distinct plate-like | 168 | 5 mVs−1 | — | [64] |
| 3 | Hydrothermal | 3M KOH | Nanoflakes | 518 | 3l | 83.95 @ 2000 | [66] |
| 4 | Hydrothermal | 1M Na2SO4 | Nano-sheets | 411 | 5 mVs−1 | [68] | |
| 5 | Hydrothermal | 1M Na2SO4 | Bowl-like nano-sheets | 379 | 0.5 | 87.3@ 5000 | [69] |
| 6 | Hydrothermal | 1M Na2SO4 | — | 260.5 | 0.3 | 94.7@ 3000 | [70] |
| 7 | Hydrothermal | 1M Na2SO4 | Hollow Nano-fibre | 291 | 1 | 90.90@ 5000 | [71] |
| 8 | Hydrothermal | 1M Na2SO4 | Micro-flowers | 185 | 0.5 | 85% 10000 | [72] |
| 9 | Hydrothermal | 1M Na2SO4 | Nanorods | 311.52 | 0.3 | — | [16] |
| 10 | Hydrothermal | 1M Na2SO4 | — | 321 | 5 | — | [73] |
GCD analysis of β-MnO2 electrodes S1 and S2 was performed in 1M L−1 Li2SO4 electrolyte at constant current density of 50 mAcm−2. Figures 9(a) and (b) represents the GCD curves of sample S1 & S2 in 1 mol L−1 Li2SO4 and Na2SO4 electrolytes. The resulting curves were attributed to redox reactions. As in figures 9(a) and (b) the triangular shape of charge discharge curves reveals the ideal supercapacitive behavior of β-MnO2 electrode, whereas the similarity between charging and discharging curves indicates a low IR drop (i.e. high electrical conductivity) [74]. More specifically, the outline of the GCD curve is nearly symmetrical for both the samples, revealing the faradaic and as well as the pseudocapacitive charge storage behaviour with high redox reversibility within the potential window [1]. From GCD curves the maximum specific capacitance for electrodes S1 and S2 was found to be 437.5 Fg−1 and 278.1 Fg−1 at 50 mAcm−2 current density respectively. The obtained Cs by GCD is resembled with the results of CV measurements. Furthermore, the maximum energy density of sample S1 and S2 was found to be 9.72 and 6.18 W h kg−1, respectively at a power density of 25 kWkg−1. To assess the rate capability of β-MnO2electrodes, CV analysis of β-MnO2 electrodes (S1 and S2) was performed at higher scan rates. Figure 9(c) represents Cs of β-MnO2 electrodes S1 and S2 at various scan by CV. The shape of all the CV performance is preserved from lower to higher scan rate, demonstrating the ideal pseudocapacitive behaviour as well as superior rate capability of as-fabricated β-MnO2 electrodes [1]. As shown in figure 9(c), the Cs of the as fabricated electrodes decreases at scan rate increase. Such decrease in Cs is due to the incomplete redox transition at the inner active sites at higher scan rates [42]. Figure 9(d) demonstrated the variation of capacitance retention over the cycle number at a scan rate of 100 mVcm−2. For β-MnO2 S1 electrodes the retention of Cs was found out to be 90.26% over 2000 CV cycles.
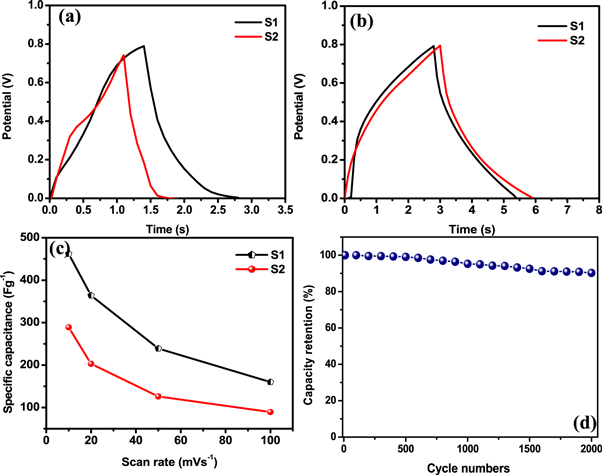
Figure 9. GCD curves of S1 and S2 working electrode (a) in 1 M L−1 Li2SO4 liquid electrolyte and (b) in 1 M L−1 Na2SO4 liquid electrolyte. (c) Comparison of specific capacitance of sample S1 and S2 (d) Variation of capacitance retention over 2000 cycle in Na2So4.
Download figure:
Standard image High-resolution imageAfter the electrochemical measurement the electrode (S1) is again characterized by XPS. The different spectrum given in figures 10(a)–(f) for reduced and oxidation MnO2 electrodes presents Mn 2p at 642, and O 1s at 530 eV. The C 1s at 285 eV, S 2p at 164 eV and Na 1s at 1171.6 eV are associated due to presence of carbon, graphite sheet, and Na2So4 electrolyte. Raman spectrum is also described after electrochemical measurements of electrode (S1) as in figure 10(g) in the frequency range 400 to 900 cm−1. The Mn–O vibration starching mode is found as the main Mn peak at 635 cm−1. Two more peaks are also found at 576 and 760 cm−1 which can be attributed to Mn–O–Mn in the MnO2 octahedral lattice that deformate the modes of the Mn–O chain.
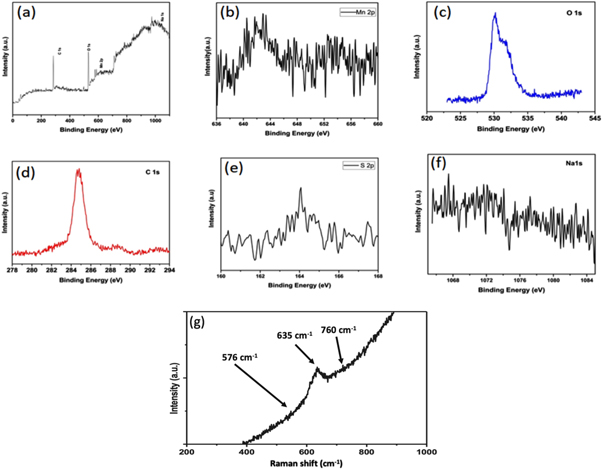
Figure 10. XPS and Raman survey of MnO2 electrode after 2000 charge discharge cycle, (a) Survey scan (0 to 1100 eV), (b) Mn2p, (c) O1s, (d) C1s, (e) S2p, (f) Na 1s, (g) Raman spectra with in the frequency range 400 to 900 cm−1.
Download figure:
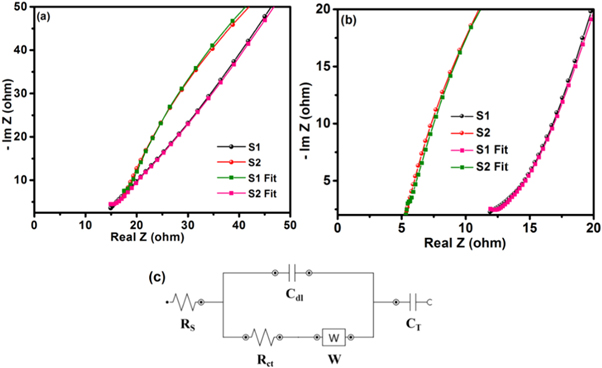
Standard image High-resolution imageNyquist plots (NP) relating to the electrodes S1 and S2 in1ML−1 Na2SO4 and 1ML−1 Li2SO4 electrolytes are shown in figures 11(a) and (b), respectively. In general, a NP is separated into low & high frequency regions. The low and high frequency region are corresponds to capacitive behaviour and charge transfer resistance respectively. Figure 11(a) presents the Nyquist plot relating to the electrodes (S1 and S2). The intercept of NP on the x-axis gives equivalent series resistance (Rs), which is due to the contact resistance of the active material and the current collector, the intrinsic resistance of the active material and electrolyte [75]. The values for each component obtained by the equivalent fitting method are given in table 3. From Nyquist plot, the equivalent series resistance (Rs) for three electrodes cell comprising sample S1 and S2 are found out to be 5.4 Ω and 11.9 Ω in Li2SO4 electrolyte, and 12.12 Ω and 15.25 Ω in Na2SO4 electrolyte, respectively.
Figure 11. Nyquist plots of sample electrodes (S1 & S2) in (a) 1M L−1 Na2SO4 electrolyte and (b) 1M L−1 Li2SO4 electrolyte, (c) Equivalent circuit.
Download figure:
Standard image High-resolution image
Table 3. Fitting results from equivalent circuit of sample S1 and S2 EIS data.
| 1M Na2SO4 | 1M Li2SO4 | |||
|---|---|---|---|---|
| Parameters | S1 | S2 | S1 | S2 |
| RS (Ω) | 12.12 | 15.25 | 5.4 | 11.9 |
| Rct ( Ω ) | 20.14 | 44.50 | 7.6 | 19.12 |
| Cdl (μF) | 49.00 | 24.48 | 25.21 | 38.46 |
| W (mMho) | 61.8 | 23.2 | 41.02 | 1.4 |
| CT (μF) | 52.3 | 32.6 | 17.6 | 69.9 |
4. Conclusions
In summary, β-MnO2nanorods were synthesized by TEA-ethoxylate hydrothermal method at reaction temperatures of 100 °C and 120 °C. All structural parameters (bond length, bond angle, cell parameters and density of compound) demonstrated by XRD and Rietveld refinement are not affected by the synthesis temperature, unlike the morphology features revealed by SEM. By increasing the reaction temperature from 100 °C to 120 °C the surface morphology of manganese oxide changes from thick and short to thin and long rod-like nanostructures. As expected, β-MnO2 nanorods analysed as supercapacitor electrode gives high specific capacitance of 462 and 289 Fg−1 at scan rate 10 mVcm−2 in 1M L−1 Li2SO4 aqueous electrolyte for S1 & S2 samples, respectively. The best performance of S1 sample can be due to large surface area (larger size nanorods) available for charge-storage and for redox-reactions (pseudocapacitive charge-storage) and it is competitive with respect to recently literature data on MnO2 nanostructured electrodes.
Acknowledgments
The authors acknowledge the financial support received from the Science and Engineering Research Board (SERB), Department of Science and Technology, Government of India (sanction no. ECR/2016/001871) under the scheme Early Career Research Award.
Data availability statement
No new data were created or analysed in this study.