

Abstract
Nanocrystals of  were produced during the process of combustion of the glycine-nitrate with precursors together with an excess amount of the oxidizing agent. X-ray diffraction patterns and Raman spectra were measured for investigation of the structure of the synthesized material. Hidden periodicities were extracted in the Raman spectra, using the example of two compounds with x = 0 and x = 0.2, correspondingly. In comparison with theory, the analysis showed that the distribution of the inverse periods revealed from the experiment results in the appearance of two narrow peaks common for both samples with maximums 0.014 and 0.01 cm (70 and 100 cm−1). The discovered effect is analyzed with the model of a combination of Raman- active oscillations from the nanoscale inelastic light scatterers with different shapes.
Export citation and abstract BibTeX RIS

Original content from this work may be used under the terms of the Creative Commons Attribution 4.0 licence. Any further distribution of this work must maintain attribution to the author(s) and the title of the work, journal citation and DOI.
1. Introduction
It is very well known that rare earth orthoferrites themselves attract particular attention because of their 'multiferroic' properties [1]. They may be implemented in spintronics and data storage devices, including devices with high-speed memory with magnetically-electrically addressable states and magnetically adjustable switches and sensors. Quite recently, the method of synthesis of nanoclusters of these compounds by combustion has become widespread. Using this method, several compounds were synthesized. Among them, NdFeO3 is known to have an orthorhombically distorted perovskite structure [2, 3]. X-ray diffraction pattern analysis showed that this material represents itself as an ensemble of almost spherical nanoclusters whose sizes are statistically distributed [2]. It is well known that the size distribution of the nanoclusters governs their magnetic energy which in turn controls the switching temperature of the superparamagnetic state of the ensemble. Also, over recent years, bismuth ferrite BiFeO3 was one of the most studied multiferroics systems with a large number of published articles as BiFeO3 has the unique nature of having both (anti) ferromagnetic and ferroelectric properties, observed at room temperature [4–6]. Thus, the primary motivation of the present study was to synthesize a more complex material allowing investigation of new properties by variation of the chemical composition of the nanoclusters. That is  compounds were produced by a nitrate-glycine combustion method.
Combustion being a promising method for the synthesis of nanoparticles produces a lot of different amorphous and crystalline phases. And some of them might be difficult for identification by analysis of conventional x-ray diffraction patterns because of the tiny sizes of the produced nanoparticles. As a result, the x-ray diffraction patterns of such objects can be smeared enough and unsuitable for identification. Moreover, for the case, such ceramic samples as  perovskites, the application of the electron microscopy methods meets obstacles due to problems with the influence of the charging of an investigating substance to the quality of the images. Usage of metal deposition over ceramics aiming to improve the quality, in some cases creates additional artefacts, associated with metal clustering. In this connection, today, the value, functionality and benefits offered by and Raman spectroscopy techniques are largely uncontested. Taking into account all of the techniques, virtually any form of a sample can be handle, including powders. These techniques allow studying the structure of matter on the scale of short- mid and long-range orders. In this paper, we used combustion for perovskite nanoclusters as a method of synthesis and rely upon Raman spectroscopy as a basis of analysis for characterization of the synthesized material.
2. Experiment
2.1. Preparation of samples
 (0 ≤ x ≤) nanocrystals were prepared by the glycine-nitrate combustion method and similar to the recipe reported in [2, 4, 5]. As starting materials
  (chemical pure),
  (chemical pure),
  (analytical pure) in stoichiometric amounts and
  (chemically pure) were used. It was found [4] that the condition for obtaining single-phase
  nanocrystals over the entire concentration range under consideration is through the combustion synthesis process of the glycine-nitrate with an excess of the oxidizing agent. In this case, the formation of
  nanocrystals occurs without crystallization of intermediate combustion products. To remove carbon, additional annealing was carried out in a muffle furnace at 600 °C, for 2 h. Compositions were analyzed by scanning electron microscopy (SEM) and energy dispersive x-Ray spectroscopy (EDS) using a Quanta 200 device equipped with x-ray microanalyser. crystallization of intermediate combustion products. To remove carbon, additional annealing was carried out in a muffle furnace at 600 °C, for 2 h. dispersive x-Ray spectroscopy (EDS) using a Quanta 200 device equipped with x-ray microanalyser.
2.2. Structural study
In the structural study for the as-obtained substance, x-ray diffraction patterns were measured by a Shimadzu XRD-7000 instrument with monochromatic CuKα radiation with wavelength λ = 1.54186 Å. The resulting XRD patterns are presented in figure 1. Comparison of the positions of the maximums in the figure with the PDF-2—ICDD software database, allowed us to conclude that grains of materials with the desirable chemical compositions were formed. Figure 2 shows a fragment of the diffraction pattern. Also there, is presented the result of the Lorentzian (Cauchy) fit. This fit allowed us to estimate the line width at the half of the peak height and using the Scherrer formula, the perovskite nanocrystal size that occurred was found to be approximately 35 nm. A similar analysis of the rest of the patterns allowed us to conclude that under conditions of glycine-nitrate combustion,  were synthesized nanocrystals with a crystallite size of approximately 30–60 nm.
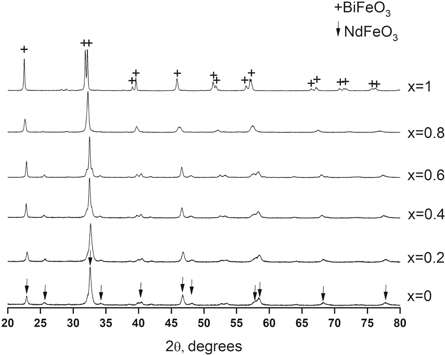
Figure 1. X-ray diffraction patterns for nanoclusters of  solid solutions produced in this paper by the combustion method. For the identification we exploded data from the following cards from PDF-2—ICDD software package: Card 01-075-8562 for x = 0: Nd Fe O3 (depicted by arrows) and Card 01-077-4901 for x = 1: BiFe O3 (depicted by crosses).
Download figure:
Standard image High-resolution image
Figure 2. Fragment of x-ray diffraction patterns for nanoclusters of BiFeO3 solid solutions produced in this paper by the combustion method. Also fit by Cauchy function is presented by the red full curve.
Download figure:
Standard image High-resolution image2.3. Raman spectroscopy
For the investigation of the particle's structure, we performed a Raman study. Detection of the spectra was carried out using a Horiba Jobin Yvon LabRam HR800 Raman spectrometer powered with a Torus 532 nm laser with 50 mW beam power. The spectra were measured 15 times, for 15 seconds each; no attenuator was applied. A sequence of Raman bands was observed, as figure 3 shows.

Figure 3. Raman spectrum of the substance containing nanoclusters of  solid solutions produced in this paper by the combustion method.
Download figure:
Standard image High-resolution image3. Results and discussions
Typical Raman spectra are shown in figure 3 as a function of x and an enlarged one, selected for x = 0.2 is depicted in figure 4. Note than no bands are seen that might be associated with carbon substances, e.g. G and D bands that are typical for fragments of graphene or amorphous carbon. However one may see sets of almost equidistant peaks for all spectra shown in figure 3, in the frequency range 100–700 cm−1. Sites above the spectrum on figure 4, where one may expect the peaks to be, are marked by the crosses. Interestingly we observed a very similar result in paper [7] for iron nanoclusters embedded in amorphous carbon. There we explained the appearance of equidistant peaks by considering the idea of the formation of short nanotubes in the course of crystallization of the nanometer-sized iron clusters. We noticed that there was a linear relationship between every peak maximum seen in the experimental Raman spectrum with the corresponding eigenfrequency for the calculated data for the short nanotubes presented in [8].

Figure 4. Typical fragment of Raman spectrum of the substance containing nanoclusters of  (x = 0.2) solid solutions produced in this paper by the combustion method.
Download figure:
Standard image High-resolution imageThe origin of this effect might be associated with the linear dispersion law for the acoustic branch of the phonons for carbon nanotubes for the case when acoustic phonons undergo confinement. There we exploited the following model explaining the nanotube formation through the nucleation of core–shell nanoclusters proposed in paper [9].
In [9] it was also stated that the first step of the process is the formation of a liquid nanodrop of the material supersaturated with carbon. The first step of the process is the formation of a liquid nanoparticle of metal supersaturated with carbon (figure 3). These nanoparticles originate from vapor condensation in the moderate temperature zone of the combustion process. If in the case of the current work carbon nanotubes appear, we might repeat the scenario described below of the nucleation of nanotubes above the surface of the perovskite grain. Actually, during the synthesis, the liquid nanoparticle of the perovskite precursor might be capable of incorporating carbon into the liquid drop of the perovskite precursor. Upon cooling, the solubility limit of carbon decreases and therefore carbon atoms start to segregate towards the surface. This effect increases when the temperature decreases attaining its maximum close to the solidification point, i.e., at temperatures about ∼1500 K (for the perovskite nucleation temperature value, see e.g. [2]). At this stage, there might be a competition between the formation of a graphitic sheet forming an onion-like shell or the nucleation of single-wall nanotubes. In our case, the second opportunity might be realized when carbon nanotubes are formed and located near the surface of the drop. We would like to note that in [7] we observed the distance between the peaks to be about 100 cm−1. This gap in our current work, however, has a value of approximately 70 cm−1. However, here, we annealed in a muffle furnace to remove carbon from the perovskite containing substance. We would like to emphasise that the absence of D and G bands in figure 3 also supports the hypothesis of a lack of carbon in the samples.
Actually, it is known that the presence in Raman spectra of D bands (1320 to 1360 cm−1) and G bands (1320 to 1360 cm−1) are typical signs of the existence of either amorphous carbon (see, e.g. [10]) or fragments of graphene planes. As one may see in figure 3, no D bands are visible there. Thus annealing the samples in a muffle furnace for two hours, results, as one may expect, in total carbon burnout so that there are no significant amounts of the carbon in the substance under investigation. Note, the formation of perovskite analogues of tubes which we will term as whiskers, growing in a peripheral area of a sphere, was reported in paper [11] where species of clusters were observed resembling sea anemones. The growth mechanism of perovskite vapour-liquid-crystal whiskers can work in our case as well. That is, in the process of crystal growth during combustion due to adsorption of material from the gas phase, the liquid of the droplet becomes supersaturated near the surface of the droplet and crystallization occurs on the surface under the droplet. For a deeper insight into this problem, we will take two spectra from figure 3 for x = 0 and x = 0.2, and plot them in figure 5. To study the spectroscopic consequences of the effect of the possible formation of nanowhiskers, consider these two spectra in more details. To this end, first, we investigate line shape profile of the Raman band ∼430 cm−1 (see figure 5). Namely, this particular band was chosen for analysis, because its position in the spectrum slightly differs from the tabulated positions of Raman bands presented in the paper and references therein [12]. And, therefore, because of this difference, one might expect a maximal mutual influence to the line shape of the acoustic phonons and complex Raman vibrations taking place in a whisker. Figure 6 shows the example of fitting of this band taken for x = 0.2, where this band looks most prominent, with symmetric (Lorentzian) and asymmetric (Fano) line shape contours. We exploited the following Fano equation:


Figure 5. Two Raman spectra from the set of figure 3.
Download figure:
Standard image High-resolution image
Figure 6. Fano and Lorentz line shape fitting of the experimental Raman data presented by the spots. Full curves stand for fit: 1.-the Lorentzian fit 2. -the Fano contour calculated with with the following set of parameters: q = 4.7076 ± 0.65 cm−1, γ = 63.097 ± 2.50 cm−1, ν0 = 418.3 ± 1.8 cm−1.
Download figure:
Standard image High-resolution imageHere ν is frequency, γ describes the line width of the spectral band and q, is the Fano parameter. In the case when the q parameter becomes zero and the Fano formula boils down to the usual Breit-Wigner (Lorentzian- Cauchy) formula. The fitting results are presented in figure 6 where line shapes are shown by thick and thin lines for the Fano and Lorentz profiles correspondingly. The set of parameters are presented in the figure caption. One may see that the Fano equation fits reasonably good to the smoothed by a Fourier filter experimental data. Note that the Fano resonance is a type of resonance with an asymmetric profile arising from the interference of two (or probably more) wave processes. The nature of interfering processes might be very different, therefore such a resonance is universal and appears in various physical systems. In our case, an interference of two processes cannot be excluded, as Raman-active oscillations of atoms that are typical for the perovskite and acoustic phonons confinement effects may to contribute to the overall effect, for the case of coincidence of the eigenfrequencies of both processes.
For comparison of theoretical results presenting in literature with the experiment, we performed the Fourier transform of data presented in figure 5. The Fourier transform is a well-known recipe to identify not only explicit but also hidden periodicities that are lying behind the experimental data sets. The results of the transform are shown in figure 7, the regions of high-frequency noise are not shown in the figure.

Figure 7. Fragment of the Fourier transform of data presented in figure 4.
Download figure:
Standard image High-resolution imageThe manifestation of the periodicities, i.e. sets of equidistant peaks may indicate the contribution of the size quantization of sound waves (acoustic phonons) to the overall landscape of the Raman scattering. For further analysis of the obtained data, we turn to the results of theoretical calculations of periods using eigenfrequences of the Raman modes summarized in the paper [12]. To search for possible proper periods using theoretical data, we obtain the distribution of all possible periods of harmonics as positive pair differences of all frequencies known for the bulk material. The result is shown in figure 6. One may see in figure 6 four and three eigenfrequences for x = 0 and x = 0.2, correspondingly. As it follows from figure 6, two periods are common for both samples, namely 70 and 100 cm−1 (corresponding inverse periods are 0.014 and 0.01 cm).
A comparison of the figures 7 and 8 shows that bands of inverse periods are more clearly distinguished in figure 7. It means that a selection of oscillation modes may occur by ensembles of clusters. We will consider prolonged clusters that are often terming as whiskers combination of the following factors. Whisker itself is a resonator with a possibility for a sound wave to be confined in it. A set of eigenvalues such as eigen wavelength λn and principal quantum number n are typical for the resonator. The following conditions for the resonator must be fulfilled: 1. linear dependence of the eigen wavelength on its eigen number 2. linear law of phonon angular frequency ω and wavevector k and sound velocity v: ω = kv. Bearing in mind relation for the wave vector k,k = 2π/λ (λ is the wavelength of sound), denoting the length of the whisker by the letter L and the fact that a half-integer number n of wavelengths fits along the length of the cylinder  . Also minding the above dispersion law for sound waves, one may write a single equation for dispersion of energy
  for the confined sound wave:

Using the equation (2) together with the above information on periods (see figure 7), and exploiting information on Young modulus [13] and mass density of NdFeO3 presented in [4], one may estimate energy of the confined phonon n for n = 1 and L. For the period 70 cm−1 and 100 cm−1, length of the cylinder attains 1.2 nm, and L = 1.3, 1.8 nm, correspondingly.

Figure 8. The calculated inverse periods using literature data for theoretically predictions of positions for Raman-active vibration bands.
Download figure:
Standard image High-resolution image
4. Conclusions
Nanoclusters of  were successfully produced by synthesis during combustion glycine and the precursors of the perovskite. The Fano line shape profile fits reasonably good the Raman band centred at ∼430 cm−1. Analysis of periods of hidden periodicities confirms the contribution of sets of equidistant peaks to the spectrum. All of these facts may evidence on the contribution of acoustic phonons to the scattering. The whole Raman spectrum may be interpreted through inelastic light scattering by two types of nanoparticles with different sizes and shapes. While the size of the first type of scatterers fluctuates from 30 to 60 nm, the second type of clusters resembles prolonged cylinders with a longitudinal size of 1–2 nm. The considered phenomena can be used to create the physicochemical basics for new nanosized functional materials design as well as to predict the behavior of other similar oxide systems—ferrites, manganites and other complex Rare earth elements compounds.
Acknowledgments
This study was financially supported by the Russian Science Foundation (No. 16-13-10252).