
Abstract
A facile and robust synthesis of carbon dots (CDs) emitting blue-light in water without activation and stabilization has been developed by pyrolysis of citric acid (CA) adsorbed in silica gel (SiO2) pores. Effect of the host pore size on luminescent properties of SiO2@CDs nanocomposite as well as water suspension of CDs has been studied. The synthesis conditions such as concentration of the precursor, duration of synthesis also have been investigated. It has been demonstrated that upon the thermal treatment of silica gels saturated with CA (60% of maximum loading) at 170 °C for 5–600 min, luminescent CDs are shaped inside the nanoreactor pores. These SiO2@CDs emit photoluminescence centered at 450 nm. Silica-immobilized CDs can be separated from the source molecules and side-products by centrifugation, which allows avoiding the dialysis of the resulted mixture and so improve the scaling of the synthesis. The CDs can be easily released from SiO2@CDs by washing it with water. Water-eluted CDs demonstrate photoluminescence at 447 nm. The smaller pore size of the host and longer time of thermal treatment promote the formation of the CDs with better photoluminescent peak symmetry and higher quantum yield up to 10.1%.
Export citation and abstract BibTeX RIS

Original content from this work may be used under the terms of the Creative Commons Attribution 4.0 licence. Any further distribution of this work must maintain attribution to the author(s) and the title of the work, journal citation and DOI.
1. Introduction
Carbon dots (CDs) are a unique new class of water-soluble nanoobjects with strong photoluminescence (PL) in the visible range. Unlike other known nanomaterials, such as noble metal nanoparticles, semiconductor quantum dots and hybrids of organic metal halides, CDs exhibit numerous advantages such as high photostability, low toxicity, and low cost. Finally, the production and application of CDs are very sustainable. They can be obtained from various organic objects and degrade in a natural environment to CO2. Due to their strong photoluminescence, non-toxic nature, good chemical stability, and biocompatibility CDs have great potential in energy conversion and storage [1], water disinfection [2], food safety [3] analytical chemistry [4–6] for development of chemical- and bio-sensors [6–8], biotechnology and nanomedicine [9–11] in cell imaging and biolabeling [12–15], for drug release [16], theranostics [9, 17], and photodynamic therapy [18], etc.
Carbon dots were first received in 2004 by the electrophoretic purification of oxidized single-wall carbon nanotubes [19]. Later, this approach was generalized as 'top-down' [20] and applied to graphite, graphene oxide [21] and nanodiamonds [22]. The top-down approach is based on the shredding of large carbon objects by using arc discharge [19], laser ablation [23], chemical or electrochemical oxidation [24]. The main problems of the top-down synthesis are low CDs yield and small quantum yield (QY) of photoluminescence for the resulting CDs. For example, CDs prepared from candle soot have QY about 2% [25]. In a two-step synthesis that included laser ablation of the carbon precursor and further passivation of the resulted CDs with diamine-terminated poly(ethylene glycol), QY was increased up to 10% [26]. In a one-step synthesis made by laser irradiation of carbon powder suspended in an organic solvent, CDs were obtained with a quantum yield of 5% [27].
Significant progress in CDs preparation has been achieved after an alternative 'bottom-up' approach has been developed several years ago. Particularly, it was demonstrated that organic compounds can generate CDs under thermal decomposition [28–32]. Various organic compounds, such as glucose, citric acid, ascorbic acid (CA), glycine, EDTA have been tested as carbonaceous precursors of CDs as individual components or in the mixture with different additives [33]. In contrast to the top-down approach, bottom-up CDs synthesis allows obtaining highly luminescent CDs (QY > 10%) in the one-step process, which not requires further activation and stabilization of the particles, can be performed under facile and mild conditions (150 °C–300 °C), such as hydrothermal treatment, ultrasonic reaction, microwave-assisted pyrolysis.
From both fundamental and applied perspectives, photoluminescence is one of the most appealing characteristics of CDs. For CDs obtained in bottom-up synthesis, the PL spectra are generally broad and dependent on the excitation wavelength (excitation-dependent photoluminescence). Quantum yield of CDs photoluminescence can vary from 1 to 99% depending on the precursors and pyrolysis conditions [34]. Due to the unclear mechanism of the bottom-up synthesis, a variation of the experimental conditions such as heating time and temperature cannot provide efficient control of CDs formation and their further aggregation [1, 7, 10, 30, 34]. Thus, at this point, such an approach has not been able to ensure reproducibility and scale-controlled yield of the luminescent CDs. Therefore, further procedures are often required to separate CDs from other residues [35]. For instance, size-exclusion chromatography [36], dialysis [37–39] and column chromatography [40] have been used for CDs purification and selection.
Spatial isolation of the CDs precursors before their carbonization can be an alternative approach to the post-synthesis separation of CDs. It can be achieved, for example by adsorption the precursor in the pores of an appropriate host material with further pyrolysis of guest-host composite. In such an approach the pores will serve as quantum confinement nanoreactors and will limit the growth and shape of the CDs.
The synthesis of C-dots in nanoreactors is a very attractive approach. In contrast to conventional chemical reactors, the confined space of nanoreactors can increase the probability of reaction collision and the mass transfer of reactive chemical molecules, thereby greatly improving the efficiency of chemical reactions [1, 10]. Information about the application of porous nanomaterials as thermal-resistant nanoreactors for the production of CDs is limited. The first proof-of-concept of size-controlling approach was made in [41], where carbon precursor (citric acid) was introduced into the pores of an inorganic framework before pyrolysis. The resulted CDs were received by the dissolution of silica shell in NaOH with very low QY [41]. Several attempts to use microporous materials in CDs synthesis were published [42–45], but mesoporous materials with pore size larger than 2 nm are more appropriate for templated synthesis of CDs. The latest results in this subject summarized in table S1 is available online at stacks.iop.org/NANOX/1/010011/mmedia (in the ESM). Among mesoporous materials, silica gels have the most appropriate properties to serve as a nanoreactor for CDs preparation. They have suitable pore size (from 1.5 to 11 nm) and hydrophilic surface, about 99% of the total silica gel surface is the area of mesopores. Thus, templated synthesis of CDs using mesoporous silicas attracts the most attention [46–51].
Nevertheless, information on the application of silica gels as nanoreactors for CDs synthesis if very segmental and insufficient. Particularly, no information available on the effect of the host pore size on the size and luminescent properties of the CDs. Also, the methodology for matrix-assisted CDs preparation, such as precursor loading, optimum duration of synthesis, conditions of CDs removal from the nanoreactor requires further development.
In the current study, four sets of silica gel (SiO2) samples having a different diameter of pores (from 4 to 11 nm) have been studied as nanoreactors for the preparation of CDs from citric acid. To ensure localization of CA strictly in the template pores, samples of silica gels with adsorbed CA (SiO2@CA) were obtained with 60% of CA maximum loading. Silica gel composites with embedded CDs (SiO2@CDs) were prepared at 170 °C–200 °C during 15–600 min Conditions of CDs elution from the host have been also studied. The results were compared with the conventional bottom-up preparation of CDs from CA. Solid SiO2@CDs nanocomposites and water suspension CDs have been characterized by various methods such as SEM, AFM, FTIR, XPS, UV–vis, luminescence spectroscopy (including 3D photoluminescent spectra and excitation-emission map).
2. Experimental section
2.1. Materials
Citric acid (99.5%) was purchased from Proquimios (Brazil), sodium hydroxide (99%) was from Dinamica (Brazil), sodium bicarbonate (99%) was supplied by Synth (Brazil). Four sets of silica gel (all from Sigma–Aldrich) were used. Their different porous characteristics, particle size, and geometry are presented in table 1. Calcium hydride (95%), toluene(99.8%), and molecular sieves (3 Å, 4–8 mesh) were purchased from Sigma–Aldrich (USA). Toluene was dried by distillation over calcium hydride and stored in a dark bottle with molecular sieves. All aqueous solutions were prepared with ultra-pure water from a water purification system (The PURELAB Classic, Elga, UK).
Table 1. Identification and porous characteristics of silica gels used in the current research .
| ID | Sigma-Aldrich ID | Particles type | Particle size (μm) | Average pore size (nm) |
|---|---|---|---|---|
| SiO2(4) | SKU 60735 (SAFC) high-purity grade for column chromatography | irregular | 63–200 | 4.0 |
| SiO2(6) | SKU 717185 (Supelco) technical grade | irregular | 40–63 | 6.0 |
| SiO2(9) | SKU 60745 (SAFC) high-purity grade for column chromatography | irregular | 63–200 | 9.0 |
| SiO2(11) | SKU 80442 (Supelco) 0.7–0.9 cm3/g pore volume | spherical | 40–75 | 11 |
2.2. Characterization
The textural properties of silica gel samples were determined by means of the low-temperature nitrogen adsorption-desorption method at 77 K on an ASAP 2020 (Micromeritics, USA). The total pore volume was determined at the maximal adsorption point and specific surface area was calculated through the BET method. The pore size distribution was calculated through the Nguyen-Do approach modified by Gun'ko (MND) [52–55]. The pH values and the electrical conductivities of supernatant liquids were measured using a PHS-3E meter with a BioTrode lab glass membrane electrode (Hamilton, USA) and HI 8633 conductivity meter (HANNA instruments, UK), respectively. Fourier transform infrared spectroscopy (FT-IR) spectra, recorded within the 4000–400 cm−1 range, were collected on FTLA-2000 spectrophotometer (Thermo Scientific Nicolet). Electronic (UV–vis) absorption spectra (in 200–450 nm range) were measured on a Cary 100 UV–vis spectrophotometer (Agilent, USA). X-ray photoelectron spectroscopy (XPS) was used to analyze the surface composition with the help of a Kα X-ray photoelectron spectrometer (Thermo Fisher Scientific, UK) equipped with a high-performance hemispherical electron analyzer with a 128-channel detector and an aluminum anode X-ray source (Kα = 1486.6 eV), providing an energy resolution of about 1 eV. Photoluminescence measurements were realized using LS 55 luminescence spectrometer (Perkin-Elmer, UK) with 1 cm optical path length quartz cuvettes and with a solid substrate measurement accessory.
The 3D photoluminescence emission spectra were recorded at room temperature and in ultra-high vacuum (10−7 mTorr) conditions at the Toroidal Grating Monochromator (TGM) beamline of the Brazilian Synchrotron Light Laboratory (LNLS). Photons within the energy range of 4.5–8 eV (276–155 nm) were used as a source of exciting light after filtering on a quartz window. Light emission was transferred by an optical fiber line (aperture: 600 μm) and measured on an R928 Hamamatsu photomultiplier (PMT). The spectra were corrected for the variation in the incident flux of the excitation beam using the excitation and emission spectra of sodium salicylate as standard.
The morphology of the samples was studied by means of a low-vacuum JSM-6490LV (JEOL, Japan) scanning electron microscope (SEM). Atomic force microscopy (AFM) images were obtained using a Bruker MultiMode 8 microscope. A Si tip with a force constant of 0.4 N m−1 and a resonance frequency of 70 kHz were used in tapping the peak force method. The samples were diluted in deionized water, ultrasonicated and a single drop was dried on a clean mica surface in a nitrogen flux for 2 h. Statistical analysis of the thickness distribution was performed using Gwyddion 2.53 software.
The powder X-ray diffraction (XRD) pattern of the CDs product was collected at room temperature using a X'Pert PRO (Panalytical, UK) diffractometer equipped with a PIXcel one-dimensional hybrid pixel technology position-sensitive device detector and operated with Ni-filtered CuKα radiation (λ = 1.54178 Å).
Quantum Yield (QY) of CDs was determined from single-point methods [56]. Quinine sulfate in 0.1 M H2SO4 has been used as a standard. Before the measurements, CDs suspensions and quinine sulfate were diluted to the absorption level below 0.1 at the excitation wavelength (344–360 nm) in order to minimize reabsorption effects. Both absorbance and photoluminescence emission spectra were measured for these samples. QY of CDs was measured for two excitation light, at 340 and 350 nm and calculated using equation (1).

where  = quantum yield of CDs;
  = quantum yield of reference;
  = integrated fluorescence intensity of CDs;
  = integrated fluorescence intensity of reference;
  = absorbance of CDs at 350 nm (340 nm);
  = absorbance of reference at 350 nm (340 nm);
  = refractive index of the solvent of CDs;
  = refractive index of the solvent of reference.
The integrated intensity of PL was determined using software SpectraGryph 1.2. The refractive index of water is 1.33.
2.3. Conventional bottom-up synthesis of CDs
Conventional synthesis of CDs was performed by the pyrolysis of bulk citric acid in the inert atmosphere [57]. Briefly, 10 g of CA was placed into 250 ml two-neck round-bottomed flask and heated to 170 °C under nitrogen atmosphere using graphite bath. The transparent liquid became orange after 30 min of heating, which implied the formation of CDs [57]. The resulted liquid was poured out into 130 ml of NaOH (10 mg ml−1) solution under vigorous stirring. The obtained mixture was filtered through a 0.45 μm filter to remove large particles and stored for further analysis in the refrigerator (at 4 °C).
2.4. Preparation of SiO2@CA composite
General scheme of SiO2@CA preparation, thermal treatment, and CDs elution is presented in figure 1.

Figure 1. Scheme of SiO2@CA preparation, thermal treatment, and elution of CDs.
Download figure:
Standard image High-resolution imageA set of silica-based composites having CA adsorbed was prepared from bulk silica SiO2@CA. The set consists of four silica samples with different porosity and was prepared using a similar procedure by adding 1.0 ml of CA aqueous solution (1.5 g ml−1) to 1.0 g of silica. The mixture was sonicated for 10 min and the excess of liquid was removed by blotting it with filter paper until dry. Then 2 mL of diethyl ether was added to silica composite and shaken for 20 min Excess of ether was removed by decantation and the procedure was repeated twice. Finally, the samples were dried under vacuum (0.1 Torr) at 60 °C producing a loose powder.
An additional sample of SiO2@CA was prepared as a reference (rSiO2@CA) by following the experimental procedure, recommended in [41]. Briefly, 200 mg of silica gel SiO2(11) and 100 mg of CA were mixed and sonicated in 0.5 ml of water. The mixture was dried (without filtration and washing) in an oven at 60 °C, producing an agglutinated powder.
2.5. Thermal treatment of SiO2@CA
All silica gels samples were heated at 170 °C and 200 °C under nitrogen atmosphere. Portions of the samples were collected at different treatment time (τ), from 15 to 720 min, to obtain SiO2@CDs-τ.
2.6. Releasing CDs from SiO2@CDs
The conditions of CDs releasing from SiO2@CDs were studied in three consecutive steps: (1) the composites were suspended in 5 ml of water and shaken for 15 min. The solid phase was separated by filtration and the washing procedure was repeated till no fluorescence was observed for the filtrate. Alternatively, SiO2@CDs were washed in Soxhlet apparatus with water. The supernatant was collected, filtrated through a 0.22 μm filter and stored at 0 °C. (2) The samples were washed with 0.1 mol l−1 NaHCO3 solution (portions of 5 ml) in the same manner as it is described for the first step. The supernatant was collected and stored equally. (3) Finally, the silica scaffold was dissolved in 3 ml of NaOH solution (3 mol l−1) at room temperature.
3. Results and discussion
3.1. Morphological properties of host silicas
For proper preparation of CDs under the nanoreactor approach, it is critical to use the hosts with suitable pore size. It is generally accepted that CDs have a particle size of less than 10 nm [5, 7, 58]. Therefore, in contrast to earlier publications where microporous zeolites with small particle size have been used, silica gels with 4–11 nm nominal pore diameter and large particles (40–200 μm) is used in the current research, table 1. The latter shall reduce CA adsorption on an external area of the particles and so prevent the formation of CDs outside of the pores.
Since porous characteristics of the host are essential for the nanoreactor approach, they were justified form nitrogen adsorption experiment. It was confirmed that the selected silica samples have the desirable pore sizes from 5.5 to 10.2 nm, with 0.7–1.25 cm3 g-1 pore volume, table 2. Accordingly, the mesopores contribute more than 95% (commonly 99.7 ± 0.3) to the overall porosity of the silica gels, table 2. Selected samples of the host have a unimodal and narrow distribution of the pores (figure 2), which allows expecting the narrow distribution of hosted CDs particles.
Table 2. Porous characteristics of silica gel hosts.
| Silica denoted | Maximum Loading of CA on SiO2 (g g−1) | Average pore size (nm) | Pore volume (cm3 g−1) | SBET (m2 g−1) | Smeso/SBET, MND (%) |
|---|---|---|---|---|---|
| SiO2(4) | 1.1 | 5.5 | 0.72 | 360.3 | 94.9 |
| SiO2(6) | 1.2 | 6.0a | 0.80 | ― | ― |
| SiO2(9) | 1.5 | 6.9 | 1.01 | 387.4 | 99.8 |
| SiO2(11) | 1.9 | 10.2 | 1.25 | 400.2 | 99.6 |
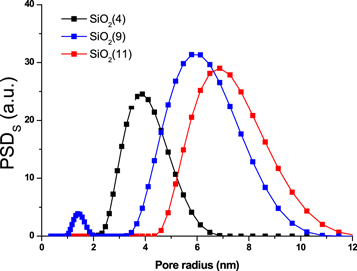
Figure 2. The incremental pore size distribution by surface area of silica gels used for SiO2@CDs preparation.
Download figure:
Standard image High-resolution image3.2. Preparation of SiO2@CA
A crucial aspect of the nanoreactor synthesis of CDs is verification that a major part of the precursor is localized in the host pores. To ensure this, the volume of CA solution used for the preparation of SiO2@CA composites was limited by pore volumes of the silica gels. Also, high loading of hydrophilic silanol groups on the silica surface ensures good affinity of CA to the host. Taking into account the pore volume of silica gel samples and solubility of CA in water (1.5 g ml−1) maximum loading of the precursor was estimated, table 2. For example, 1 g of silica SiO2(11) can hold up to 1.9 g of CA inside of the pores. Nevertheless, after the treatment of silica gel even with a small volume of liquid, wet material is always obtained due adsorption of some part of the water solution on inter-particle space. In order to obtain SiO2@CA having the precursor in the pores only, this interparticle liquid having dissolved compounds must be removed before the pyrolysis. To prove the importance of such pre-treatments, a sample labeled as rSiO2(11)@CA was prepared according to the procedures recommended in [41, 42, 59]. By comparison of mass the silica sample before and after treatment with CA, it was found that loading of CA on rSiO2(11)@CA constitute of 112% of maximum pore capacities for this material. Therefore, after drying rSiO2(11)@CA is a compact glued agglomerate. After two consecutive rinsings of rSiO2(11)@CA with ether, CA loading is reduced to 60% of maximum pore capacity. Such samples of SiO2@CA present itself as a loose dry powder. The SEM images confirm the difference between rSiO2@CA particles and SiO2(11)@CA particles (figure 3), demonstrating a lot of CA microcrystals located on the external surface of rSiO2@CA and absence of those on SiO2(11)@CA.

Figure 3. SEM images of rSiO2@CA (a), SiO2(11)@CA (b), and pristine SiO2(11) (c).
Download figure:
Standard image High-resolution imageThus, the importance of the procedure for removing CA excess from an outer surface of silica composite was considered. In order to do so, wet samples of as-prepared SiO2@CA were blotted with filter paper until dry and then were washed out with two portions of diethyl ether. The ether is not miscible with water, therefore it was expected that ether will not penetrate the pores of wet SiO2@CA filled by water and so will remove the excess of CA form the external surface of the particles only. It could get samples of SiO2@CA with high loading of CA in the poses and clean outer surface as it is demonstrated in figure 3.
3.3. Preparation and characterization of SiO2@CDs composites
3.3.1. Synthesis of SiO2@CDs
Four samples of silica-based material were used as a host for CDs precursors. After impregnation with the precursor and pre-treatment, samples of SiO2@CA were thermally treated in an inert atmosphere at 170 °C for 5–600 min and then subsequently washed with water, NaHCO3, and NaOH to release CDs, table 3.
Table 3. Overview of the host samples used for the preparation of CDs from citric acid precursor.
| Host | Pore diameter, nm | Time of pyrolysis, min | Post-treatment |
|---|---|---|---|
| SiO2 | 5.5, 6.0, 6.9, 10.2 | 5, 15, 30, 60, 120, 240, 360, 600 | H2O, NaHCO3, NaOH |
| — | n.a. | 180 | H2O, NaHCO3 |
Earlier it was shown that appropriate temperature for conventional CDs synthesis from CA is 150 °C–200 °C [34, 60]. The temperature in 170 °C was chosen as the middle of the optimal interval and maintained constant in order to compare the results of pyrolysis for different samples. Conventional CDs were also obtained by pyrolysis of CA at 170 °C for 180 min After the thermal treatment SiO2@CDs had light brown, and conventional CDs black color1, figures S1–S2 in the ESM. Under UV light, SiO2@CDs demonstrated bright blue photoluminescence, figure 4. The reference sample rSiO2@CDs has a brown color with randomly-distributed photoluminescence, figure S2 in the ESM.

Figure 4. Images of of SiO2(6)@CDs and SiO2(6) treated for different time (5-60 min) at 170 °C, under illumination with 365 nm light.
Download figure:
Standard image High-resolution image3.3.2. FT-IR spectra
The FTIR spectrum of silica gel host exhibits several peaks related to silanol groups: at 3750 cm−1 for isolated Si-OH; 3670–3220 cm−1 for hydrogen-bonding Si-OH; at 1640 cm−1 deformation vibration Si-OH. Also, FTIR spectra of silica host demonstrate two peaks at 1800–2000 cm−1 that corresponds to overtones from Si–O–Si stretching vibrations, figure 5. Spectrum of SiO2(6)@CDs-180 reveal itself as a superposition of the host and the guest (CDs) and in addition to the bands of silica, SiO2(6)@CDs-180 sample demonstrates well-defined peaks at 1775 cm−1 and 1702 cm−1 that can be attributed to stretching vibration of C=O fragments in –C(O)(OR) and –COOH functional groups of silica-adsorbed CDs [51, 59].
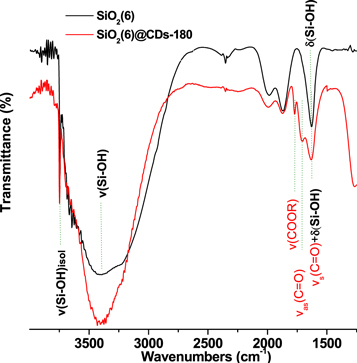
Figure 5. FTIR spectra of SiO2(6)@CDs-180 and pristine SiO2.
Download figure:
Standard image High-resolution image3.3.3. XPS spectra
The XPS survey spectra for the SiO2(6)@CDs-180 (figure 6(a)) indicate predominantly O1s, C1s, Si2s and Si2p peaks centered, respectively, at 532, 286, 155 and 103 eV.

Figure 6. Survey (a) and high resolution fitted XPS spectra (b, c) of SiO2(6)@CDs-180 in O1s (b) and C1s (c) regions.
Download figure:
Standard image High-resolution imageThe high-resolution C1s XPS spectra of samples revealed different types of carbon atoms in CDs. Curve-fitting analysis of high-resolution XPS of C1s reveals bands at 284.5 eV, 286.3, 287.5 and 289 eV that can be assigned to C–C (44%), C–OH (24%), carbonyl (26%) and carboxyl (6%) groups, correspondingly [24], figure 6(c). This king of XPS is very typical for CDs and demonstrates the formation of partly decarboxylated CDs. A weak band at 551,5 eV attributed to carbonyl fragments in CDs can be seen in high-resolution O1s XPS spectrum of SiO2(6)@CDs-180, figure 6(b). This kind of group is common for CDs obtained earlier [1].
3.3.4. Photoluminescence of solid composites SiO2@CDs-τ.
The incipience of CDs has been monitored by measuring the photoluminescence from solid samples of SiO2@CDs obtained for different time of thermal treatment, figure 7. Evidently, the CDs are formed in silica pores very quickly. At least, luminescence of SiO2@CDs can already be detected after 5 min of SiO2@CA treatment at 170 °C. However, the position of PL maximum (420 nm) for SiO2@CDs obtained after such a short time (5–60 min) does not match to PL of CDs obtained from CA by conventional methods (445 nm) [28]. Together with the peak at 420 nm, PL spectra of all SiO2@CDs exhibit a peak at 450 nm, figure 7. Thus, PL spectra of SiO2@CA commonly show a wide band, which consists of two peaks at 420 and 450 nm.
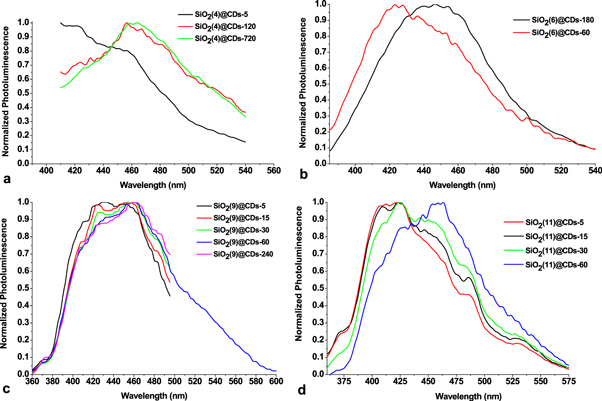
Figure 7. Normalized PL spectra of SiO2(d)@CDs-τ.
Download figure:
Standard image High-resolution imageWhile the peak positions do not substantially depend on the time of SiO2@CDs thermal treatment and the size of the host pores, the relative intensity of long-wave emission rises with time for all studied SiO2@CDs that can manifest the development of CDs with enhanced decarboxylation degree.
The absolute intensity of SiO2@CDs reaches its maximum for 15–30 min of SiO2@CA thermal treatment and then sharply declines for all studied samples, figure 8(a). After 100 min of the treatment, no further depression of PL was observed, figure 8(b).
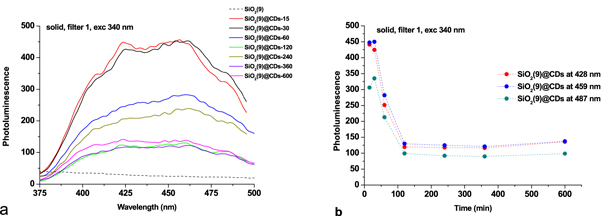
Figure 8. Photoluminescence spectra of SiO2(9)@CDs-τ for different time of the thermal treatments (a), and changes of photoluminescent intensity versus time (b).
Download figure:
Standard image High-resolution imageThe photoluminescence spectra of SiO2@CDs clearly exhibit the formation of CDs captured in silica pores. Apparently, those CDs also have different sizes and shapes since they are characterized by multiple maxima in PL spectra of SiO2@CDs. The nature of the PL band at 420 nm calls for further investigations.
The SiO2@CDs composites also demonstrate photoluminescence that occurs under excitation with high energy radiation (165–276 nm, 7.5–4.5 eV). For example, SiO2(6)@CDs generates wide emission with a maximum at 525 nm, figure 9(b). From two-dimensional mapping, as a function of the excitation energy, it can be seen that the peak position of photoluminescence emission almost does not change in the function of excitation energy, figure 9(a). The most intense photoluminescence for SiO2(6)@CDs is observed at 4.0–4.2 eV (310–295 nm). Presumably, SiO2(6)@CDs can be useful for adsorption and transformation of short wave UV radiation.

Figure 9. 3D photoluminescent spectra and excitation-emission map of SiO2(6)@CDs-180 (a), (b).
Download figure:
Standard image High-resolution image3.4. Elution of CDs from the host
To elute the resulted CDs from the silica host three consecutive steps were applied. First, they were thoroughly washed with water until the conductivity of the washing solution droped down essentially and absorption at 300 nm was about zero, figures 10(a), (b).

Figure 10. (a) Electroconductivity of supernatant solution obtained after immersing of SiO2(4)@CDs-60 (0.5 g) to 10 ml of water with further filtration and cycling the procedure; (b)–(d) UV–vis spectra of the supernatant solutions, obtained by successive treatment of SiO2(4)@CDs-60 with water (b), 0.1 mol l−1 NaHCO3 (c), 3 mol l−1 NaOH (d) after different time of the thermal treatment.
Download figure:
Standard image High-resolution imageThen, 0.1 mol l−1 of NaHCO3 water solution was exploited for the same purposes. Finally, SiO2 scaffold was dissolved in NaOH. It has been found that water elutes strongly luminescent CDs from all samples of SiO2@CDs-τ. Four washing cycles were enough to remove most of the trapped CDs, figure 10(a). Further washing of SiO2@CDs-τ with NaHCO3 and even solubilization of the host in NaOH do not reveal an essential quantity of the CDs, except for the samples treated for 600 min, figures 10(c), (d). The fact of a weak affinity of the CDs to the SiO2 host can be concluded from this experiment. It also can be assumed that silica gel is more appropriate host for confining of CDs particles then earlier used zeolites because it releases the CDs through treatment with water and does not require solubilization of the host in alkali solution.
During the thermal treatment of SiO2@CA, most of CDs are growing inside of the host pores without essential interaction with the surface of silica. Such a type of CDs particles can be eluted with water from the hosts. Immersing of SiO2@CDs into NaHCO3 solution promotes ionization of silanol groups of silica surface and carboxylic fragments on CDs surface. Next, negatively charged silica surface stimulates elution of the negatively charged CDs.
3.5. Characterization of CDs
3.5.1. Microscopy
AFM technique was utilized to probe the sample topography and measure particle height. AFM image of CDs prepared from rSiO2@CDs according to the procedure [41] shows the wide distribution of the particle's height mainly from 5 to 8 nm, figure 11(a). The CDs obtained from SiO2(4)@CDs-180 have a smaller height (2–4 nm) and narrower distribution profile, figure 11(b).
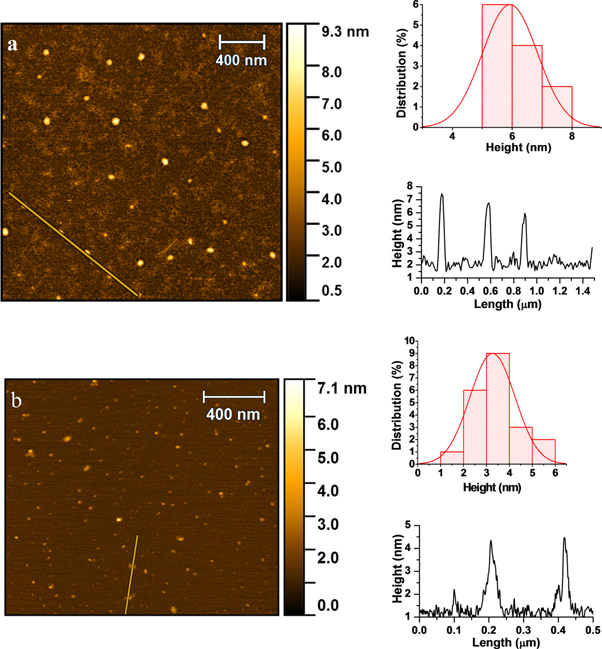
Figure 11. AFM images (left), height distribution (upper right) and profile (lower right) of the CDs obtained from rSiO2@CDs (a) and SiO2(4)@CDs-180 (b) after their elution with water.
Download figure:
Standard image High-resolution imageThese data support the results reflected on the SEM images of rSiO2@CA particles (figure 3), suggesting the possible formation of CDs on the outer surface of the silica template. If so, the growth of such particles is not confined by the template, and CA pyrolysis can lead to formation CDs with size, larger than the size of silica pores. On the contrary, the experimental procedure proposed in current research demonstrates a narrow distribution of the CDs particle height. Thus, the importance of the pre-treatment of SiO2@CA nanocomposites for removing CA excess that can be adsorbed on the outer surface of silica is feasible.
3.5.2. The x-ray diffraction of CDs.
XRD pattern of CDs washed out from SiO2-NH2@CDs-120 with water shows a broad peak centered at 2θ = 23.2° (0.34 nm), which is commonly attributed to the amorphous highly disordered carbon atoms in CDs [56], figure S3 in the ESM.
3.5.3. Photoluminescence of CDs obtained in nanoreactors
All CDs eluted from SiO2 hosts exhibit emission band centered at 447 nm, figure 12. The band intensity essentially depends on the time of SiO2@CA thermal treatment and reaches its maximum for CDs obtained from SiO2@CDs-60 (figures 12(a)–(c)). The PL band symmetry of CDs deteriorates with increasing of the maternal host pore size, reviling short-wavelength shoulder, figure 12(d).

Figure 12. Photoluminescence emission spectra of the first supernatant obtained by the washing of SiO2(d)@CDs-τ with water (a)–(c), and normalized PL spectra of SiO2(d)@CDs-60 for d = 4, 9, and 11 (d).
Download figure:
Standard image High-resolution image
This observation is consistent with those obtained for SiO2@CDs (figure 7) and can indicate the formation of less decarboxylated CDs for short treatment time (less than 60 min) in silica gel with larger pores.
Quantum yield was determined for CDs from SiO2(d)@CDs-r thermally treated for 60–600 min. The results presented in table 4 demonstrate that the CDs obtained in silica host with narrow pores have higher QY (up to 10.1%) than those obtained in larger porous (8.0%). It seems that prolonged time of the thermal treatment increases QY of CDs, at least for those obtained in silicas with narrower pores.
Table 4. Quantum yield of water suspension of CDs, obtained from SiO2(d)@CDs-r.
| Sample | QY (exc. 340 nm), % | QY (exc. 350 nm), % |
|---|---|---|
| SiO2(4)@CDs-170–60 | 7.3 | 5.5 |
| SiO2(4)@CDs-170–600 | 10.1 | 7.9 |
| SiO2(6)@CDs-170–180 | 6.3 | 4.7 |
| SiO2(11)@CDs-170–600 | 8.0 | 5.2 |
4. Conclusions
It was proven that rinsing of SiO2@CA with ether allows manipulating with CA loading into the host pores. XPS spectra of silica-embedded CDs suggest the formation of partly decarboxylated carbon nanoparticles. In silica gel with larger pores, a short time (less than 100 min) of SiO2@CA pyrolysis resulted in the formation of the particles, which exhibit strong blue-shifted PL with a maximum at 420 nm. Increasing of pyrolysis time leads to the formation of luminescent solids with red-shifted (450 nm) PL. These particles eluted with water demonstrate PL at 447 nm. Time of SiO2@CA thermal treatment has no visible effect on CDs PL, except those obtained for very short (less than 60 min) time of the pyrolysis.
Acknowledgments
This study was financed in part by the Conselho Nacional de Desenvolvimento Científico e Tecnológico (CNPq) grants nos. 306992/2018-3, 409090/2018-2 and 438450/2018-3. Additionally, the authors are grateful for financial support from Coordenação de Aperfeiçoamento de Pessoal de Nível Superior, CAPES (grant № 2013037-31005012005P5 – PNPD-PUC Rio, Brazil). Albina Mikhraliieva is grateful to CNPq (154820/2015-6) and Fundação Carlos Chagas Filho de Amparo à Pesquisa do Estado do Rio de Janeiro (FAPERJ) (E-26/200.612/2018) for the conceded fellowships. Prof. Ricardo Aucélio thanks scholarships and grant from FAPERJ (E-26/202.912/2017, E-26/010.101131/2018) and CNPq (303866/2017-9). The authors acknowledge utilization of TGM beamline (3D photoluminescence experiment) at Brazilian Synchrotron Light Laboratory (LNLS) from Brazilian Center for Research in Energy and Materials (CNPEM, Proposal № 20170465). Special thanks to Prof. Flávio Garcia and Dr. Richard Caraballo-Vivas for the assistance in the XRD studies (Laboratory of the X-rays diffraction, CBPF, Brazil) and to LABNANO for utilization of electron microscopy facilities (CBPF, Brazil); Brazilian Nanotechnology National Laboratory (LNNano) from CNPEM for technical support in XPS analyses. Also, the authors are grateful to Prof Edilson V. Benvenutti for fruitful help and collaboration.
Data availability
The raw data required to reproduce these findings are available to download from http://doi.org/10.17632/9md6ykhnks.1.
Footnotes
- 1
After 30 min of thermal treatment of CA at 170 °C it melts to yellow colour liquid, figure S1 in the ESM.