

Abstract
Medical image segmentation is essential to image-based disease analysis and has proven to be significantly helpful for doctors to make decisions. Due to the low-contrast of some medical images, the accurate segmentation of medical images has always been a challenging problem. The experiment found that UNet with current loss functions cannot capture subtle information in target contours or regions in low-contrast medical images, which are crucial for subsequent disease diagnosis. We propose a robust loss by incorporating the difference in average radial derivative (ARD), length and region area to further help the network to achieve more accurate segmentation results. We evaluated the proposed loss function using UNet as the base segmentation network compared to five conventional loss functions on one private and four public medical image datasets. Experimental results illustrate that UNet with the proposed loss function can achieve the best segmentation performance, even better than the outstanding deep learning models with original loss functions. Furthermore, three representative datasets were chosen to validate the effectiveness of the proposed δARD loss function with seven different models. The experiments revealed δARD loss's plug-and-play feature and its robustness over multiple models and datasets.
Export citation and abstract BibTeX RIS

Original content from this work may be used under the terms of the Creative Commons Attribution 4.0 license. Any further distribution of this work must maintain attribution to the author(s) and the title of the work, journal citation and DOI.
1. Introduction
Medical image segmentation plays a vital role in image-based disease analysis and is an important step in computer-aided diagnosis systems that can help doctors make correct decisions quickly. Due to the low-contrast of some medical images, the accurate segmentation of medical images has always been a challenging problem. Several examples are given in figures 1(a)–(c) resent representative images of an ultrasound benign breast tumor having a regular shape and smooth boundary (BD), an ultrasound malignant breast tumor with an irregular shape and rough lesion BD, and a microscopic image of lesion nuclei, respectively. As shown in figures 1(a) and (b), in breast ultrasound images there exist problems of artifacts, low-contrast and uneven intensity [1]. Due to poor image quality, low image contrast, and tumor size and shape changes in breast ultrasound images, accurate identification of lesion boundaries becomes difficult. The microscopic image shown in figure 1(c) is composed of multiple nuclei, the contrast in the original image is low and multiple regions of interest need to be located during segmentation, thus increasing the complexity of accurate BD delineation.

Figure 1. Samples of medical images. From left to right: (a) an ultrasound image of a benign breast tumor, (b) an ultrasound image of a malignant breast tumor and (c) a microscopic image of lesion nuclei.
Download figure:
Standard image High-resolution imageIn the training phase, the network is pushed to make predictions consistent with the ground truth (GT) by using the loss function. The choice of loss function plays an important role in improving segmentation performance because it enables convolutional neural network (CNN) to capture complex details related to region of interest (ROI). At present, researchers have proposed several loss functions, of which cross entropy (CE) loss and dice loss were the two most commonly used [2]. In addition, active contour (AC) loss [3] adopted an AC-like function with ROI length and region area as loss functions, which performs well in cardiac image segmentation tasks. BD loss [4] combined BD information and dice loss to enhance the segmentation effect because it was mentioned that only considering the BD was not conducive to accurate segmentation [5]. Hausdorff (HD) loss [6] incorporated the Hausdorff distance of the segmentation method into the loss function to enhance the model effect.
Based on the attention to loss functions in low-contrast medical image segmentation, we conducted a comparative experiment of different loss functions on the low-contrast medical image datasets. Since UNet is the most widely used and has the most obvious effect on medical image segmentation, we use UNet as a framework to conduct loss function experiments. Meanwhile, to compare the effect of the loss functions, we selected distribution-based CE loss, region-based Dice loss, and three BD-based loss functions, including AC loss, BD loss and HD loss.
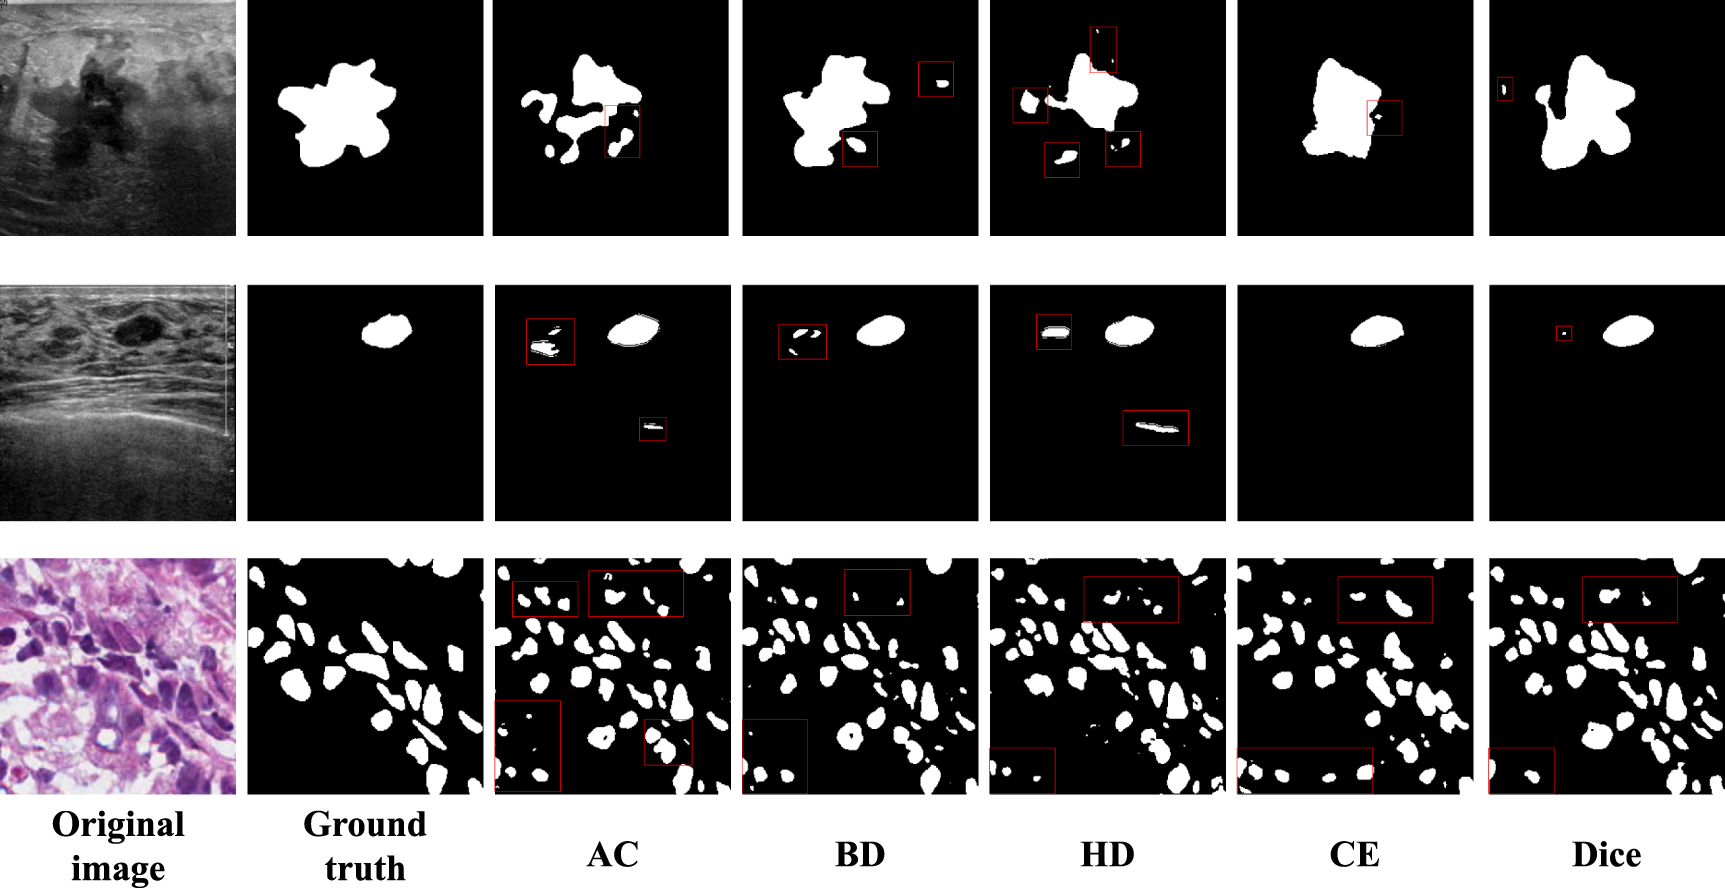
As shown in figure 2, the first line is the segmentation of malignant breast tumors, the second line is the segmentation of benign breast tumors, and the third line is the segmentation of lesion nuclei. In the segmentation of the first line of figure 2, it can be seen from the original image that the shape of the malignant tumor is irregular and has low-contrast and uneven intensity. For the three BD-based loss functions, AC loss, BD loss and HD loss, the identification area is not accurate because there are many scattered points of segmentation errors. The distribution-based CE loss identification area is relatively complete, but the shape cannot match that of GT and the region-based Dice loss identifies the most accuracy areas but the shape cannot match GT. In the second line segmentation of figure 2, it can be seen from the original image that the benign tumor has a regular shape, but there is also a problem of excessive noise in ultrasonic images. The segmentation results of the three BD loss functions showed that the location and shape of the tumor were accurately located, but due to the noise of the ultrasound image, some wrong parts were identified. CE loss and Dice loss accurately identified the target area, but the shape of the three BD-based loss recognition is not accurate. In the third line of segmentation in figure 2, it can be seen from the original image that the microscopic image of the diseased nucleus needs to be segmented into multiple focal areas. All five kinds of loss have the problem of region identification error. Relatively speaking, AC loss, BD loss and HD loss area identification error is larger, CE loss and Dice loss can identify the area relatively accurately, but the shape is slightly different from GT. It can be seen that there are still problems such as inaccurate target region recognition and inaccurate shape detail segmentation in medical image segmentation.

Figure 2. Examples of loss function experiment: from left to right are: original image, ground truth, AC, BD, HD, CE, Dice.
Download figure:
Standard image High-resolution imageThe above problems are divided into two aspects to discuss the loss functions problem in low-contrast medical image segmentation. The first is the accurate identification of the ROI region. It can be observed that distribution-based CE loss and region-based Dice loss perform better in integrity than BD-based loss. Therefore, to segment the integrity of the target, regional information in the loss function is essential. The second is the problem of inaccurate segmentation of shape details. Due to the low-contrast of medical image data, the segmentation shape of the existing loss cannot be close to GT. Even some existing BD loss cannot guarantee the shape fitting. Therefore, it is necessary to introduce other features in the loss function to pay more attention to the BD information.
Therefore, to help the network capture information about valuable ROI shapes and regions in low-contrast medical images and perform excellent segmentation of medical images, this paper proposes a robust loss function that takes into account the average radial derivative increment(δARD), ROI length and region. In the past decade, CNN-based deep learning methods have achieved excellent results in the field of medical image segmentation by better understanding multi-layered image features. In particular, UNet and its variants have proven to be the most efficient and commonly used medical image segmentation method. Therefore, this paper conducts an experimental comparison of different loss functions based on the UNet framework. In addition, we set three hyperparameters to control the importance of the features so that the proposed losses can be applied to five medical image datasets.
2. Related works
2.1. Loss functions
Loss functions used in medical image segmentation tasks can be divided into four categories as follows:
(i) Distribution-based loss
Distribution-based loss functions aim to minimize the difference between the real probability distribution and the predicted probability distribution. The most typical distribution-based loss function is cross-entropy (CE), which is prone to slow progress in the iterative process in medical image datasets with class-imbalanced problems and may not be optimized to the best. Hence, some loss functions were proposed based on CE loss, such as TopK loss [7] and Focal loss [8],

where  denotes the set of all the points on the horizontal and vertical dimensions,
  denote the points in the set
  , respectively. The GT pixel is denoted by
  , and the predicted pixels as
  . Ω denotes the set of all points contained in the whole image.
(ii) Region-based loss
Typical region-based loss functions are dice loss [9], ioU loss and tversky loss [2], etc. Due to the lack of attention on the contour, region-based loss functions could not perform well on those medical images that contain ROIs with rough contours (e.g. figure 1(b)),

(iii) BD-based loss
BD-based loss functions compute the difference between the predictions and the GT in the shape-aware and the length-aware BD space. These include BD loss [4] and HD loss. Karimi and Septimiu [6] proposed HD loss and proved that hausdorff distance could be approximated by GT and distance transformation of prediction segmentation, avoiding unstable training. However, only considering BD is not conducive to accurate segmentation [5]. Thus, AC loss combines length and region area together and helps CNN achieve better segmentation performance on medical image datasets,


where λ and θ are two hyperparameters,

where  and
and  are the distance transformation of GT and segmentation.
(iv) Compound-based loss
By combining different loss functions in some way, the compound-based loss functions could obtain more accurate segmentation results [2, 10]. However, the parameters introduced may have decreased efficiency.
2.2. Networkks
CNNs, such as AlexNet [11], UNet [12], UNet ++ [13], Dense-UNet [14] and SE-net [15], extract hierarchical structure and features with excellent performance, and have been widely used in segmentation tasks. In the field of medical image analysis, Ronnenberg et al [12] proposed a convolutional network for biomedical image segmentation, UNet, which can be trained end-to-end from very few images, has been widely used and improved. Rundo et al [16] proposed USE-Net for prostate region segmentation in multi-institutional MRI datasets, and the SE module's adaptive feature recalibration provides excellent cross-dataset generalization. Protonotarios et al [17] proposed a few-shot U-Net deep learning model for segmentation of lung cancer lesions in PET/CT imaging and continuously adjusted the weight of the model online according to user feedback to improve detection and classification accuracy. Zhuang et al [18] proposed a residual-extended-attention gate-unet (RDAUNet) that combines expansion residuals and attention gates into UNet architectures. UNet and its variants have proven to be the most efficient and commonly used medical image segmentation method.
In addition, to improve CNNs' lack of the ability to model long-range interactions [19, 20], Transformer [21] was introduced into the field of computer vision. Subsequently in medical image segmentation tasks, and achieved successful results. Valanarasu et al [22] describe the Medical Transformer (MedT), which uses gated axial attention and performs best on small medical image datasets without pre-training. Shen et al [23] proposed a dilated transformer (DT) utilizing residual axial attention to further improve the performance of transformer-based approaches. Chen et al [24] proposed that TransUNet, Transformers can be used as a powerful encoder for medical image segmentation tasks, combined with U-Net to enhance finer details by recovering local spatial information.
3. Methodology
The overall segmentation framework is shown in figure 3. As the most commonly used medical image segmentation network with simple architecture, UNet is used as the base segmentation network to evaluate the proposed loss function (δARD).

Figure 3. Overview of our proposed method which takes the object's area, ARD, and length of the boundaries into account during training.
Download figure:
Standard image High-resolution image3.1. δARD loss function
The proposed δARD loss function uses the BD and region information to accommodate the low-contrast data. As shown in equation (6),  consists of three calculation components. One contour-based loss function and one region-based loss function.

where α and β are two hyperparameters that can be tuned for the specific dataset and the based segmentation model to achieve the best performance; δ denotes the difference between the prediction and the GT; L and R denote the length and region area of the ROI. More descriptions of the three components of δARD will be given in the following sections 3.1.1 and 3.1.2.
3.1.1. BD correlation (δARD and δ L):
BD information is vital for subsequent image-based disease analysis and diagnosis. Gomez et al [25]. have obtained outstanding segmentation performance by taking the candidate contour with the largest ARD value as the ideal result, which shows that ARD has a certain effect on deciding the true contour in medical images. At the same time, length also plays an important role in the cardiac data in AC loss. Hence, we introduce ARD and length to the loss function to enhance the network's sensitivity to true lesion contours.

where J is the set of the lesion edges,  is the edge derivation of the image, and
  is a radial vector based on the center of the lesion area,

where u represents GT value.
However, we need to find the BD set J of the lesion first, and then find ARD for each point within the BD, which is very time-consuming for high-resolution medical images. Therefore, we simplify this process by solving the ARD and length of the entire image. The following takes the GT image as an example to find its ARD and length.
In order to simplify the calculation, we approximate the result of GT image dislocation subtraction as the BD of the lesion area and approximate the result of BD dislocation subtraction as the edge derivation,

where I and J represent the set of points in the horizontal and vertical dimensions, respectively.  denotes the BD value of the simplified solution,

The radial vector is simplified to calculate the difference between each point and the center.

where  denotes the position of (i, j), i and j represent points in the set I and J, respectively.
  denotes the average of
  , that is, a central point of all lesion areas on the GT,


where ε is the introduced error term and ε > 0, the GT pixel is denoted by u, and the predicted pixels as v,


where  .
.
3.1.2. Region correlation loss(R):
In the introduction, we proved the importance of regional information in loss from the paper [4] and experimental results. When there is regional information, the localization effect of the region is significantly enhanced. Therefore, it is necessary to introduce regional information,

According to equation (16), R is divided into two parts  and
and  for calculation,


where  and
and  represent the inside area and outside area of the GT region, respectively.
3.2. UNet architecture
For evaluating the proposed loss function, we choose UNet [12] as the fundamental segmentation framework. Figure 3 illustrates that UNet has an encoder-decoder-based architecture. Each encoder module is responsible for extracting image features. It contains two  convolutions layers, followed by a rectified linear unit and a
  max pooling layer; while each decoder module is responsible for upsampling. It consists of a
  up-convolution layer. Furthermore, UNet uses skip connection to combine multi-level feature maps and achieve good performance on medical image segmentation tasks.
4. Experiments
4.1. Datasets
We evaluate the proposed δARD loss on one private and four public medical image datasets by five-fold cross-validation. Specifically, the private breast ultrasound image dataset (PBUSI) was collected from two ultrasound equipment, i.e. GE LOGIQ E9 and PHILIPS EPIQ 5. It consists of 878 breast ultrasound images each of which contains a tumor with varying size and shape. Two experienced radiologists participated in labeling ROI; BUSIS dataset [1] and Busi dataset [26] are two public breast ultrasound image datasets. BUSIS consists of 562 breast ultrasound images, each of which contains one tumor; while Busi consists of 647 images that contain multiple tumor types; MoNuSeg dataset [27] and GLAnd Segmentation (GLAS) dataset [28] are two public microscopic image datasets, among which MoNuSeg dataset contains images across multiple organs and patients, including 30 training data with 22 000 nuclear BD annotations and 14 testing data with 7000 nuclear. This dataset was created by downloading H&E stained tissue images captured at 40x magnification from TCGA archive; GLAS Segmentation consists of 165 images derived from 16 H&E stained histological sections of stage T3 or T42 colorectal adenocarcinoma. Each section belongs to a different patient, and sections were processed in the laboratory on different occasions. The dataset exhibits high inter-subject variability in both stain distribution and tissue architecture. The pathologist delineated the BD of each individual glandular object on that visual field.
4.2. Experiment design and configurations
In this paper, we design three experiments to verify the effect of the proposed loss on the segmentation of lesions in five medical image datasets, i.e. PBUSI, BUSIS, Busi, MoNuSeg and GLAS datasets.
First, to verify the robustness of the proposed loss function, we compare it with the most related loss functions, i.e. AC loss, BD loss, HD loss and the most commonly used loss functions, i.e. CE loss and Dice loss. All the above loss functions were evaluated using UNet as the base segmentation network on the five medical image datasets.
Second, considering the performance of the proposed loss could be affected by the hyperparameters, including α and β, we conducted related experiments to find the best choice for α and β which can help UNet obtain the best segmentation performance on PBUSI dataset. Based on experience, we set 10 pairs of values for α and β. Specifically, when β is 1, we set α to be 0.5, 1, 1.1, 1.2, 1.5 and 2; and when α is 1, we set β to be 1.1, 1.2, 1.5 and 2.
Third, to further verify the effectiveness of the proposed loss function, we conducted a comparative analysis of state-of-the-art (SOTA) deep learning segmentation methods using the CE loss function or our proposed loss function in conjunction. By doing so, we aimed to explore the efficacy of our proposed loss function compared to the currently used CE loss function. SOTA methods i.e. UNet++ [13], RDAUNet [18], Attention UNet [29], Ghost UNet [30], MedT [22] and Trans UNet [24]. We tested this experiment on three typical medical image datasets, i.e. PBUSI, MoNuSeg and GLAS datasets.
Furthermore, we used PyTorch to implement the whole framework and conducted the related experiments on one NVIDIA GeForce GTX 1080ti GPU. During the training period, the learning rate, batch size and epochs were set to 0.0001, 10 and 200, respectively; and all input images were resized to 256 × 256. Moreover, we adopted three typical evaluation metrics that include true positive ratio (TPR), false positive ratio (FPR), Jaccard index (JI), Dice similarity coefficient (DSC), F1 score (F1), Precision (PC) and Specificity (SP).
5. Experimental results and discussion
5.1. Comparison experiments with typical loss functions
In experiment 1, to verify the robustness of the proposed loss function, we compare it with the most related loss functions, i.e. AC loss, BD loss, HD loss and the most commonly used loss functions, i.e. CE loss and Dice loss. All the above loss functions were evaluated using UNet as the base segmentation network on the five medical image datasets.
Table 1 displays the experimental outcomes for typical loss functions such as CE loss, Dice loss, AC loss, HD loss, BD+Dice loss, and the newly proposed δARD loss presented in this paper. It is segmented into five experiments based on the datasets. The results of the segmentation of PBUSI dataset are demonstrated in lines 2–7 of table 1. This experiment signifies that δARD loss yields the highest values of TPR, FPR, JI, DSC, F1, and SP values. δARD loss outperformed the widely used CE loss with an uplift in TPR, FPR, JI, DSC, F1, and SP of 3.0%, 11.4%, 4.4%, 3.6%, 4.0%, and 0.2%, correspondingly. Comparing it to Dice loss, δARD loss shows enhancement in TPR, FPR, JI, DSC, F1, SP, and PC by 1.5%, 1.0%, 1.6%, 1.6%, 1.7%, 0.1%, and 1.1%, respectively. Additionally, when compared with similar BD+Dice loss, δARD loss achieved an improvement in TPR, FPR, JI, DSC, and F1by 1.7%, 0.1%, 0.2%, 1.3%, and 0.6%, respectively. In comparison with similar AC loss, δARD loss showed improvement in TPR, FPR, JI, DSC, F1, SP, and PC by 0.7%, 6.7%, 3.2%, 2.5%, 2.6%, 0.3%, and 4.4%, correspondingly. δARD loss shows the highest accuracy in the segmentation of the small breast ultrasound PBUSI dataset. Furthermore, the proposed δARD loss function improves the accuracy by concentrating on shape information. The same conclusion is observed in the quantization results of BUSIS, Busi, MoNuSeg, and GLAS datasets. Compared to other loss functions, δARD loss achieves optimal values in most indicators, significantly enhancing the overall segmentation results for low-contrast medical images.
Table 1. Comparison experiments with typical loss functions.
| TPR | FPR | JI | DSC | F1 | SP | PC | ||
|---|---|---|---|---|---|---|---|---|
| PBUSI | UNet-CE | 0.755 | 0.376 | 0.624 | 0.736 | 0.744 | 0.987 | 0.803 |
| UNet-Dice | 0.770 | 0.272 | 0.652 | 0.756 | 0.767 | 0.988 | 0.821 | |
| UNet-AC | 0.778 | 0.329 | 0.636 | 0.747 | 0.758 | 0.986 | 0.788 | |
| UNet-HD | 0.730 | 0.275 | 0.610 | 0.719 | 0.733 | 0.989 | 0.803 | |
| UNet-BD+Dice | 0.768 | 0.263 | 0.656 | 0.759 | 0.778 | 0.989 | 0.837 | |
| UNet-δARD | 0.785 | 0.262 | 0.668 | 0.772 | 0.784 | 0.989 | 0.832 | |
| BUSIS | UNet-CE | 0.848 | 0.136 | 0.755 | 0.847 | 0.855 | 0.988 | 0.881 |
| UNet-Dice | 0.918 | 0.106 | 0.843 | 0.910 | 0.910 | 0.991 | 0.916 | |
| UNet-AC | 0.915 | 0.102 | 0.839 | 0.909 | 0.909 | 0.991 | 0.912 | |
| UNet-HD | 0.917 | 0.123 | 0.832 | 0.902 | 0.902 | 0.990 | 0.906 | |
| UNet-BD+Dice | 0.915 | 0.115 | 0.839 | 0.907 | 0.907 | 0.991 | 0.914 | |
| UNet-δARD | 0.919 | 0.096 | 0.847 | 0.914 | 0.914 | 0.992 | 0.919 | |
| Busi | UNet-CE | 0.610 | 0.243 | 0.509 | 0.616 | 0.679 | 0.983 | 0.767 |
| UNet-Dice | 0.654 | 0.211 | 0.575 | 0.671 | 0.752 | 0.989 | 0.823 | |
| UNet-AC | 0.679 | 0.222 | 0.580 | 0.689 | 0.747 | 0.988 | 0.781 | |
| UNet-HD | 0.613 | 0.184 | 0.538 | 0.641 | 0.695 | 0.991 | 0.800 | |
| UNet-BD+Dice | 0.656 | 0.297 | 0.555 | 0.659 | 0.726 | 0.989 | 0.769 | |
| UNet-δARD | 0.700 | 0.188 | 0.616 | 0.716 | 0.789 | 0.988 | 0.813 | |
| MoNuSeg | UNet-CE | 0.785 | 0.442 | 0.579 | 0.725 | 0.725 | 0.914 | 0.702 |
| UNet-Dice | 0.843 | 0.438 | 0.610 | 0.752 | 0.752 | 0.908 | 0.695 | |
| UNet-AC | 0.825 | 0.397 | 0.609 | 0.752 | 0.752 | 0.915 | 0.709 | |
| UNet-HD | 0.835 | 0.423 | 0.609 | 0.752 | 0.752 | 0.909 | 0.703 | |
| UNet-BD+Dice | 0.828 | 0.390 | 0.615 | 0.756 | 0.756 | 0.916 | 0.712 | |
| UNet-δARD | 0.825 | 0.336 | 0.628 | 0.768 | 0.768 | 0.925 | 0.733 | |
| GLAS | UNet-CE | 0.802 | 0.430 | 0.607 | 0.744 | 0.744 | 0.691 | 0.732 |
| UNet-Dice | 0.903 | 0.246 | 0.752 | 0.851 | 0.851 | 0.799 | 0.823 | |
| UNet-AC | 0.893 | 0.244 | 0.755 | 0.851 | 0.851 | 0.817 | 0.834 | |
| UNet-HD | 0.892 | 0.261 | 0.740 | 0.842 | 0.842 | 0.807 | 0.822 | |
| UNet-BD+Dice | 0.901 | 0.179 | 0.778 | 0.869 | 0.869 | 0.830 | 0.850 | |
| UNet-δARD | 0.898 | 0.183 | 0.776 | 0.868 | 0.868 | 0.846 | 0.855 |
Note: We have bolded the best result of the loss functions used in each dataset in the table.
From the above experimental results, we come to the following conclusion. First, we can observe that δARD has the highest TPR, JI, DSC, F1, SP, and PC values and the lowest FPR values on five low-contrast medical image datasets (slightly inferior to BD+Dice loss on GLAS dataset), which indicates that δARD has the best robustness and could help UNet achieve the best segmentation performance on medical image datasets. Second, compared with the most related AC loss, our study highlights that incorporating ARD into the UNet architecture significantly enhances its capacity to capture more intricate BD information for low-contrast medical images. Additionally, we demonstrate that our proposed loss function outperforms well-established typical loss functions.
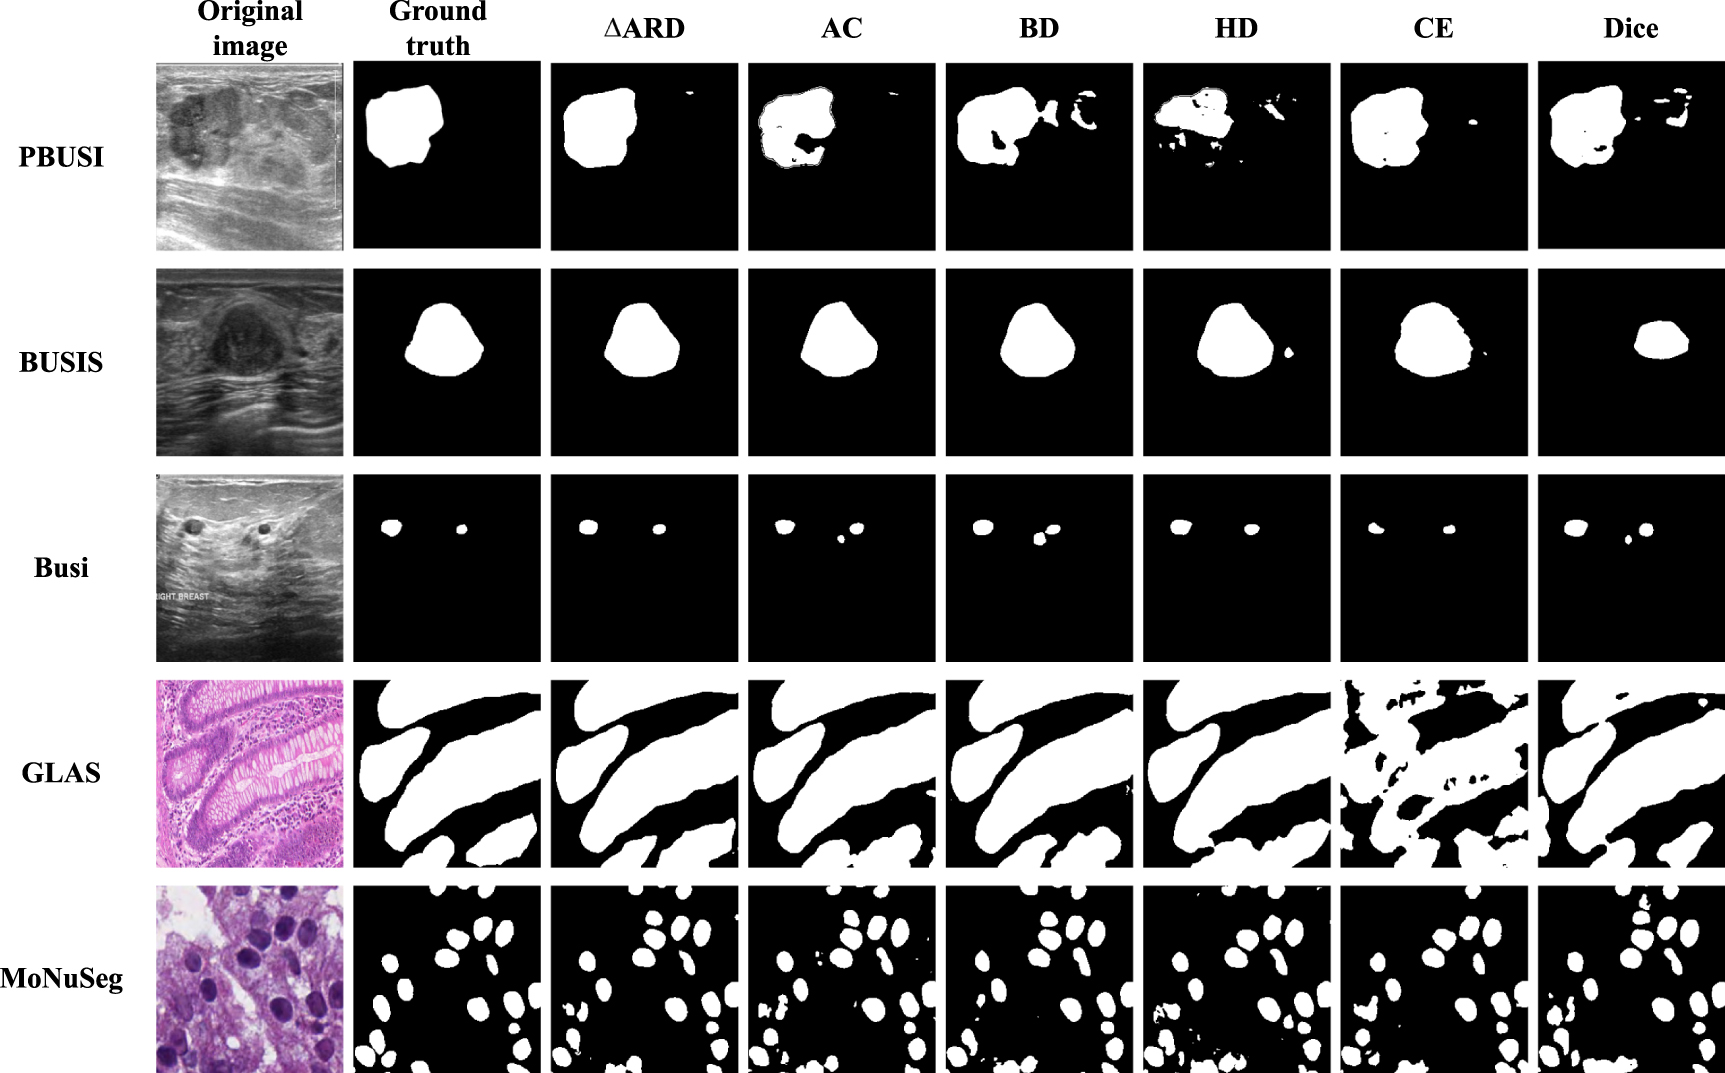
As shown in the first line of figure 4, BD loss, HD loss and Dice loss identified multiple areas due to low-contrast, and changes in lesion size, shape, and location. In contrast, the proposed δARD loss is more effective at enforcing BD and regional characteristics for low-contrast medical images by including ARD, length and area to enhance shape consistency. The result using the proposed loss in the second line of figure 4 is superior to other loss functions in accurately identifying and refining shape contours. Line 3 of figure 4 shows that δARD loss performs accurate segmentation of multiple small breast tumors. UNet identifies two small ROI without any false positives. AC loss, BD loss, and Dice loss models show more error areas, while CE loss and HD loss are worse than δARD loss. UNet was unable to obtain accurate and complete tumors when using the five loss functions shown in line 4 of figure 4. In contrast, interference can be successfully resisted using δARD loss. Therefore, this shows that δARD provides significant information, which helps UNet identify the true ROI region and BD for low-contrast medical images. It is worth noting that during the segmentation process, the false positive area increases, as shown in line 5 of figure 4. However, compared to other methods, the δARD model is closest to GT.

Figure 4. Examples of typical segmentation results on five datasets. From left to right are: Original image, Ground truth, δARD, AC, BD, HD, CE, Dice. From top to bottom: PBUSI, BUSIS, Busi, MoNuSeg, GLAS.
Download figure:
Standard image High-resolution image5.2. δARD under different hyperparameters settings
Table 2 shows the results obtained by UNet using the proposed loss δARD under different hyperparameters that include α and β on PBUSI dataset. It can be found that the optimal performance is obtained when α = 1.1 and β = 1. In addition, when α is increased from 0.5 to 1.2, TPR, JI and DSC values show a continuous increase. It indicates that within a certain upper limit, the larger portion of ARD value considered into the loss function leads to better segmentation performance, but it becomes worse when the portion of α and β is larger than 1.1 (i.e. the loss function considered too much on the BD, and too less on length).
Table 2. δARD performance under hyperparameters α and β settings.
| α | β | TPR | FPR | JI | DSC | F1 | SP | PC |
|---|---|---|---|---|---|---|---|---|
| 0.5 | 1 | 0.771 | 0.313 | 0.641 | 0.747 | 0.765 | 0.987 | 0.806 |
| 1 | 1 | 0.774 | 0.253 | 0.658 | 0.762 | 0.781 | 0.989 | 0.828 |
| 1.1 | 1 | 0.776 | 0.241 | 0.668 | 0.766 | 0.789 | 0.990 | 0.837 |
| 1.2 | 1 | 0.785 | 0.262 | 0.668 | 0.772 | 0.784 | 0.989 | 0.832 |
| 1.5 | 1 | 0.778 | 0.294 | 0.656 | 0.757 | 0.776 | 0.989 | 0.828 |
| 2 | 1 | 0.779 | 0.283 | 0.657 | 0.757 | 0.776 | 0.988 | 0.820 |
| 1 | 1.1 | 0.783 | 0.295 | 0.659 | 0.762 | 0.781 | 0.988 | 0.816 |
| 1 | 1.2 | 0.775 | 0.297 | 0.659 | 0.762 | 0.773 | 0.988 | 0.822 |
| 1 | 1.5 | 0.763 | 0.271 | 0.649 | 0.752 | 0.771 | 0.989 | 0.824 |
| 1 | 2 | 0.760 | 0.272 | 0.648 | 0.749 | 0.771 | 0.988 | 0.822 |
Note: We have bolded the best result of the loss functions used in each dataset in the table.
5.3. Comparison experiment with SOTA deep learning methods
We selected three datasets, PBUSI, GLAS, and MoNuSeg, for the experiment due to their complexity and features such as tumor segmentation, multiple nuclei, and two types of region segmentation on the GLAS dataset. Figure 5 provides a visual representation of seven methods for segmenting ultrasound breast tumors using CE loss or δARD loss on the three datasets. To compare the effectiveness of each method, five representative images were chosen for demonstration. These include the segmentation of benign (line 1) and malignant (line 2) breast ultrasound tumors, small single regions with smooth shapes (line 3), large regions (line 4), and the multicores image (line 5). The results indicate that δARD achieves accurate ROI region consistency and resolves the multipoint prediction challenges encountered by other models. The use of δARD loss improves the model's performance by detecting complete ROI while reducing false positives, particularly in medical images with varying sizes, shapes, and ROI volumes. Our findings demonstrate that implementing the δARD loss function can enhance the contour shape and position accuracy of different models.

Figure 5. Examples of typical segmentation results on PBUSI, GLAS and MoNuSeg datasets. From left to right are: UNet, UNet++, Attention UNet, Ghost UNet, RDAUNet, MedT and Trans UNet. To facilitate display, the key part of the picture is enlarged and displayed. The green line represents GT, the red line represents δARD loss in the model, and the blue line represents CE loss in the model.
Download figure:
Standard image High-resolution image
Table 3 presents the validation results of δARD on various datasets and models including UNet, UNet++, RDAUNet, Attention UNet, Ghost UNet, MedT, and Trans UNet. The study compared the effects of CE and δARD loss function on the segmentation of PBUSI, GLAS, and MoNuSeg datasets with seven models. Our findings indicate that δARD outperforms CE on both PBUSI and GLAS datasets. Notably, on 38 out of 49 measures in the MoNuSeg dataset, we achieved better results than CE loss. The significant improvement in the segmentation performance of different models through the use of our proposed loss function suggests its validity and effectiveness. Therefore, the results in table 3 provide evidence for the practicality of δARD loss function.
Table 3. Results of the comparison experiments with SOTA deep learning models on PBUSI, GLAS and MoNuSeg datasets.
| method | TPR | FPR | JI | DSC | F1 | SP | PC | |
|---|---|---|---|---|---|---|---|---|
| PBUSI | UNet-CE | 0.755 | 0.376 | 0.624 | 0.736 | 0.744 | 0.987 | 0.803 |
| UNet-δARD | 0.785 | 0.262 | 0.668 | 0.772 | 0.784 | 0.989 | 0.832 | |
| UNet++-CE | 0.743 | 0.543 | 0.557 | 0.677 | 0.694 | 0.979 | 0.707 | |
| UNet++-δARD | 0.732 | 0.382 | 0.597 | 0.711 | 0.723 | 0.973 | 0.766 | |
| RDAUNet-CE | 0.696 | 0.646 | 0.544 | 0.658 | 0.677 | 0.973 | 0.755 | |
| RDAUNet-δARD | 0.727 | 0.228 | 0.622 | 0.722 | 0.775 | 0.981 | 0.832 | |
| Attention UNet-CE | 0.669 | 0.437 | 0.522 | 0.633 | 0.687 | 0.984 | 0.737 | |
| Attention UNet-δARD | 0.774 | 0.285 | 0.657 | 0.755 | 0.786 | 0.979 | 0.821 | |
| Ghost UNet-CE | 0.705 | 0.210 | 0.60 | 0.694 | 0.773 | 0.990 | 0.848 | |
| Ghost UNet-δARD | 0.787 | 0.201 | 0.685 | 0.776 | 0.818 | 0.982 | 0.859 | |
| MedT-CE | 0.661 | 0.244 | 0.581 | 0.698 | 0.712 | 0.992 | 0.845 | |
| MedT-δARD | 0.766 | 0.454 | 0.618 | 0.728 | 0.745 | 0.973 | 0.771 | |
| Trans UNet-CE | 0.614 | 0.314 | 0.506 | 0.630 | 0.641 | 0.981 | 0.772 | |
| Trans UNet-δARD | 0.771 | 0.314 | 0.659 | 0.760 | 0.782 | 0.980 | 0.830 | |
| GLAS | UNet-CE | 0.802 | 0.430 | 0.607 | 0.744 | 0.744 | 0.691 | 0.732 |
| UNet-δARD | 0.898 | 0.183 | 0.776 | 0.868 | 0.868 | 0.846 | 0.855 | |
| UNet++-CE | 0.809 | 0.278 | 0.652 | 0.782 | 0.782 | 0.776 | 0.786 | |
| UNet++-δARD | 0.862 | 0.264 | 0.709 | 0.822 | 0.822 | 0.801 | 0.807 | |
| RDAUNet-CE | 0.814 | 0.227 | 0.674 | 0.795 | 0.795 | 0.802 | 0.816 | |
| RDAUNet-δARD | 0.826 | 0.251 | 0.678 | 0.797 | 0.797 | 0.786 | 0.803 | |
| Attention UNet-CE | 0.892 | 0.229 | 0.757 | 0.853 | 0.853 | 0.821 | 0.837 | |
| Attention UNet-δARD | 0.897 | 0.184 | 0.777 | 0.867 | 0.867 | 0.843 | 0.858 | |
| Ghost UNet-CE | 0.885 | 0.205 | 0.756 | 0.853 | 0.853 | 0.839 | 0.843 | |
| Ghost U-Ne-δARD | 0.869 | 0.134 | 0.776 | 0.867 | 0.867 | 0.880 | 0.883 | |
| MedT-CE | 0.661 | 0.244 | 0.581 | 0.698 | 0.712 | 0.992 | 0.845 | |
| MedT-δARD | 0.822 | 0.266 | 0.656 | 0.790 | 0.790 | 0.939 | 0.771 | |
| Trans UNet-CE | 0.764 | 0.310 | 0.604 | 0.746 | 0.746 | 0.771 | 0.767 | |
| Trans UNet-δARD | 0.762 | 0.252 | 0.624 | 0.760 | 0.760 | 0.804 | 0.799 | |
| MoNuSeg | UNet-CE | 0.785 | 0.442 | 0.579 | 0.725 | 0.725 | 0.914 | 0.702 |
| UNet-δARD | 0.825 | 0.336 | 0.628 | 0.768 | 0.768 | 0.925 | 0.733 | |
| UNet++-CE | 0.801 | 0.446 | 0.576 | 0.725 | 0.725 | 0.906 | 0.682 | |
| UNet++-δARD | 0.840 | 0.516 | 0.595 | 0.738 | 0.738 | 0.898 | 0.681 | |
| RDAUNet-CE | 0.840 | 0.396 | 0.613 | 0.757 | 0.757 | 0.911 | 0.699 | |
| RDAUNet-δARD | 0.844 | 0.398 | 0.624 | 0.763 | 0.763 | 0.915 | 0.711 | |
| Attention UNet-CE | 0.807 | 0.342 | 0.611 | 0.754 | 0.754 | 0.922 | 0.724 | |
| Attention UNet-δARD | 0.811 | 0.336 | 0.619 | 0.761 | 0.761 | 0.925 | 0.732 | |
| Ghost UNet-CE | 0.820 | 0.302 | 0.635 | 0.774 | 0.774 | 0.929 | 0.745 | |
| Ghost U-Ne-δARD | 0.831 | 0.337 | 0.630 | 0.770 | 0.770 | 0.923 | 0.730 | |
| MedT-CE | 0.661 | 0.244 | 0.581 | 0.698 | 0.712 | 0.992 | 0.845 | |
| MedT-δARD | 0.822 | 0.266 | 0.656 | 0.790 | 0.790 | 0.939 | 0.771 | |
| Trans UNet-CE | 0.806 | 0.473 | 0.558 | 0.712 | 0.712 | 0.891 | 0.652 | |
| Trans UNet-δARD | 0.847 | 0.399 | 0.614 | 0.758 | 0.758 | 0.906 | 0.696 |
Note: We have bolded the best result of the loss functions used in each dataset in the table.
6. Conclusion
In this paper, we propose a robust loss function to improve the accuracy of low-contrast medical image segmentation. We design a loss function, called δARD loss, that incorporates the differences in ARD, target contour length and area. Additionally, we perform a comparative test on five medical image datasets, comparing the performance of our proposed loss function to five typical loss functions. Our results show that δARD loss outperforms all of the other loss functions. We also propose seven different segmentation models (UNet, UNet++, RDAUNet, Attention UNet, Ghost UNet, MedT and Trans UNet) as the basis for our study. By comparing the effects of applying both CE and δARD loss to these different models, we provide evidence that our proposed loss function is robust and effective for seven models across three medical image datasets.
Acknowledgment
This research was supported in part by the Natural Science Foundation of Liaoning Province (2022-YGJC-52).
Data availability statement
The data cannot be made publicly available upon publication because they are owned by a third party and the terms of use prevent public distribution. The data that support the findings of this study are available upon reasonable request from the authors.
Conflict of interest
The authors declare that they have no known competing financial interests or personal relationships.