
Abstract
The current research paper study the effects of producing white cement using high sulfur petroleum coke (WCPC) instead of using HFO (WCHFO). White Cement production needs huge amounts of thermal units from HFO and it the most consumed energy all over the world. There are many interest to burn alternative energy sources aiming to decrease in combustion cost and secure the surround environment. Current combustion technologies allow the burning of fuel With a high percentage of sulfur such as PC, to have the least environmental damage and generate the least amount of fly ash. HFO contains one third or less of sulfur (S) than high sulfur PC. High concentration of sulfur in white cement/clinker granules cause a series of adverse effects on its applications due to formation of big amounts of anhydrite (CaSO4-insoluble) & aphthitalite (3K2SO4·Na2SO4) and reduce the formation of thenardite (Na2SO4) leaves cracks, endearments and yellowish color for skin coat, painting and decoration applications. High sulfur content in white cement (WCPC) comes from high sulfur in fuel and accordingly increases the setting time, compressive strength, workability and sodium equivalent (Na2OEq) content, while it reduce cement whiteness reflection (Ry) degree. XR, XRD and physical properties of fuels are performed reflected high sulfur and alkali concentration. SEM morphology analysis has been tested showing improving in WCpC microstructure.
Export citation and abstract BibTeX RIS
Abbreviation
| WC | White Cement |
| PC | Petroleum Coke |
| HFO | Heavy Fuel Oil |
| WCPC | White Cement with Petroleum Coke Combustion Material |
| WCHFO | White Cement with Heavy Fuel Oil Combustion Material |
| EC | Energy consumption |
| CaSO4 | Anhydrite |
| Na2OEq | Sodium Equivalent |
| Ry | Whiteness Reflection |
| MTU | Million Thermal Units |
| RDF | Refuse Derived Fuel |
| SRF | Solid Recovered Fuel |
| CSH | Calcium Silicate Hydrate |
| H | Hinter |
| Ry | Reflection on y-axis |
| Rz | Reflection on z-axis |
1. Introduction
Cement production is the world's largest energy and CO2-intensive industry especially white cement production (WC's) due to required high MTU's of energy to reach the eutectic point of cement/clinker formation [1–9]. According to cement department of the building materials chamber of the Egyptian industries federation in 2019, announced that: the production of one ton of cement consumes about 5 MTU, where the price of one MTU ranging between 5–9 dollars, according to the fuel used and cement grade in each factory, which accounts for about 11.1% of Egyptians total final energy consumption and around 14.7% of the final energy consumption of all industrial sector [10–13]. The difficult challenges facing the cement industry during 2019, in light of the indifference to the losses that have occurred in most of the factories' budgets during the past 3 years as a result of very high fuel cost beside liberalization of currency rate, may lead them to declare bankruptcy or at least the expected reduction [12, 13]. All indicators expect more difficulties, and the industry's path to serious stage during the new year, unless the country extends its hand, and cooperates with manufacturers to save the industry from bankruptcy and stopping. We have many major problems that factories currently face represented by: (a) high production surpluses, with new production lines entering to the market, the surplus in 2018 reached 30 million tons, compared to 15.5 million tons in 2017, which pushed the factories to reduce their production capacity, (b) difficulties in exporting these surpluses, because cement is a product that cannot be stored for long time, and the production cost increases year after year, which led to the factories increasing the burden [13–17].
Most factories are currently moving to adjust the energy mix and increase the contribution of alternative fuels, to reduce the cost of energy in production, according to studies if the proportion of alternative fuels in the energy mixture to 20% compared to 80% for coal or coke, the savings achieved will reach $ 50 million annually, and rise to 77 million dollars annually with increasing the contribution of alternative fuels to 10%, this is in addition to its environmental role in reducing carbon emissions [18, 19]. In Egypt, we have different types and quantities of alternative fuels such as: (1) solid derived fuel waste (SDF), (2) fuel produced from various types of municipal solid waste, (3) industrial waste or commercial waste (RDF), that contribute to providing the needs of cement factories. The fuel generated from waste residues, oils and agriculture are used as an alternative fuel for heavy fuels oil in the cement and energy-intensive industries, and it is well known that it helps in preserving the surrounded environment, and based on the high heat content (MTU) of these waste we can use it as an alternative fuel for HFO, diesel and natural gas in cement factories, which helps us to confront it crisis of high prices for fossil fuels and utilization of natural resources. Currently, about 100.6 kilotons of wastes are used annually in waste recycling activities as a substitute for heavy fuel oils [20–23]. This activity, which is still in its early stages, has shown sustainable growth in a context that requires a fundamental change in the local energy system as demand increases. we expected from that activity to increase and allow the wastes to be return within each industry as possible an alternative fuel [24–29].
Petroleum coke is coming from oil refining industry as byproduct which gives high heating value and low price [29–36]. PC is the best alternative fuel for manufacturing white cement for whiteness (Ry) preservation reasons despite its difficulties in terms of its low volatile content, high sulfur and nitrogen content, resulting in many characteristics of undesired emission properties [37–39], the presence of sulfate phases in cement/clinker promotes the microstructure and this can have profound effects in the rheology of cement/water paste and the ultimate compressive strength of the hydrated cement. However, the low price and increased PC production from high-sulfur raw materials give a strong economic incentive to use as combustion material for cement factories. In addition to that the high potential of both NOx & SOx emissions, the highest potential carbon di-oxide (CO2) emission during the combustion process of PC is has very strong concern [33–41], according to the last economic report issued from world cement market analysis, forecast, size and trends and insights update at last quarter of 2020; prices for cement varies from $85 to $100 per ton, depending on the local market, says Trey Grooms, analyst at Stephens.. Due to high content of carbon & sulfur in PC, a relatively huge quantity of emissions are generated. To meet future environmental regulations of Egypt, CO2 recovery became essential for PC burning processes in cement industry [42–45] ex: installing bag filters instead of EP's filters. Moreover, as noted above, sulfur emission control for PC burning processes is also challenging because of the its harmful effect on both surrounded environment and the cement industry process due to highest sulfur content. On the other positive side, present work aims to study the physic-mechanical features and microstructure of both WCPC and WCHFO as a comparative study. It was Clearly notice by several laboratory tests repeatability that PC enhance the compressive strength of WC pastes promoting the formation of calcium silicate hydrate (CSH) which increase cement workability, increasing the setting time by 48% versus WCHFO and reducing the whiteness reflection by 6% versus WCHFO. Because of the current energy crisis in Egypt, it is obligated to conduct many industrial trials on the use of various alternative fuels because it is the only way to survive for the next generation [46].
2. Experiential program
2.1. Materials resources and preparation
Samples of PC were collected on the following plan, (1) As delivered to the plant and collected from the storing yard. (2) As pulverized coke, which was collected isokinetically from the pipes leading from the pulverizer to the pre-heater and kiln main burner and calciner after the milling process and passing the dynamic separator then pulverizer collected from a hopper at the base of the pulverizer as shown in figure 1. HFO sample are taken from the boiler exit at the plant. White cement (WC's) samples are collected from Sinai white Cement Co. ELArish plant, Sinai Governorate. Physical features of petcoke and pulverized petcoke are shown in table 1. Also, main chemical composition and physical properties of HFO is shown in table 2. Table 3 explains the XRF analysis of both cement types.
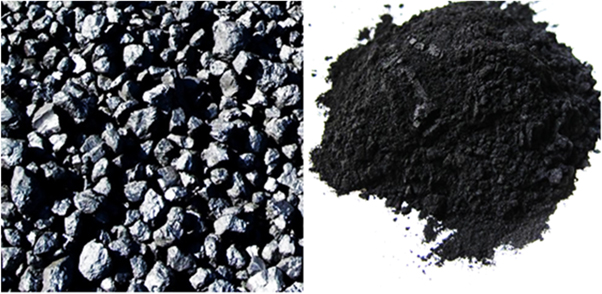
Figure 1. Petcoke as delivered and pulverized petcoke.
Download figure:
Standard image High-resolution imageTable 1. The physical features of Petcoke and Pulverized petcoke.
| Type | Test method | Units | Petcoke, solid As delivered | Pulverized petcoke |
|---|---|---|---|---|
| Moisture | ASTM D4932 | % mass | 4.11 | 0.31 |
| Total Sulfur (S) | ASTM D4239B | % mass | 6.99 | 6.04 |
| Ash Content | ASTM D4422 | % mass | 0.90 | 4.26 |
| Volatile Matter | ASTM D6374 | % mass | 13.94 | 13.03 |
| Raw calorific Value | ASTM D5865 | K.Cal/Kg | 8532 | — |
| Net calorific Value | ASTM D5865 | K.Cal/Kg | 7901 | 7980 |
| Fixed Carbon (C) | ASTM D3172 | % mass | — | 83.61 |
| Hardgrove | ASTM D5063 | — | 65 | — |
| Seive 90 | Alpine | μ° | — | 2.40 |
Table 2. Main chemical composition and physical properties of HFO.
| Parameter | Test method | Units | Results |
|---|---|---|---|
| Raw calorific Value | ASTM D5865 | K.Cal/Kg | 9664 |
| Density at 150 °C | ASTM D1217 | kg m−3 | 986.2 |
| Viscosity at 500 °C | ASTM D4486 | mm 2/s | 377 |
| Micro - carbon residue | ASTM D189-28 | % mass | 14.65 |
| Sulphur (S) | ASTM D4239B | % mass | 3.13 |
| Fixed Carbon (C) | ASTM D3172 | % mass | 88.14 |
| Hydrogen (H) | ASTM D5705 | % mass | 0.21 |
| Nitrogen (N) | ASTM D8056 | % mass | 0.68 |
| Ash | ASTM D4422 | % mass | 0.064 |
| Vanadium (V) | ASTM D5863-00a | mg kg−1 | 141 |
| Nickel (Ni) | ASTM D5863-00a | mg kg−1 | 34 |
| Naphthenes | ASTM D5443 | % mass | 7.42 |
Table 3. Chemical composition of WC. produced using HFO and P.C by XRF.
| Material | SiO2 | Al2O3 | CaO | Fe2O3 | MgO | SO3 | Na2O | K2O | LOI | Cl- | Total |
|---|---|---|---|---|---|---|---|---|---|---|---|
| WCHFO | 24.41 | 2.59 | 68.38 | 0.20 | 0.30 | 0.76 | 0.35 | 0.08 | 0.73 | 0.07 | 98.63 |
| WCPC | 24.83 | 2.90 | 68.70 | 0.30 | 0.38 | 1.81 | 0.69 | 0.11 | 0.95 | 0.09 | 99.37 |
2.2. Preparation of cement paste composites and testing methods
Generally, the physico-chemical and mechanical features of both WCHFO and WCPC were examined. Cement patches were molded into steel molds of (2.5 cm*2.5 cm*2.5 cm), then cured in humidity chamber of 98 ± 1% relative humidity (RH) at room temperature. After one day of curing,, the hardened cubes were de-molded and immersed directly in the cabinet filled by tap water with 98 ± 1% RH for 1,14, 28 and 90 days of hydration to measure the compressive strength. The curing condition was chosen according to ASTM [47] which showed the positive role of (high RH) on the performance of the cement-pastes. Setting times of WCHFO and WCPC cement patches measured by Vicate apparatus based on ASTM C191 [48]. Compressive strength (CS) was applied three- hardened white cement cubes for each paste according to ASTM C109M [49]. Sodium equivalent content (Na2OEq) was calculated according to following equation: Na2OEq,% = [Na2O - 0.659 × K2O] [50]. Whiteness reflection performed using 'Elerpho' apparatus according to DIN 5033 specs [51]. After 90 days the hydration rate of WCHFO and WCPC pastes were stopped by immersing of white cement cubes broken in acetone: methanol mixture as [1:1] ratio for one day, then followed by drying process at 60 °C for 8 h, then a part of dried sample was kept for testing with scanning electron microscopy (SEM), detailed industrial diagram for WC's samples collection from the cement plant is plotted in figure 2.
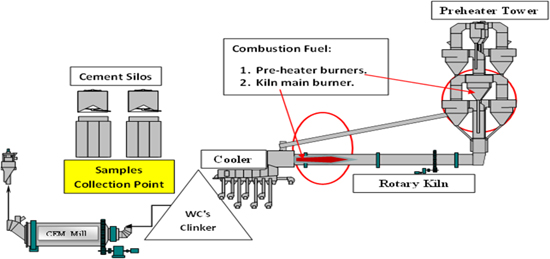
Figure 2. Industrial diagram for WCs samples collection at the cement plant.
Download figure:
Standard image High-resolution image2.3. Instrumental methods
The chemical composition of The WC's were performed by using XRF-ARL instrument (XRF-9900). Determine phases of hydration by using x-ray diffraction (XRD), which carried out using Philips (PW3050/60) diffractometer using a scanning range from 5 to 50 (2Ø), with a scanning speed of 1 s/step and resolution of 0.05°/step. On other side, another part of dried sample was milled to pass through (90 μ° mesh) to determine the microstructures (SEM-photos) were obtained with Inspect S (FEI Company, Holland) equipped with an energy dispersive.
3. Results and discussions
3.1. Microstructure and sulfur phases formation
Figure 3 Illustrates SEM micrographs of WCHFO and WCPC pastes hydrated for 90 days. I have noticed that the morphology of WCPC pastes completely differ than that of WCHFO, which can be attributed to the follows:
- Formation of excess hydration products of fibers calcium silicate hydrate (β-CSH-gel like flocks) adhered to the cement/clinker surface. Taylor has reported that the phases in which sulfur can occur in Portland cement clinker are as follows: arcanite (K2SO4), aphthitalite (3K2SO4·Na2SO4), thenardite (Na2SO4), calcium langbeinite (K2SO4·2CaSO4), anhydrite (CaSO4) and as a substituent in the major clinker phases, principally in the alite and belite with little in the ferrite phase [52].
- Appearance of new phase (red cycles in SEM images of WCPC ) of the hydrated product with excess sulfur content in the PC combustion material and the alkali Na+, K+ and Ca+2 equivalent present in the kiln hot meal which gives hardness compact microstructure than other WCHFO pastes due to the incorporation of C2S-phase with these alkalis form Na2SO4, K2SO4 and Ca2SO4 salts promoting the late compressive strength and cement durability [53, 54].
- Finally formation of calcium hydroxide (plant like crystals) as a result of reaction of free lime content with sulfur which gives hardness and compact structure inside the cement pastes structure. WCHFO pastes still have un-combined free lime even after 90 days of hydration (red cycles in SEM image of WCHFO ), which effect badly on the compressive strength behavior and consequently negative effect on the microstructure of calcium silicate hydrate (CSH).
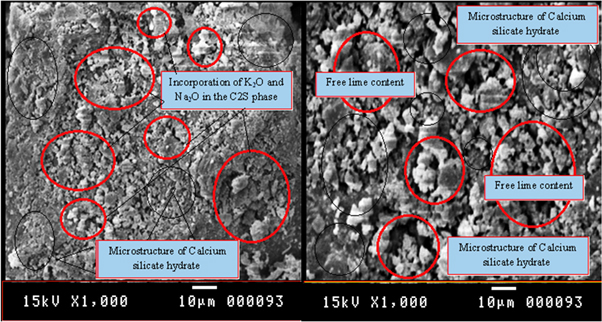
Figure 3. SEM micrographs of WC produced using HFO and P.C.
Download figure:
Standard image High-resolution imageTable 4 illustrate the sulfur phases in weight (%) using XRD analysis and Taylor's equations [52], which gives a great indications about the identity and the concentrations of phases contained sulfur in weight (%) percent. The main 3 minerals were detected by XRD and the other 2 phases calculated by Taylor's equations. The weight of anhydrite and Aphthitalite are high and this may be an indication that part of them were insoluble. In addition to that clinker sulfur tend to be double sulphate salt neither calcium langbeinite nor single sulphate salt as potassium sulphate, and it can't be directly detected but theoretically by using Taylor's equations. Presence of calcium langbeinite in white cement promote the lumps formation of cement due to presences of high alkali content detected in cement analysis.
Table 4. Weight (%) of the sulfur phases present in the cement/clinker, as measured by XRD and Taylor's equations.
| Phase name | Formula | High sulfur Petcoke | Taylor's equations |
|---|---|---|---|
| Anhydrite | CaSO4 | 0.163 | — |
| Aphthitalite | 3K2SO4·Na2SO4 | Not detected | 0.19 |
| Arcanite | K2SO4 | 0.115 | 0.09 |
| Calcium langbeinite | K2SO4·2CaSO4 | Not detected | 0.09 |
| Thenardite | Na2SO4 | Overlapped | — |
3.2. Setting time
The setting time of WCHFO and WCPC are presented in figure 4 obviously, the setting times of the WCHFO-patches were shorter than the WCPC-patches. The changes of initial and final setting time were carefully detected as explained elsewhere [55]. It can be expressed according the following order: WCPC > WCHFO. The longer initial and final setting time of WCPC-patches can be attributed to the excess of SO3 content in cement during the hydration process and half of that sulfate is anhydrate which is not soluble in water and unable to convert calcium tri-aluminate (C3A) into ettringite as sown in following equation:

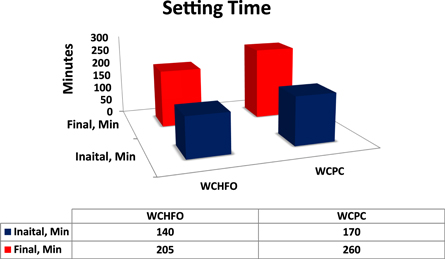
Figure 4. Initial and final setting time of WCHFO and WCPC.
Download figure:
Standard image High-resolution imageC3A is known as the highest reactive phase among all cement phases, and have a strong influence on the early hydration as well as rheology of portland cement and concrete. Initially C3A forms the metastable hexagonal hydrates (C4AH19 and C2AH8) in the presence of water, which are then slowly converted to stable cubic hydrates (C3AH6) [56]. The hydration of C3A can be represented as follows [57]:

It was observed during setting time test for WCPC that the cement tendency to false set or flash set due to precipitation of gypsum during hydration in the first minutes, is characterized by the fact that the false set disappear by remixing. Meanwhile, the WCHFO has been the shortest setting times due to the sulfate/alkali ratio is in acceptable limits as HFO had the lowest sulfur content compared to PC and the produce clinker is more granular than dust product respectively.
3.3. Compressive strength
Compressive strength results of WCHFO and WCPC are depicted in figure 5 As a function of hydration ages. As alkali benefits WCPC showed the highest compressive strength comparing to WCHFO. The compressive strength of WCPC shows sharp increases with curing ages for all hardened pastes especially at the late strength records as a result of high SO3/alkali ratio and Na2OEq prompting formation of excess amount of hydration products especially, calcium silicate hydrate (β-CSH) which responsible for capacity building as shown in the detailed graph(6). Excess SO3/alkali (ratio > 1.2) and Na2OEq affects clinker burnability and increases the degree of volatilization as they acts as fluxes at combustion temp ≥ 1050 °C [58, 59]. Early strengths of WCPC is lowered comparing to WCHFO due to the incorporation of alkali equivalent to the C2S phase (rather than K2SO4, Na2SO4 which dissolves rapidly and leads directly to higher late strengths), which reduce the soluble alkalis in cement so the early strength of WCHFO is higher than WCPC.
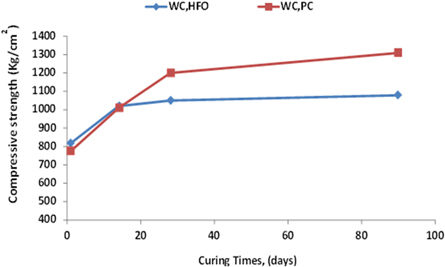
Figure 5. Compressive strength of WCHFO and WCPC cured for 1, 14, 28 and 90 days.
Download figure:
Standard image High-resolution image3.4. Sodium equivalent (Na2OEq)
Sodium equivalent of WCHFO and WCPC are depicted in figure 6. WCPC has the higher Na2OEq compared to WCHFO. Due to high sulfur content in the PC combustion material, the WC producers use a complementary raw material which known as Potassium Feldspar (PF) [Sanidine (monoclinic) (K,Na)AlSi3O8] [60, 61]. Potassium Feldspar is rich in alkalis (potassium, sodium and calcium) act as a flux, lowering the melting temperature of the hot meal mixture. Fluxes melt at an early stage in the firing process, forming a glassy matrix that bonds the alkalis to sulfur and other excess components of the system during combustion together forming sodium sulfate Na2SO4, potassium sulfate K2SO4 and anhydrite Ca2SO4. These alkaline salts are desirable in the combustion atmosphere inside the cement kiln system, which prevents cyclone blockage and any accumulation at the entrance to the kiln or inside it, in addition to that it enhances the cement/clinker late strength and durability. On the other side the presence of insoluble anhydrite, that makes cracks, endearments and yellowish color, This is considered the worst in the use of cheap petroleum coke in manufacturing of white cement, in addition to increasing the percent of sodium equivalent in the final product by >0.6 maximum permissible, will reduces the applications of WC's. The properties and effect of the sodium equivalent are shown in the flow chart (7), where it is clear that when the alkali equivalent exceeds the boundaries of the standers, it reflected in various effects either in the cement processing line nor in its features and applications are shown in the flow chart as explained in figure 7.
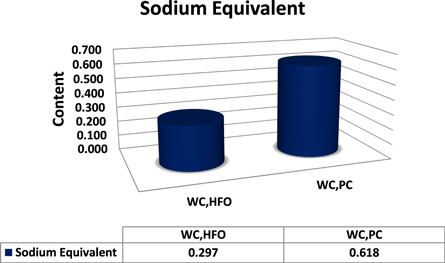
Figure 6. Sodium equivalent of WCHFO and WCPC.
Download figure:
Standard image High-resolution image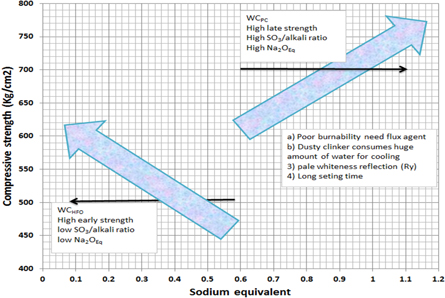
Figure 7. Flow chart of sodium equivalent effects.
Download figure:
Standard image High-resolution image3.5. Whiteness reflection (Ry)
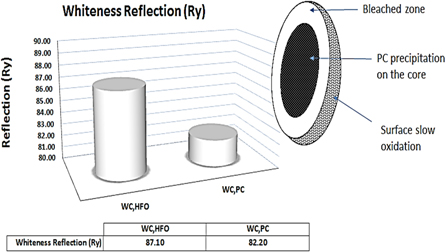
WCPC showed very pale white color compare to WCHFO i.e.: Ry = 82.20 versus Ry = 87.10 respectively, its reflection degree under the Elerpho was low especially on the Rz axis which reflect the green contrast i.e.: Ha = −1.22 versus Ha = −4.79 for WCHFO, as showed visually in figure 8, this evidence supports the decrease at the WCPC whiteness degree (Ry). It can be expressed according the following order: Ry- WCHFO > Ry- WCPC conform to DIN 5033 (relative to 100% Rx, Ry and Rz) [51].
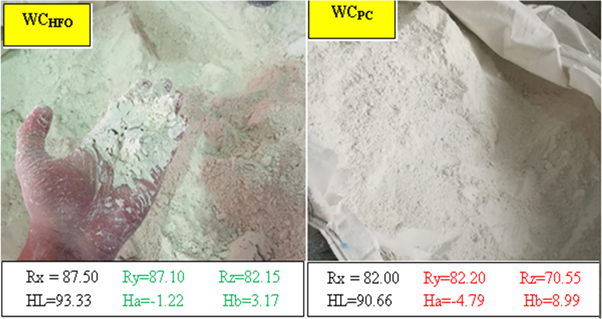
Figure 8. Visual check of whiteness reflection (Ry) for WCHFO versus WCPC.
Download figure:
Standard image High-resolution imageClinker/Cement reflection degree (Ry) effect negatively by using PC in the combustion process due to precipitation of unburned PC particles on the core of cement/clinker particles and due to its poor granulated (dust product) so it needs a huge amount of quenching water during cooling system in order to oxidize its color and become 80% of its size white and the reaming 20% becomes yellow and save its reflection degree (Ry) and its applications as shown in the follows figure 9:
Figure 9. Whiteness reflection (Ry) of WCHFO versus WCPC.
Download figure:
Standard image High-resolution image
4. Conclusion
It has become necessary to take care of the use of different combustion materials and unconventional in all vital industries such as cement and concrete, which will have a positive impact on maintaining the strategic stock of fuel for future generations taking into account the surrounding environment. In the current study HFO was completely replaced by high sulfur PC in white cement production, and the physic-mechanical features and microstructure have been studied. This study proved that replacing heavy fuel oils with high sulfur petroleum coke has a positive effect on improving the microstructure, workability and durability of cement in addition it increases the initial and final setting time while preserving the whiteness reflection degree of the final product as much as possible. In financial terms, there will be a significant decrease in the cost of producing one ton of white cement. It concluded that replacing HFO by PC is feasible, profitable, and environmentalist.
Data availability statement
The data generated and/or analysed during the current study are not publicly available for legal/ethical reasons but are available from the corresponding author on reasonable request.