
Abstract
Ni51Ti49 at.% bulk was additively manufactured by laser-directed energy deposition (DED) to reveal the microstructure evolution, phase distribution, and mechanical properties. It is found that the localized remelting, reheating, and heat accumulation during DED leads to the spatial heterogeneous distribution of columnar crystal and equiaxed crystal, a gradient distribution of Ni4Ti3 precipitates along the building direction, and preferential formation of Ni4Ti3 precipitates in the columnar zone. The austenite transformation finish temperature (Af) varies from −12.65 °C (Z = 33 mm) to 60.35 °C (Z = 10 mm), corresponding to tensile yield strength (σ0.2) changed from 120 ± 30 MPa to 570 ± 20 MPa, and functional properties changed from shape memory effect to superelasticity at room temperature. The sample in the Z = 20.4 mm height has the best plasticity of 9.6% and the best recoverable strain of 4.2%. This work provided insights and guidelines for the spatial characterization of DEDed NiTi.
Highlights:
1. The study revealed the internal physical mechanism responsible for the spatial heterogeneity of microstructure and properties observed in large-volume, Ni-rich NiTi alloy blocks produced using laser-directed energy deposition (L-DED).
2. L-DED was used to fabricate even larger Ni-rich NiTi blocks that were three times the size of the largest one previously studied.
3. DEDed NiTi with mechanical anisotropy and gradient mechanical performance was prepared and discovered that the heat generated during the process can control the properties of the alloy.
4. This paper proposed a simple new preparation method for shape memory alloy functionally graded materials.
Export citation and abstract BibTeX RIS

Original content from this work may be used under the terms of the Creative Commons Attribution 4.0 license. Any further distribution of this work must maintain attribution to the author(s) and the title of the work, journal citation and DOI.
1. Introduction
The near-equiatomic NiTi alloys have recently attracted great attention in aerospace and biomedical applications due to their unique shape memory effect and superelasticity, high corrosion resistance, good biocompatibility, and excellent mechanical properties [1–3]. However, due to the high reaction chemical activity of titanium and the poor processing performance of the NiTi alloys, it is necessary to control the strict processing conditions to process NiTi parts with complex shape by traditional process [2–6]. Based on a layer-based manufacturing manner, additive manufacturing (AM) technology is an ideal candidate for processing NiTi which circumvented many of the challenges associated with the conventional methods [3, 7–11].
Laser-directed energy deposition (L-DED), one of the most attractive AM processing, has been successfully used to fabricate NiTi components [12–14]. Contributions have been paid to L-DEDed NiTi by researchers worldwide, mainly could include two aspects over the last decade [3, 15]. Synthesizing NiTi alloys with different alloying element concentrations in situ by using a flexible and controllable powder feeding method in the DED process [3, 8, 12, 15–21]. It is a great innovation in NiTi alloys and component fabrication, resulting in a series of new theories, new methods, and unprecedented properties [17]. For example, Hou [12] used a localized molten environment and near-eutectic mixing of elemental powders in the DED process, thus forming the nanocomposite microstructure interspersed by Ni3Ti intermetallic compound in the binary NiTi alloy matrix, and ensuring the repeatable elastic properties of more than 1 million times. Abioye et al [22] and Bandyopadhyay et al [23] obtained the functionally graded alloys by modifying the composition of the microstructure on demand by tuning the elemental mixture in the single powder nozzle in L-DED and/or adjusting the mass flow capability of the single powder nozzle.
The other is to study the microstructure evolution or intrinsic martensitic transformation characteristics of DEDed NiTi alloys [13, 14, 24–27]. It was found that high-quality pseudoelastic NiTi alloys with intrinsic Ni4Ti3 phase precipitation can be obtained by in-situ synthesis of spherical powder and appropriate laser parameters. In the previous work on L-DEDed NiTi alloy, the spatial variation of microstructure is determined by the specific solidification behavior of the molten pool, including the uneven temperature gradient from the melting center to the boundary and the grain growth rate [26]. Hamilton et al reported the related attempts of microstructure and mechanical properties of DEDed NiTi alloy. They systematically studied the nickel-rich and nickel-poor binary NiTi alloys produced by DED and found the spatial change of thermally induced martensite transformation temperature and the heterogeneous distribution of grain morphology in the molten pool. But there were no corresponding changes in mechanical properties [13, 14, 18, 26]. The main reason behind this phenomenon is that the limit of tensile properties in their samples (elongation less than 4%) hinders mechanical anisotropy. Even if digital image correlation (DIC) records compressive deformation behavior to address this issue, there is ample evidence for a difference between compression and tension [28]. All of these suggest that their results are phenomenological.
NiTi alloy with Ni content of more than 50 at.% is sensitive to heat treatment in the temperature range of 573–773 K due to the precipitation of Ni4Ti3 [2, 29]. Mukherjee et al [30] proposed that the temporal variation of DED samples should be stronger in the build direction, suggesting that there may be stronger Ni4Ti3 gradient precipitation along the build direction, which would theoretically diversify its properties. The underlying mechanism is that the heat flow in a DEDed sample always propagates from the center of the melt pool to the boundary and from top to bottom along the build direction. This is more or less serious, depending on the processing conditions and the shape of the molten pool [31]. And when the sample volume is large enough, the change of heat flux from the top to the bottom of the DED sample will be more intuitive. However, the DED layer-by-layer thermal accumulation effect is bound to lead to changes in nickel concentration, second-phase precipitation particles, and texture in polycrystalline NiTi alloy, which ultimately leads to the spatial anisotropy of its mechanical properties [2, 28, 32–34].
Therefore, there is an urgent need to study the mechanical spatial anisotropy corresponding to the inhomogeneity of the microstructure [22, 26]. Gao et al obtained Ni50.93Ti49.07 at.% with uniform microstructure by changing the forming method to eliminate intermittent steps and the consistency between the heat flux and solidification directions. The austenite transition finish temperature (Af) of the sample only moves about 3 K from bottom to top along the building direction (BD) [24]. Gradient precipitation of Ni4Ti3 was obtained in the Hamiltonˈs experiment work, but the dimensions of the NiTi bulks were either too small or preheating temperature of the substrate is too high. It causes the sample not to have enough thermal accumulation to greatly change the phase transition temperature and the volume fraction of the second phase particles in the sample. Therefore, there is no corresponding change in mechanical properties and the effect of gradient precipitation of Ni4Ti3 on mechanical properties is ambiguous [18].
Careful examination of previous studies revealed that the dimensions of the NiTi bulks were either too small or preheating temperature of the substrate is too high, which conceals the assumed anisotropy. The fabrication of NiTi on the high-temperature substrate above 573 K will lead to the formation of many Ni4Ti3 precipitates with relatively uniform distribution and large size in the DEDed bulk [13, 18, 26]. The sample is too small to accumulate sufficient thermal history for Ni4Ti3 precipitation [24, 25]. Therefore, a fundamental problem is how the complex and sufficient thermal experience of nickel-rich alloys affects the precipitation of Ni4Ti3 and how these precipitations affect the properties of DEDed bulks.
Drawing on the above discussion, Ni51Ti49 at.% bulk with a large enough volume was successfully prepared on the NiTi substrate with the same composition and without preheating to analyze the evolution of microstructure evolution, precipitation particles, and mechanical properties. In this study, we found that the unique thermal history in the DED process makes its grain morphology and precipitated particles exhibit spatial heterogeneity, resulting in obvious mechanical anisotropy and functional gradient distribution. The gradient distribution of Ni4Ti3 precipitates along the BD results in a nearly 60 K change in the martensitic transformation temperatures (forward transformation temperatures Ms and Mf, reverse transformation temperatures As and Af), as well as a gradient change in functional properties and a nearly 400 MPa change in yield strength from bottom to top. In addition, Ni4Ti3 precipitates preferentially precipitate in the columnar crystal region. The Hall–Petch effect makes the yield strength of specimens perpendicular to and parallel to the scanning direction (SD) different. This will help to understand solidification characterization related to the forming method itself and performance differences associated with the structural features of the deposit and promotes the industrial application of DEDed NiTi.
2. Experimental
2.1. L-DED process
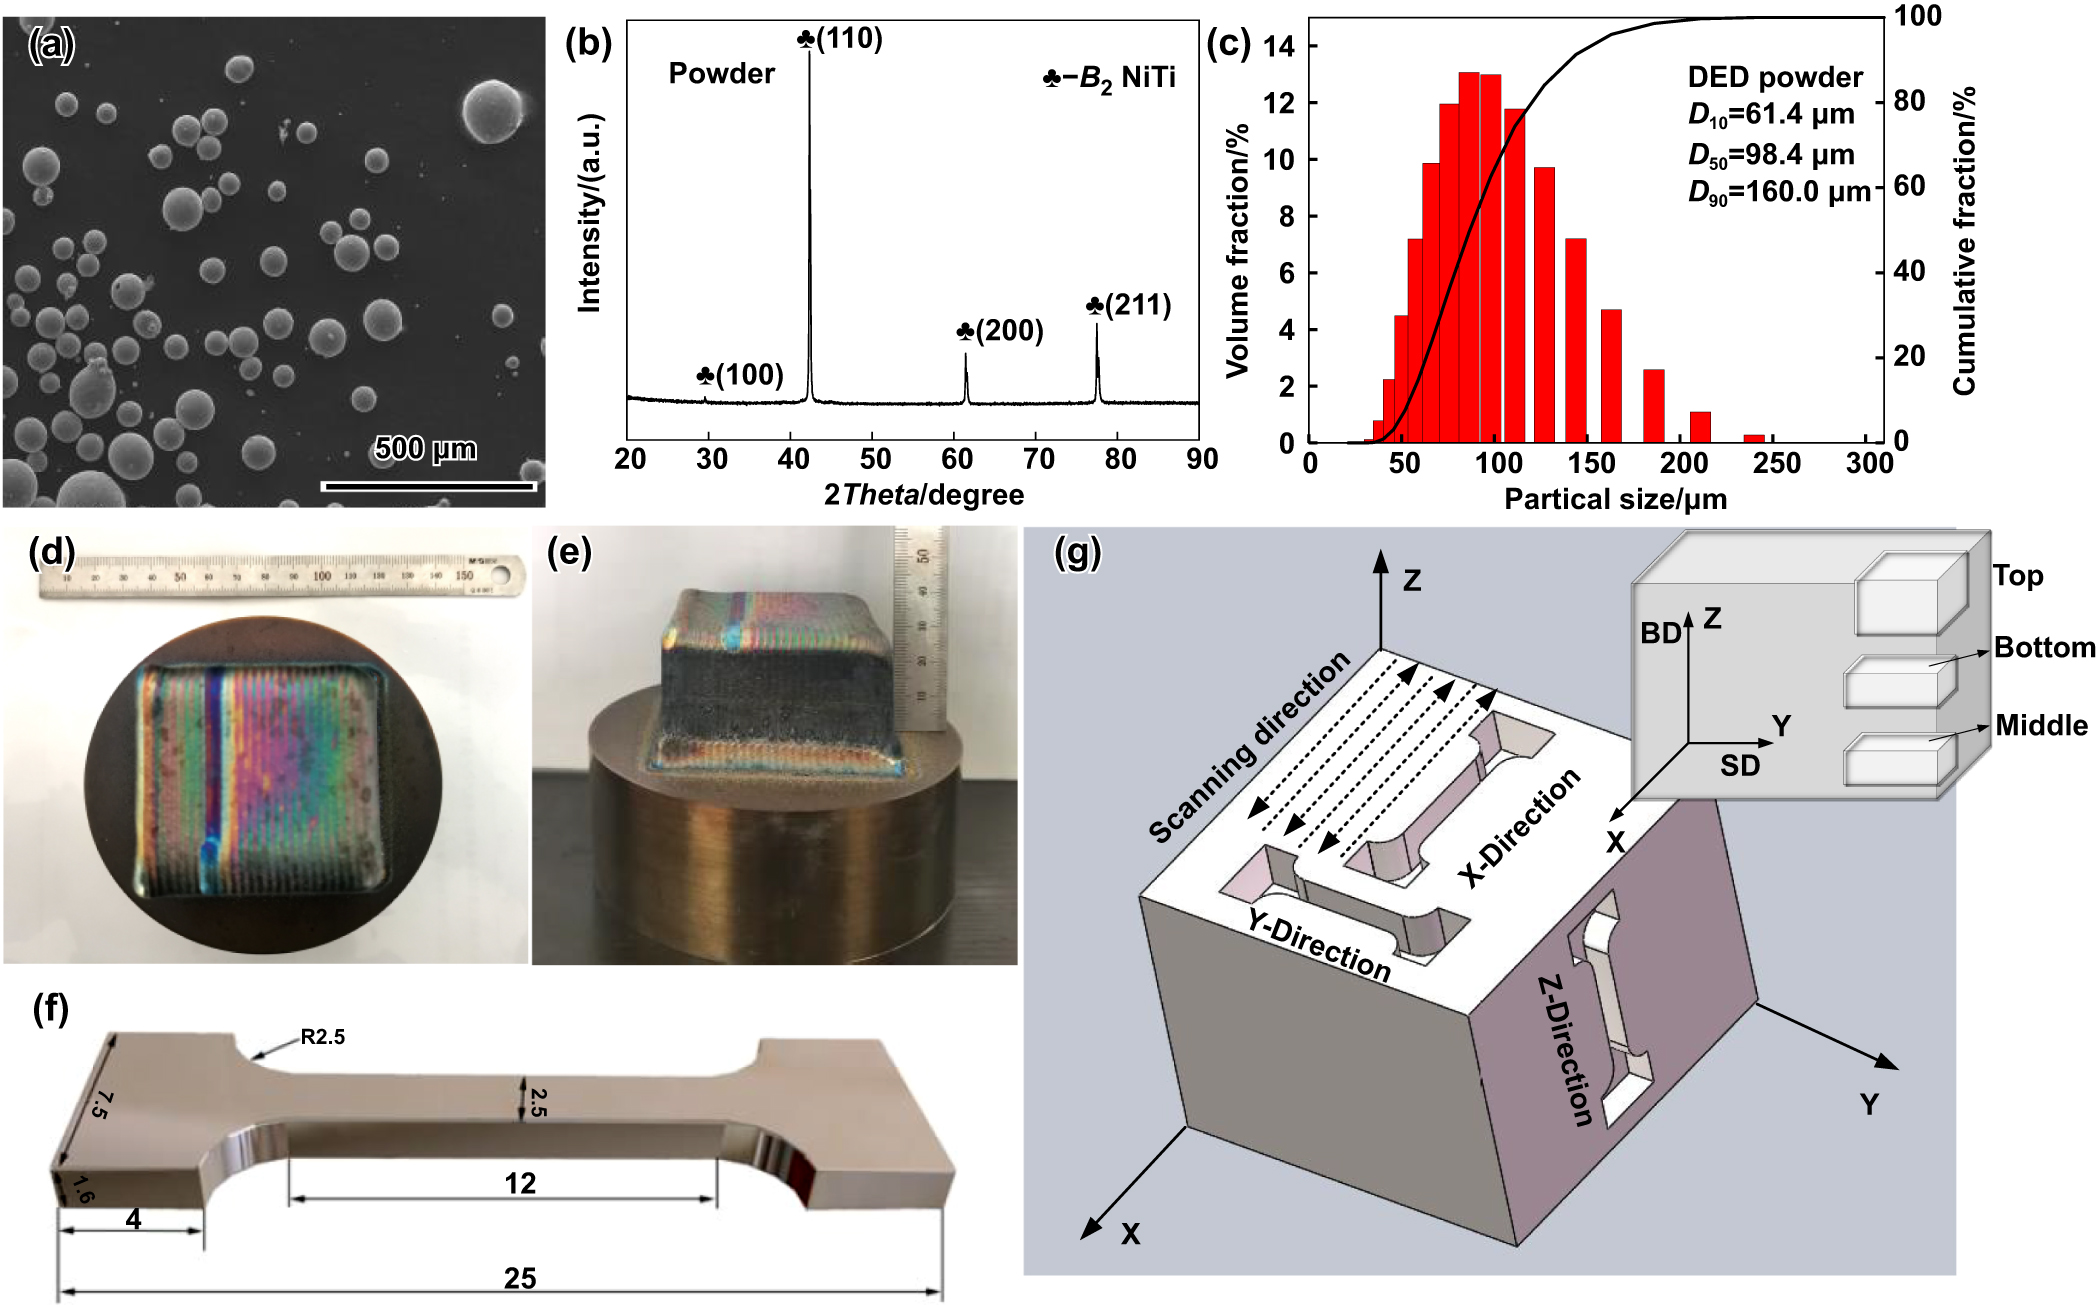
The pre-alloyed Ni51Ti49 at.% powder was prepared by an electrode induction-melting gas atomization technique. The median diameter (D50) of powder was 98.4 μm with a spherical and near-spherical shape (figures 1(a) and (c)), as measured by a laser particle size analyzer (Micro-Plus, England). And the x-ray diffraction (XRD) pattern of the NiTi powder illustrates the phase state is B2 austenite at room temperature (figure 1(b)). The powders were processed via an RC-LDM8060 facility (Zhongkeyuchen, China) equipped with a 2000 W diode fiber laser system and with a 2.5 mm laser spot diameter. During the L-DED process, the Ni51Ti49 at.% bulk was formed on the substrate with the same composition and no preheating. In an argon atmosphere, the oxygen content of the working chamber was controlled below 50 ppm. Argon (99.9% pure) is introduced to ensure that the oxygen content in the working chamber is controlled below 50 ppm. The deposition parameters are as follows: laser power (P) was 1200 W, scanning speed (v) was 600 mm min−1, the hatch spacing (h) was 1 mm, the powder feeding speed was 0.6 r min−1, and the deposition layer thickness (t) was 0.5 mm. The dimension of DED samples was 60 × 60 × 35 mm3 (figures 1(d) and (e)), which is three times the maximum sample size reported [14], to obtain sufficient heat accumulation and distinct heat flow distribution in the sample. The scanning strategy of rotating 0° between adjacent layers was adopted, as shown in figure 1(g). The X and Y directions refer to the samples perpendicular to or parallel to the SD of the building plane, respectively. And the Z-direction means the BD.

Figure 1. Powder raw materials, physical maps and related characterization methods of DED NiTi: (a) powder morphology; (b) x-ray pattern of powder and (c) powder size distribution of the Ni51Ti49 SMA powders; (d) and (e) size and morphology of DEDed NiTi bulk; (f) the dimension of the tensile sample; (g) the scanning strategy of NiTi bulk and the extraction method of tensile samples and EBSD, OM, and SEM samples.
Download figure:
Standard image High-resolution image2.2. Microstructural characterization
The microstructure of LMD samples were characterized by an optical microscope (OM, Leica/MeF3A), a field emission scanning electron microscopy (SEM, FEI, Helios NanoLab 660i), and a transmission electron microscopy (TEM, Talos) equipped with an energy dispersive spectrometer (EDS). The samples were cut, carefully polished for OM observation, and then etched with Kroll's reagent to analyze the microstructure characteristics. For electron backscatter diffraction (EBSD) analysis, the samples were chemically mechanically polished with a silica polishing solution containing 10 vol.% ethanol and 0.02 vol.% sulfuric acid. Then the crystal orientation and grain size were observed using EBSD (FEI NanoLAB, 600i), and the obtained EBSD data was analyzed using TSL OIM Analysis 7 software. TEM samples were prepared by twin-jet electro-polishing using an automatic twin-jet electro-polisher (Tenupol-5, Denmark) inside a mixture solution of 4 vol.% perchloric acid and 96 vol.% ethanol at −30 °C. Then microstructural observations were performed using scanning transmission electron microscopy (STEM) and precipitate composition was determined using EDS.
2.3. Thermomechanical test
The phase composition of NiTi shape memory alloy (SMA) at room temperature was tested using XRD with Cu-Kα radiation (λ = 0.154 06 nm, D/max2550, Japan). Differential scanning calorimetry (DSC, Netzsch 204F1) was used to investigate the phase transformation temperatures of DEDed NiTi at a heating/cooling rate of 10 °C min−1 in an Ar2 atmosphere based on American Society for Testing and Materials (ASTM) F2004-05. The test temperature range is set at −100 °C–100 °C. Dog-bone-shaped NiTi SMA samples (with a gauge section 2.5 mm in width, 1.5 mm in thickness, and 12 mm in length, as shown in figure 1(f)) was cut from X-direction and Y-direction for tensile testing (MTS systems, Eden Prairie, MN, USA). The DIC method (Aramis system, GOM ARAMIS 5M) was used to analyze the local engineering strain during the tensile deformation of Z-direction specimens. The displacement rate of tensile testing was 0.72 mm min−1, and the strain of tensile samples was recorded using a touched extensometer. The tension-recovery cycle test with a control strain/strain increment (1%) was conducted to examine the superelasticity at room temperature.
3. Results
3.1. Microstructural characteristic
The intrinsic microstructure morphology of DED is caused by its process characteristics of stacking layer by layer. The results are shown in figure 2. It depicts that the grain morphology of the DEDed sample shows obvious anisotropy, but it does not change the characteristic grain structure consisting of columnar and equiaxed grains (columnar and equiaxed crystals are marked in black and yellow box lines in figure 2, respectively). Figure 2 shows that equiaxed grains and fine grains are mainly distributed in the boundary of the molten pool (figure 2(b2)), the overlapping area between adjacent layers (figures 2(a2) and (a3)) or adjacent scanning channels (figure 2(c2)). And the columnar grains are mostly distributed in the molten pool, between adjacent layers and adjacent scanning channels (figures 2(a2) and (a3)), and grow along the direction with the largest temperature gradient (figure 2(b4)). The obvious columnar to equiaxial transition (CET, marked in blue box lines) area occurred near the boundary of a molten pool (figures 2(b3), (c3) and (c4)). The fine grains are distributed at the boundary of the remelting area (figures 3 and S4), and the higher temperature of the remelting center promotes grain growth to form equiaxed grains.

Figure 2. Spatial grain morphology of NiTi sample: (a1)–(a4) XOY plane corresponding to building plane, (b1)–(b4) XOZ plane parallel to building direction (BD) and scanning direction (SD), (c1)–(c4) YOZ plane perpendicular to the building plane and scanning direction.
Download figure:
Standard image High-resolution image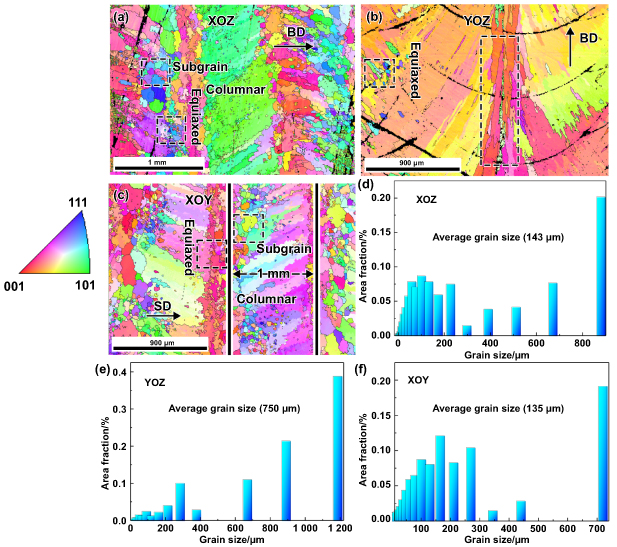
Figure 3. EBSD maps and grain size distribution of NiTi sample: (a)–(c) the IPF maps at XOZ plane, YOZ plane, and XOZ plane, respectively. (d)–(f) Grain size distribution corresponding to different building planes.
Download figure:
Standard image High-resolution imageAs shown in figures 2(a2), (b1) and (c2), the fusion lines were observed and delineated the boundaries of the molten pool and deposited layers. The distance between the two deposited layers is about 0.5 mm (figures 2(a2) and (b1)), corresponding to the designed thickness of the deposited layer and the depth of the molten pool. The spacing between adjacent scanning channels is 1.0 mm, which is marked in figure 2(c2). Due to the influence of the Gaussian heat source, the obvious melting boundary can be distinguished on the XOY plane (figures 2(b1)–(b4)). The circular spot with Gaussian energy distribution is easy to obtain the temperature difference distribution characteristics of the upper and lower surfaces similar to the Gaussian distribution, while the square and rectangular spots with uniform energy distribution are more likely to form uniform temperature difference distribution characteristics of the upper and lower surfaces. The width distribution of the molten pool is discontinuous. However, many corrosion points are caused by the precipitation of particles in the matrix, confusing grain boundaries, and precipitates. Therefore, it is difficult to collect grain size in OM observation.
The IPF diagram of figures 3(a)–(c) clearly shows the grain morphology. It can be found that the grain morphology of the XOY plane (figure 3(a)) and XOZ plane (figure 3(c)) observed by the EBSD method is similar to that observed by OM (figures 2(a1) and (c1)). The grain size distribution of the XOZ plane is 20–700 μm, and the median diameter is 143 μm (figure 3(d)), which is similar to that of the XOY plane with a median diameter of 135 μm (figure 3(f)). Figure 3(e) shows that the grain size distribution of the YOZ plane is 20–1200 μm, the median diameter is 750 μm (columnar grains region), and the grain size and columnar crystal volume ratio of the YOZ plane are significantly larger than those of other surfaces. In addition, as shown in figure 3(b), there is an enhanced texture along the BD on the YOZ plane. There is a penetrating columnar crystal structure across multiple molten pools (figure 3(b)) along the BD, and the length can reach more than 1000 μm.
Figure 4 shows pole figures exported from EBSD data at different planes of the NiTi sample. There only are very weak textures visible at the XOY plane and XOZ plane with a max intensity index of 4.402 and 3.999, respectively. In the XOZ plane (figure 4(a)), the maximum intensity texture is distributed in the projection plane of (100) B2 NiTi with <111> (100) texture. At the XOY plane (figure 4(c)), the max intensity texture is distributed in the projection plane of (111) B2 NiTi with a <110> (111) texture. While at the YOZ plane (figure 4(b)), the growth of columnar crystals along the BD leads to a strong (100) texture, and the maximum intensity index is twice that of the XOY plane and XOZ plane. Interestingly, the texture difference in different planes gives a spatial grain growth pattern, which is very consistent with the previous work reported [13, 25, 35, 36], although the matrix preheating in this study is different from the previous work, similar microstructure and more uneven distribution of precipitates were obtained. It indicates that the effect of preheating on the precipitated particles is greater than that on the microstructure.
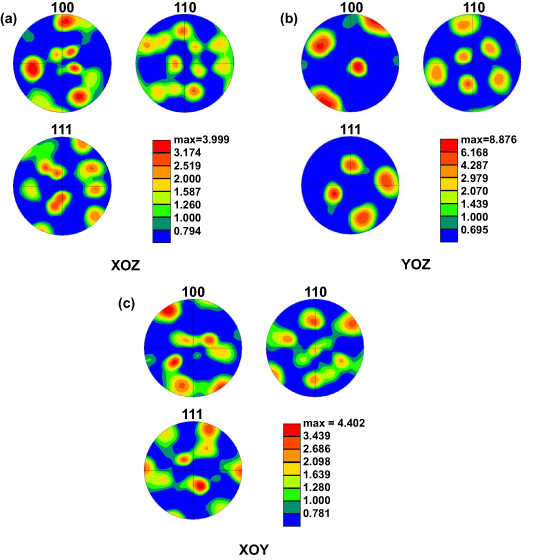
Figure 4. Pole figures at different planes of NiTi sample: (a) at XOZ plane, (b) at YOZ plane, (c) at XOZ plane.
Download figure:
Standard image High-resolution image3.2. Phase characteristics and thermomechanical behavior
Figure 5 shows the XRD patterns of DEDed NiTi specimens on the XOY plane with different Z-heights along the BD. It shows that NiTi bulk at room temperature is mainly composed of Ni4Ti3(P), B19ʹ martensite (M), and B2 austenite (A). Interestingly, the phase composition of the samples along the BD has obvious gradient variation characteristics. Figure 5(a) depicts that with the decrease of the Z-height, the diffraction intensity of the characteristic diffraction peak ((122) plane, red arrow in figure 5(b)) at 2θ = 43.2° in the XRD diffraction pattern gradually increases, corresponding to the increase of the content of Ni4Ti3(P). From bottom to top, the austenite content of the samples increases with the increase of Z-height and it changes from full martensite to full austenite. In addition, for the sample with Z = 10 mm, the volume fraction ratio of martensite to austenite (M/A) is about 1:9, but when Z = 8 mm, the volume ratio is about 6:4. Similarly, the samples with a height above 30 mm (Z > 30 mm) have no visible characteristic diffraction peak of Ni4Ti3. Therefore, the DEDed samples with Z = 10 and Z = 30 mm height were marked. The DEDed NiTi was cut into three parts named the bottom, middle, and top according to the marked Z height, respectively. Subsequent DSC tests, TEM tests, and mechanical tests also follow this rule.
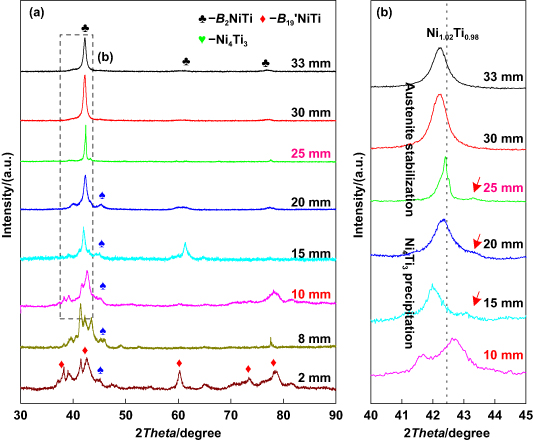
Figure 5. The XRD patterns of DEDed NiTi: (a) at different Z-heights, (b) the local area amplification in figure (a).
Download figure:
Standard image High-resolution imageAs shown in figure 5(b), the (110) B2 diffraction peak of the sample with Z = 15 mm moves to the left since the radius of the Ni atom is smaller than that of the Ti atom and the formation of Ni4Ti3 reduces the Ni-concentration in B2 matrix. As the height increases from Z = 25 mm to Z = 33 mm, the diffraction peak of (110) B2 shifts about 0.5° to the left. According to the Bragg diffraction law, the peak shift to the left means that the lattice constant of samples increases, revealing the austenite stabilization caused by the supersaturated solid solution of Ni in the B2 matrix [37, 38].
Figures 6(a) and (b) depict the DSC curves of the DEDed NiTi samples with different Z-heights. Except for the sample with Z = 33 mm, the samples at other heights show a two-stage forward phase transition of B2-R-B19ʹ during the cooling process and a single reverse phase transition from B19ʹ to B2 during the heating process. It means the effect of Ni4Ti3 on the phase transition behavior in the sample with Z = 33 mm height has disappeared [39]. Figures 6(c) and (d) respectively summarized the forward/reverse martensitic transformation temperature (the martensitic transition started temperature Ms, finished temperature Mf, the austenitic transition started temperature As, and finished temperature Af) and the change of endothermic/exothermic enthalpy of samples with different Z-height. For the samples with Z > 10 mm, both the forward/reverse martensitic transformation temperature and enthalpy decrease with the increase of Z-height. This may be due to the difference in heat accumulation between the three. It is worth noting that Rs and Rf decrease approximately linearly and B2-R phase transition enthalpy decreases with the increase of Z-height, which is mainly affected by Ni content, but insensitive to the coherent stress/strain field caused by Ni4Ti3 nanoprecipitate [40].
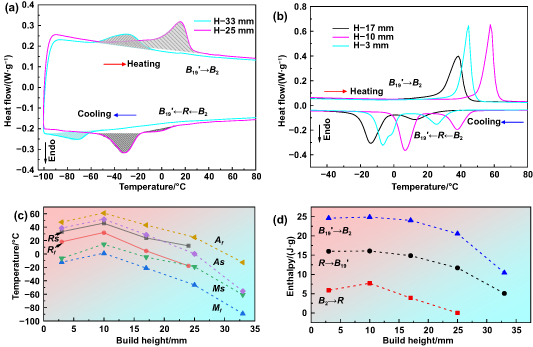
Figure 6. DSC curves and collected data of the NiTi sample at different Z-height: (a) at the top section, (b) at the bottom and middle section, (c) phase forward/reverse transition temperature at different Z-height, (d) phase forward/reverse transition enthalpy at different Z-height.
Download figure:
Standard image High-resolution imageFigure 7 shows the TEM microstructures of different sections of DEDed NiTi. There is the difference in the phase state of the matrix. At the top (figure 7(a1)) and middle (figure 7(b1)), it is a B2 state, and at the bottom (figure 7(c1)), it is a B19ʹ state with a preferred orientation of deformed martensite. And, it was found that the lenticular particles with a length of about 500 nm were much smaller than previously reported [13, 14, 18], and uniformly dispersed in the matrix in the middle part of the sample. The EDS spectra showed that the precipitates were rich in nickel with a Ni:Ti atomic ratio of 4:3, which means that the particles are Ni4Ti3 (figures 7(b5)–(b8)). Even the XRD patterns and DSC results suggest that Ni4Ti3 exists at the bottom section, Ni4Ti3 was not directly found in the TEM observation. After heating, the Ni4Ti3 was detected in the bottom section (figure S1). This phenomenon is due to the martensite producing a crystal orientation shift to adapt to the stress/strain field of Ni4Ti3, resulting in the morphology of Ni4Ti3 being covered by martensite during the B2-R-B19ʹ transition [40, 41].
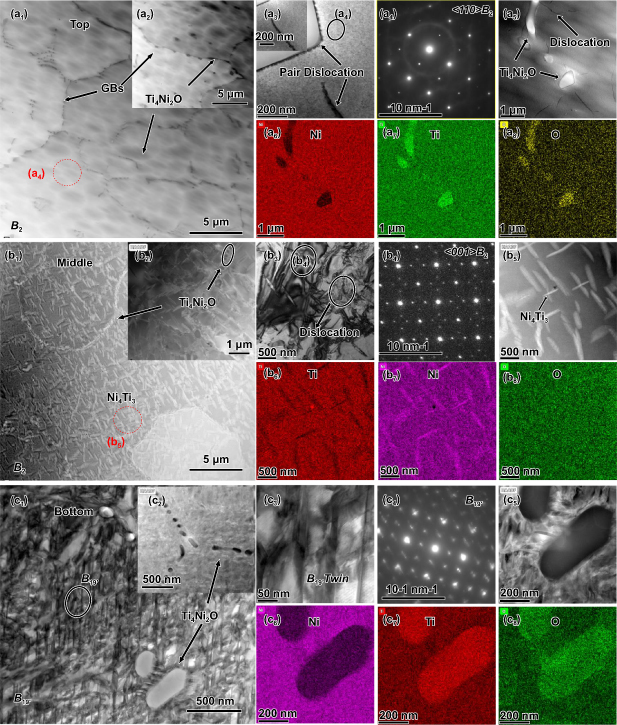
Figure 7. TEM images of NiTi sample at different sections: (a1)–(a8) top section (Z ∼ 32 mm), (b1)–(b8) middle section (Z ∼ 20 mm), (c1)–(c8) bottom section (Z ∼ 10 mm). (a1)–(a2) the bright field images of grains and Ti4Ni2O nanoprecipitate, (a3) dislocation pair, (a4) corresponding selected area electron diffraction (SAED) pattern, (a5)–(a8) DES spectrum corresponding to Ti4Ni2O nanoprecipitate, (b1)–(b2) the bright field images of grains and Ni4Ti3 nanoprecipitate, (b3) dislocations around the Ni4Ti3 nanoprecipitate, (b4) corresponding selected area electron diffraction (SAED) pattern, (b5)–(b8) DES spectrum corresponding to Ni4Ti3 nanoprecipitate, (c1)–(c3) the bright field images of grains, martensite morphology, and Ti4Ni2O nanoprecipitate, (c4) corresponding selected area electron diffraction (SAED) pattern, (c5)–(c8) DES spectrum corresponding to Ti4Ni2O nanoprecipitate.
Download figure:
Standard image High-resolution imageIn addition, the precipitation rich in Ti and O was detected by EDS (figures 7(a5)–(a8) and (c5)–(c8)) is defined as Ti4Ni2OX . These particles are always distributed at grain boundaries and observed in all samples at different heights (figures 7(a2), (b2) and (c2)). This is due to the strong affinity between oxygen and Ti, and the Ti4Ni2O phase is formed in the Ni-rich alloy. The grain boundary is beneficial to nucleation in energy by reducing the interface energy between the precipitated phase and the parent phase. The grain boundary is always used as the location of heterogeneous nucleation in the solid-phase precipitation process [42]. And, dislocation networks and pair dislocations were found at the top section (figure 7(a3)); dislocations distributed around Ni4Ti3 particles were found in the middle section (figure 7(b3)); the martensite phase at the bottom was interrupted by dislocations and Ni4Ti3 (figure 7(c3)). Finally, compared with the electron diffraction patterns shown in figures 7(a4), (b4) and (c4), the crystal state at the top and middle parts is B2 austenite, and the crystal state is B19ʹ martensite. This is consistent with the XRD results in figure 5.
3.3. Mechanical performance
Figure 8 shows the engineering stress–strain curve of DED samples at different Z-heights and different directions. As shown in figure 8(a), it is obvious that the yield strength (defined as σ0.2 ) changes from 120 ± 30 MPa in the bottom section to 570 ± 20 MPa in the top section. There are two intersections in the yield strength of the samples in the X direction and the Y direction (marked with red arrows in figure 8(a)). Interestingly, the two intersections are located in Z ≈ 8 mm and Z ≈ 20 mm, respectively. So, there is a physical mechanism for the interaction of precipitates, phase states, and stress-induced martensite transformation (SIMT) on the anisotropic mechanical performance in the DEDed sample (discussed in section 4.2). The strength of the DEDed samples is relatively stable but much lower than that of the traditional sample [2], which is mainly caused by pore defects (figure 8(b)) and brittle Ti4Ni2OX distribution at grain boundaries (figures 7(a2), (b2) and (c2)).
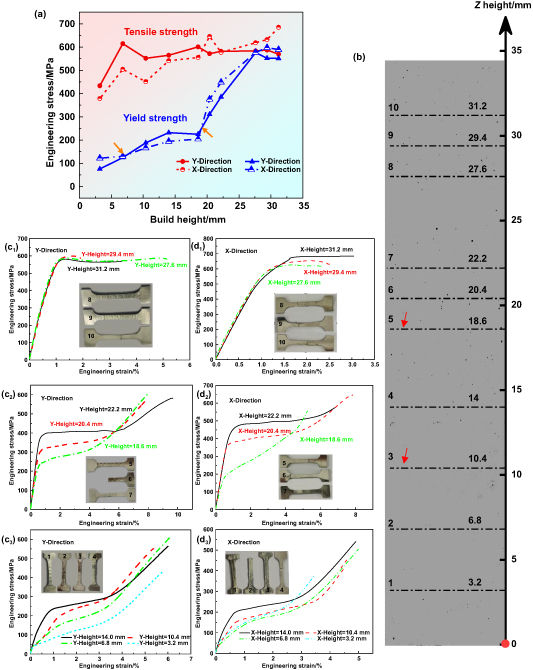
Figure 8. Uniaxial tensile results of NiTi sample at different Z heights and different directions: (a) tensile strength and yield strength (as defined as σ0.2 ) of DEDed NiTi samples at different Z heights, (b) pores distribution of NiTi sample from bottom to top and tensile sample selection, (c1)–(c3) tension result of the X-direction samples at different Z-height, (d1)–(d3) tension result of the Y-direction samples at different Z-height.
Download figure:
Standard image High-resolution imageAlso, the tensile strain–stress curves shown in figures 8(c1)–(c3) and (d1)–(d3) reveal details of the deformation behavior of the DEDed NiTi sample. There is an obvious stress plateau corresponding to SIMT or martensite detwinning during tensile deformation. Figure 8(b) shows that the bottom sample has fewer defects and high density (>99%). Due to the high density of DED NiTi, the influence of chemical composition and phase composition on mechanical properties in this study is much greater than that of pores. Next, we do not consider the effect of pore distribution on the mechanical properties of samples at different building heights.
In the top section (figures 8(c1) and (d1)), the plateau strain is relatively low because the stabilization of austenite corresponding to the DSC result (shown in figure 6(b)) limited the phase transition strain and resulted in a brittle fracture with less than 5% tensile elongation. The supersaturated solid solution of Ni leads to the stabilization of austenite, the body-centered cubic crystal structure of the parent phase is destroyed, the slip system is reduced, and the plasticity is deteriorated. In the bottom section (figures 8(c3) and (d3)), the plateau strain caused by the detwinning of martensite is approximately 4%, which is less than traditional ones [2]. This may be caused by the deformation of martensite or by the combination of the detwinning process of the R phase and B19ʹ phase. In the middle section (figures 8(c2) and (d2)), SIMT allows the best plasticity, with an elongation of 9.6% and a plateau strain of 6% in the Z= 20.4 mm sample. Furthermore, the inclined stress plateau indicates that the deformation of the DEDed NiTi samples is non-uniform, especially for samples with Z heights below 20 mm. It is due to the heterogeneous grain size distribution and the result of prior precipitation of Ni4Ti3 in the columnar grains zone (figure S1). A comparison of the tensile properties in the X and Y directions supports this view, and the underlying physical mechanism will be discussed in section 4.2.
The fracture morphology shown in figure 9 shows that the fracture of the sample presents a mixed morphology of ductile fracture and brittle fracture, with obvious crack steps, river patterns, and dimple characteristics. Figures 9(a1) and (b1) shows that the fracture of the top specimen is a quasi-cleavage fracture. When the crack propagates, it is hindered by the grain boundary, resulting in the tearing of the sample and forming a certain tearing edge. And the cleavage plane is not completely parallel, there are many orientations. The number of dimples in figures 9(a2) and (b2) is more, which corresponds to its better plasticity (figure 8). It can also be seen that in the X and Y directions, the fracture morphology has different characteristics, indicating that the grain morphology and texture characteristics will also affect the tensile properties of DEDed NiTi samples.
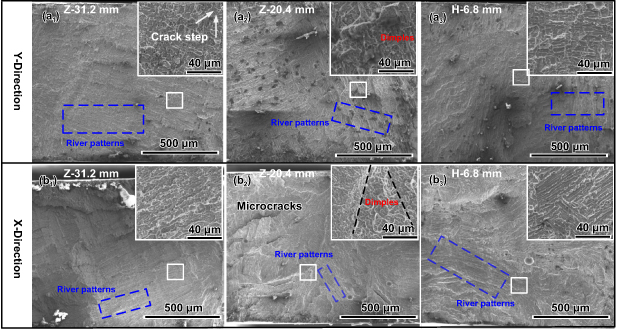
Figure 9. Fracture surface of tensile samples in different directions: (a1)–(a3) at the Y direction with different Z-height, (b1)–(b3) at the X-direction with different Z-height.
Download figure:
Standard image High-resolution imageFigure 10 is the tensile stress–strain curve of the samples in the Z-direction and the local strain corrected by DIC, which intuitively proves that the mechanical properties of the sample have gradient changes along the Z-direction. Based on the deformation behavior of NiTi alloys, there are three stages with the increase of tensile strain in the Z-direction, as shown in figure 10(a). Stage I: elastic deformation stage; it is noteworthy that the elastic deformation of the top part of the sample (Z = 25–33 mm) continued until the end of Stage II. Stage II: (a) bottom section: martensite detwinning and reorientation; (b) top section: elastic deformation; (c) middle section: SIMT. Stage III: (a) plastic deformation; (b) there is still some SIMT due to the presence of retained austenite.
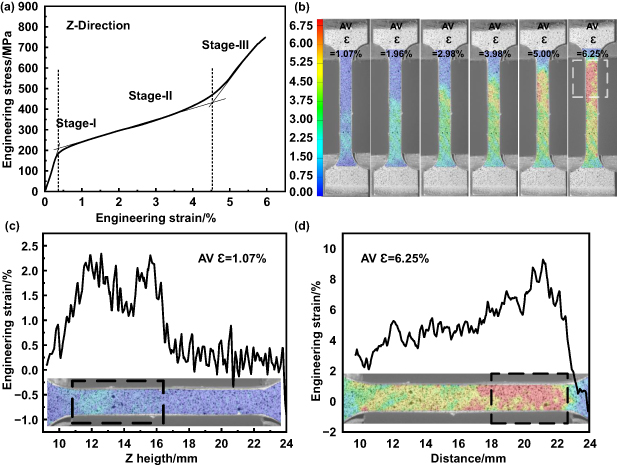
Figure 10. The tensile stress–strain curve of the DED NiTi in the Z-direction and the local strain corrected by DIC: (a) the stress–strain curve, (b) corrected strain using DIC, (c) and (d) local strain at different stain levels.
Download figure:
Standard image High-resolution imageThe tensile test results shown in figure 8 show that the critical stress of SIMT increases with the increase of Z-height. Only when the samples at the bottom produce a large enough deformation, the samples at the bottom will produce SIMT and produce a large local strain. So as shown in the results of local strain corrected by DIC (figures 10 (b–d)), the maximum local strain first occurs at Z ≈ 12 mm, where is martensite, and then shifts to Z ≈ 18–22 mm. The average strain of the sample increases from 1.01% to 6.25%.
To investigate the cyclic stability of the superelastic response and superelasticity of samples with different Z-height, two types of strain-controlled loading and unloading tests were conducted: (1) cyclic loading and unloading for 20 cycles under 2% strain, (2) testing of loading and unloading cycles up to fracture with 1% strain increment. Figure 11(a) shows that the strain of the samples with Z = 33.0 mm and Z = 24.0 mm is almost fully recoverable during the first cycle, indicating that the SIMT is completely reversible. After the first loading/unloading cycle, the residual strain of the sample with Z = 8.6 mm was about 1.4%, showing a significant shape memory effect. Because the tested temperature (∼25 °C) of the sample is lower than its As temperature (∼40 °C) according to the DSC results. In addition, the sample with Z = 33 mm has low stress hysteresis, which is lower than the results reported by Hou et al [12]. The sample with Z = 24.0 mm has a high stress hysteresis, which is close to the results reported by Himoton et al [26]. The result shown in figure 11(b) reflects the cyclic stability of the superelastic response of samples with different Z-height. Here, we only discuss samples presenting superelasticity at room temperature. There is no obvious recoverable strain attenuation after 20 cycles in the Z = 33 mm sample because of its low-stress hysteresis. However, in the sample with Z = 24.0 mm, the recoverable strain decreases with the increase in the number of cycles. The stability of the superelastic response of the sample with Z = 24.0 mm is worse than that of the sample with Z = 33 mm.

Figure 11. The two types of strain-controlled loading and unloading tests of DEDed NiTi: (a) stress–strain curves recorded during the first cycle of loading and unloading for the DEDed NiTi alloys with different Z-height, (b) the relationship between residual strain and cycle index during the 20 cycles of loading and unloading, the relationship between residual strain and tensile strain for (c) samples with different Z-height in the X-direction and (d) for samples with different Z-height in the Y-direction.
Download figure:
Standard image High-resolution imageAs shown in figure 11(c), the sample with Z = 20.4 mm height in the X-direction has 4.2% recoverable strain when the pre-strain is 5%, which is close to the optimal superelasticity of the NiTi prepared by the traditional cast. While the top sample (Z = 33 mm) failed to exhibit the expected superelasticity due to its poor plasticity. The samples in the bottom section (Z = 6.8/12.2 mm) fail to show superelasticity because of their higher As temperature. As shown in figure 11(d), the superelasticity of the sample in the Y direction at the top and middle is worse than that in the X direction. The detailed tensile cycle data is available in the supporting materials (figures S2–S3).
4. Discussion
4.1. Physical metallurgy mechanism of spatial inhomogeneous microstructure
The microstructure heterogeneity of the DEDed NiTi sample comes from two aspects: 1. The non-equilibrium solidification microstructure is caused by the temperature gradient and change of cooling rate in the molten pool. 2. The precipitation gradient distribution is caused by directional heat accumulation in DED. The local remelting and reheating behavior in the molten pool during the DED process promoted the development of local microstructure. For the DEDed NiTi SMAs, as shown in figures 2 and 3, there is always a maximum temperature gradient between adjacent scanning channels, adjacent deposited layers, and the boundary to the center of the molten pool. And columnar crystals grow along the maximum temperature gradient direction. The formation of penetrating columnar crystal structure (∼1000 nm) through multiple molten pools is due to the remelting of the previously deposited layer and the new molten pool as a whole under the action of the laser, and the columnar crystal continues to grow until it passes through multiple molten pools. The fine precipitated particles and remelted columnar grains in the remelted zone act as nucleating agents to promote the nucleation of grains, thus forming fine equiaxed crystals in the DED remelted zone. Due to the continuity of temperature gradient and cooling rate in temporal and spatial, the CET region appears between columnar grains and equiaxed grains. This observation is consistent with previous reports [24, 25, 27, 43], and details of the physical mechanism of solidification have been summarized and reported in our studies.
As far as we know, there is no research to reveal the precipitation of the precipitation during DED continuous deposition. Based on the heat accumulation models reported by Mukherjee et al [30] and Wolff et al [44], and the results reported by Gao and his coworkers [24], the precipitation mechanism has been summarized in figure 12. Firstly, assuming that the temperature probe is located at P shown in figure 12(a), and the thermal history of point P in the DED process is recorded by the temperature probe. It is affected by layer-by-layer continuous reheating. The heat flux function T (x, y, z, t) corresponds to the thermal history of P point changes during deposition, and the function z(t) is easily determined by the scanning speed (in our case), x, and y. Therefore, according to the DebRoy model [30], the continuous time-dependent temperature curve corresponding to the thermal history of point P (the green line in figure 12(b)) is determined. Then, the temperature curve was corrected and put into the aging transition temperature–time diagram (T–T–T diagram) of Ni51Ti SMA reported by Zheng et al [29], according to the results reported by Gao He and his colleagues.
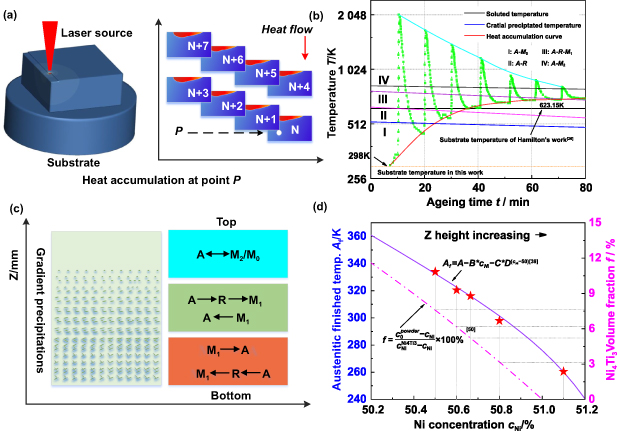
Figure 12. Influence of the heat accumulation during the deposition process: (a) schematic of heat accumulation at point P, (b) temperature at point P and its location in the T–T–T diagram of Ni51Ti [29], (c) schematic of the gradient precipitates distribution and transition path at different section, (d) Ni-concentration and Ni4Ti3 volume fraction corresponding to Af temperature in the matrix.
Download figure:
Standard image High-resolution imageThe peak temperature (cyan line in figure 12(b)) and minimum temperature (red line in figure 12(b)) after each heating/reheating cycle of the heat accumulation curve, solid solution temperature (black line in figure 12(b)) and precipitation formation temperature (blue line in figure 12(b)) were marked. As shown in figure 12(b), there are no Ni4Ti3 precipitates below 500 K and above 833 K (exactly higher than 873 K) in Ni51Ti alloy. It is obvious that only if the peak temperature was lower than the solution temperature and the minimum temperature was higher than the precipitated temperature, Ni4Ti3 could exist in the matrix. Finally, with the time/Z height of the sample increasing, an equilibrium is reached between the input and output heat flows (heat conduction and radiation heat transfer), resulting in a convergence of peak and minimum temperatures. The convergence temperature is always located in the Ni4Ti3 precipitation zone, making the Ni4Ti3 precipitation a time-dependent function, resulting in the Ni4Ti3 gradient distribution and the change of phase transition behavior along the Z-direction shown in figure 12(c). In figures 12(b) and (c), the corresponding regions of the I, II, III, and IV regions occur A-M0, A-R-M1, A-R, and A-M2, respectively. Among them, M0 and M2 are generated by the parent phase solid solution austenite, but the chemical composition corresponding to M2 has changed due to the aging process; M1 is martensite formed by aging-induced R phase transformation.
Now, the formation mechanism of spatial inhomogeneous microstructure is based on the above discussion. It is easy to find that there is no Ni4Ti3 in the top section (about 4 mm thickness) because the reheating during deposition leads to a peak temperature higher than the dissolution temperature of Ni4Ti3, causing the precipitate to melt into the matrix. Compared with the results reported by Hou et al [12, 18], whose results suggested that there is a gradient Ni4Ti3 distribution along the Z direction, Ni4Ti3 was also distributed in the top section. It was found that this difference was mainly caused by the relatively high substrate temperature in their sample. The substrate temperature of 623.15 K is higher than the precipitation temperature of Ni4Ti3, indicating that the matrix is always in the aging state of 623.15 K, which enhances the precipitation of Ni4Ti3 and makes the size of Ni4Ti3 coarser.
In addition, the Ni-concentration and the volume fraction of Ni4Ti3 were calculated according to the Af temperature (figures 6(a) and (b)) corresponding to the samples at different heights. The results are shown in figure 12(d). The Ni-concentration was also calculated by Frenzel et alˈs equation ( , where A, B, C, and D are constant could be seen in [45]), as shown in figure 12(d). The DSC results suggested that the Af temperature of the sample is 260.5 K, corresponding to 51.1 at.% Ni-concentration, which is higher than that of ordinary powder composites. The main reason for this phenomenon is the presence of O as shown in figure 7, that is, Ti4Ni2Ox
increases the Ni concentration in the matrix [45]. Also, the Ni4Ti3 volume fraction could be calculated by Khalil-Allafi et alˈs equation [42] (
, where A, B, C, and D are constant could be seen in [45]), as shown in figure 12(d). The DSC results suggested that the Af temperature of the sample is 260.5 K, corresponding to 51.1 at.% Ni-concentration, which is higher than that of ordinary powder composites. The main reason for this phenomenon is the presence of O as shown in figure 7, that is, Ti4Ni2Ox
increases the Ni concentration in the matrix [45]. Also, the Ni4Ti3 volume fraction could be calculated by Khalil-Allafi et alˈs equation [42] ( ). The Ni4Ti3 volume fraction increased from 3.17% to 7.58%, corresponding to Z = 25 mm and Z = 10 mm respectively, which also agree with the results above discussed.
It is worth noting that some kinetic factors such as dislocation density, grain boundary, and cooling rate are ignored in the discussion [40, 46, 47]. The abnormal decrease of the phase transformation temperature of the specimen at Z = 3.0 mm (figure 6(c)) is due to the increase of dislocation density caused by the maximum temperature gradient and thermal stress obtained in this region in the DED process, which hinders the martensitic transformation. As well as a grain boundary, Hamilton et al revealed that the overlapped area has a smaller precipitates size than the columnar region in DEDed NiTi shape memory alloy (figure 13(c)) [13], which also is found in our samples (figure S1) and it is of great significance for the study of mechanical anisotropy.

Figure 13. Mechanical anisotropy and strengthening mechanism: (a) tensile sample and its corresponding grain morphology, (b) heterogeneous grain size distribution lead to different Hall–Petch strengthening effects of samples in different directions. (c) Heterogeneous precipitate distribution leads to different Orawan strengthening effects of samples in different directions [13]. (d) Martensitic soften effect caused by the variation of the Ni content, (e) the overall strengthening effects of samples in different directions.
Download figure:
Standard image High-resolution image
4.2. The influence of spatial inhomogeneous microstructure on mechanical performance
The contribution of spatial inhomogeneous microstructure to mechanical anisotropy could be mainly concluded into three aspects: (I) the grain boundary spatial distribution resulting in a Hall–Petch effect, (II) the Ni4Ti3 gradient distribution resulting in an Orawan-strengthening effect, as well as (III) the change of Ni-concentration caused by precipitates resulting a martensitic soften effect which allows Clapeyron–Clausius equation (C–C equation).
4.2.1. The Hall–Petch effect.
According to the Hall–Petch relationship, the yield strength increment (σGBS) could be estimated by using averagely weighted mixed grains as followings [48]:

where k is the Hall–Petch constant, fF and fC are the volume fractions of equiaxed grains and column grains, respectively. dF and dC are the average grain sizes of the equiaxed grains and column grains, respectively. When the samples in the X-direction are deformed under external force, there is no doubt that equation (1) is applicable in this situation because the strain is uniform in both the columnar and equiaxed crystal regions. However, when the samples in the Y-direction are deformed, the method for evaluating average grain size needs to be changed because the deformation always occurs in some regions that are easy to deform. According to the Hall–Petch formula, columnar crystals are more easily deformed than equiaxed crystals under the same conditions. It means that the strain is mainly concentrated in the columnar crystal region. In this case, the effective average grain size d is only equal to dC rather than the average weighted grain diameter. The tensile results are shown in figure 8. The yield strength increment ( σ GBS) was evaluated according to the results shown in figure 13(b). The dF and dC are approximately equal to 60 and 280 μm, respectively. And fF and fC were estimated to be 0.4 and 0.6 in the earlier report [48], respectively. In addition, our observation shows that there is no significant difference in grain distribution at different Z-height (figure S5). Therefore, all samples of the same height have yield strength increments ( σ GBS) in different tensile directions due to uneven grain distribution ( σx > σy, figure 8(a)) [13].
4.2.2. The Orawan strengthening effect.
The Ni4Ti3 precipitates in the matrix will hinder the sliding of dislocation, increase the resistance of dislocation movement and improve the strength of the material. The Orawan strengthen equation is shown as follows [48]:
where M, G, b, and v are material constants, R is the radius of precipitates, and λ is precipitate spacings ( , where t is the thickness of Ni4Ti3 [49]). According to the equation,
σ
OR is proportional to ln(R)/λ. The results shown in figure 12(c) reveal that the ln(R)/λ increases with the decrease of Z height. In this way, the Orawan strengthening effect along the Z direction is determined qualitatively. In previous work, Bimber et al and Oliveira found that the size and number of precipitated phases in the DEDed NiTi bulk increased far from the boundary [13, 34], as shown in figure 13(c). Columnar crystals exist far away from the interface region, and no remelting or obvious reheating occurs during the deposition process. In addition, the rapid solidification rate of the interface region also prevents the precipitation of the second phase. In other words, the Ni4Ti3 precipitate is preferentially formed in the columnar crystal region. This will lead to different strengthening effects, and the σOR of the sample in the Y direction is higher than that in the X direction.
, where t is the thickness of Ni4Ti3 [49]). According to the equation,
σ
OR is proportional to ln(R)/λ. The results shown in figure 12(c) reveal that the ln(R)/λ increases with the decrease of Z height. In this way, the Orawan strengthening effect along the Z direction is determined qualitatively. In previous work, Bimber et al and Oliveira found that the size and number of precipitated phases in the DEDed NiTi bulk increased far from the boundary [13, 34], as shown in figure 13(c). Columnar crystals exist far away from the interface region, and no remelting or obvious reheating occurs during the deposition process. In addition, the rapid solidification rate of the interface region also prevents the precipitation of the second phase. In other words, the Ni4Ti3 precipitate is preferentially formed in the columnar crystal region. This will lead to different strengthening effects, and the σOR of the sample in the Y direction is higher than that in the X direction.
4.2.3. The martensitic soften effect.
An effective method to estimate the effect of stress on martensitic transformation uses the Clausius–Clapeyron relationship [2]. The relationship of uniaxial stress is written as follows:
where σ is uniaxial stress, T is equilibrium temperature,  is the transformation strain,
  the transformation entropy per unit volume, and
  is the transformation enthalpy per unit volume. Otsuka et al [2] suggested that the T may be applied for the Ms or Af temperatures as well if the driving force to start the transformation is independent of temperature and stress. Our tensile test satisfied this situation well and the Af was applied to analyze the influence of the martensitic soften effect in the DEDed NiTi.
As shown in figure 13(d), the  is equal to −5.3 MPa K−1 in our case. It is very close to the casted NiTi reported in [2]. DSC result shows the Af increment is beyond 70 K and the Af temperature increases from −12.65 °C to 60.35 °C with the Z height changing from Z = 10 mm to Z = 33 mm, which means the increment of critical stress on martensitic transformation is achieved approximately 371 MPa. This result reveals that the martensitic soften effect is the dominant factor that makes the gradient mechanical performance in the Z-direction much stronger than the anisotropic mechanical performance between the X-direction and Y-direction.
4.2.4. Interaction between Ni4Ti3 strengthening and SIMT soften.
Based on the above discussion, it is obvious that Ni4Ti3 precipitation hinders the movement of dislocations resulting in an Orawan strengthening effect. Meanwhile, the decreasing of Ni-concentration increases the Af temperature resulting in a martensitic softening effect. Interestingly, the interaction between Ni4Ti3 strengthening and SIMT softening makes the yield strength between the X-direction and Y-direction at the same Z height a little different because the Ni4Ti3 precipitates before precipitating at columnar grains.
As shown in figure 8(a), the intersection point of yield strength of the X-direction specimen and Y-direction specimen is Z = 8 mm and Z = 20 mm, respectively. There are no precipitated particles in the samples with Z > 30 mm. Due to the Hall–Petch effect, the intensity of the samples in the X direction is greater than that in the Y direction. With the decrease of the building height, the supersaturated solid solution Ni in the matrix gradually precipitates in the form of Ni4Ti3, but it hardly causes a decrease in the yield strength of the sample. This shows that the precipitation of Ni4Ti3 does not lead to a significant decrease in the critical stress of SIMT, but can improve the strength of the matrix. In traditional manufacturing, this is always used to strengthen Ni-rich NiTi shape memory alloys by aging. However, in the range of 20 mm < Z < 30 mm, with the precipitation of Ni4Ti3, the softening effect caused by the decrease of Ni concentration is greater than the Orawan strengthening effect caused by precipitation. So as the building height decreases, the yield strength of the samples gradually decreases. And because of the preferential precipitation of precipitated particles in the columnar crystal region, resulting in the Orawan precipitation strengthening effect of the X-direction sample is much smaller than the samples in the Y-direction. And the yield strength of the samples in the X direction decreases faster. Therefore, with the increase of the number and size of Ni4Ti3 in the equiaxed crystals zone, in the range of 9 mm < Z < 20 mm, the strengthening effect of the sample caused by the precipitation in the X direction is greater. The softening effect and strengthening effect in the columnar crystal region first reach equilibrium and the yield strength of the Y-direction samples decrease faster than that of the X-direction samples. Therefore, when the building height Z < 8 mm, the yield strength in the X direction is gradually higher than that of samples in the Y direction. The specimen at the Z < 10 mm zone, the Af temperature is beyond room temperature, and the deformation mainly depends on the martensitic de-twinning process. The texture, precipitates, and dislocations influence this process, which is beyond this discussion. Overall, these effects on yield stress have been shown in figure 13(e), which gives an intuitive understanding of the differences in gradient mechanical properties along the Z direction.
4.3. The influence of spatial inhomogeneous Ni4Ti3 precipitates distribution on superelasticity
The functional properties of NiTi SMAs are related to their thermoelastic martensitic transition, resulting in the stress–strain curve as a function of temperature. There is a necessary condition for superelasticity is that the tested temperature is higher than Af [2]. As shown in figure 11(a), the sample in Z = 8.6 mm lost its superelasticity because its Af temperature is beyond room temperature. The stress hysteresis of the Z = 20.4 mm sample is much higher than the Z = 33.0 mm sample. The stress hysteresis reflects the phase transition resistance during forward and reverses martensitic transition. For the sample with Z = 33.0 mm, XRD and DSC results reveal that the supersaturated Ni dissolves into the matrix, which is caused by the high cooling rate of the DED process. It also results in the decrease of the B2 crystal constant and the increase of martensitic transformation entropy ( ). Zhu et al [40, 45] showed that the
  decreases with the increase of Ni content in the binary near-equiatomic NiTi alloy, which is attributed to the destability/stability of B19ʹ martensite/B2 austenite. The destability of martensite is accompanied by a slight decrease in the angle
  , which makes the lattice geometry of B19ʹ martensite closer to that of B2 austenite, thereby reducing the dissipated energy of the fully reversible process (A-M-A) (the area surrounded by the stress–strain curve). Interestingly, our results supported this view and were very close to the results reported by Hou et al [12]. Meanwhile, for the sample with Z = 20.4 mm, the precipitation of Ni4Ti3 reduces the Ni content in the matrix and increases the lattice constant of B2 austenite. This is because the Ti atom with a larger radius replaces the Ni-antisite defect caused by the increase in Ni concentration [38]. And it makes the geometry of the crystal lattice of B19ʹ martensite more stable and increases the dissipated energy (the area surrounded by the stress–strain curve) during the forward/reverse martensitic transition. Besides, a stress field formed around the Ni4Ti3 particles is a resistance to reverse martensitic transition, increasing the stress hysteresis well [40].
The stability of superelasticity is the result of the confrontation between plastic deformation and reversible martensitic transformation during tensile loading and unloading cycles [2]. So the gradient Ni4Ti3 precipitation has a big influence on the stability of superelasticity. For the Z = 33 mm sample with excellent superelastic stability, the stabilization of B2 austenite well strengthened the matrix and hindered the dislocation slip even without Ni4Ti3 precipitation. However, with the increase of strain, the destabilization of B19ʹ martensite and dislocation pair (figure 7(a3)) disturbs this balance. Meanwhile, with the decrease of Z height, Ni4Ti3 precipitates, and the dislocation is locked around Ni4Ti3 to form a stress/strain field (figure 7(b3)). Lu et al [50]suggested that the degree of the stress/strain field increased with decreasing the size of Ni4Ti3 because of the coherent interface between the crystal of Ni4Ti3 and the crystal of the B2 matrix. Taking this view into our case, it means that both the functional properties and its stability are affected by the gradient precipitation. As shown in figures 11(b) and (c), it is exactly found that the functional stability of the Z = 20.4 mm sample was relatively poor, but the maximum recovery strain and best plasticity were got in the Z = 20.4 mm sample.
It should be noted the functional properties also show an anisotropic performance. For example, the residual strain of the X-direction sample is lower than that of the Y-direction sample under the same pre-strain, which is mainly due to the high local strain in the columnar crystal region caused by the Hall–Petch effect. The superelasticity of the Y-directional sample is mainly affected by the prior precipitation of Ni4Ti3 in the columnar grain, while the limitation of superelasticity of the Z-directional sample is caused by the nonuniform local deformation resulting from gradient distribution along the Z direction. Since the dislocation density cannot be accurately and quantitatively measured, the study does not discuss its influence [2]. This is a systematic and comprehensive work, but also a complex work, which requires more researchers involved to improve its superelasticity and promote its industrial application. In general, based on previous work, the functional characteristics of DED NiTi specimens are comprehensively studied in this paper, and the engineering stress–strain curves at different Z heights are given, which are expected to be used for future research and work.
5. Conclusion
In summary, we systematically reviewed the microstructure, phase transformation characteristics, and mechanical properties of NiTi bulks prepared by L-DED. The Ni51Ti49 at.% bulk with a large enough volume was successfully fabricated on the same composition NiTi substrate without preheating. The formation mechanism of intrinsic spatial heterogeneity of microstructure and mechanical properties of NiTi are summarized. It is found that the spatial heterogeneous distribution of grains and precipitates makes it have obvious anisotropy and gradient changes in mechanical properties and functional properties. The main conclusions are as follows:
- 1.The local reheating and remelting behavior during the DED process results in the spatial heterogeneous distribution of equiaxed and columnar crystals and the difference in the volume fraction of columnar crystals on different building planes.
- 2.The equiaxed grains and fine grains with an average diameter of 60 μm always distributed in the boundary of the molten pool, the overlapping area between adjacent layers or adjacent scanning channels. And the columnar grains with an average diameter of 280 μm are mostly distributed in the molten pool, between adjacent layers and adjacent scanning channels, and grow along the direction with the largest temperature gradient. And the CET area occurred between the columnar grain zone and the equiaxed grain zone. The YOZ plane is almost entirely composed of columnar crystals with a strong (100) texture.
- 3.The Ni4Ti3 precipitation caused by heat accumulation during continuous deposition is a time-dependent function, resulting in a Ni4Ti3 gradient distribution along the Z direction, and Ni4Ti3 always preferentially precipitates in the columnar crystal region. The gradient distribution of Ni4Ti3 leads to the gradient changes of the forward/reverse martensitic transformation temperature, the enthalpy of endothermic/exothermic, and the transformation behavior of DEDed NiTi.
- 4.With the decrease in building height, Af decreases from −12.65 °C (Z = 33 mm) to 60.35 °C (Z = 10 mm), and the enthalpy of endothermic/exothermic decreases. Except for a single B2-B19ʹ forward transition in the Z = 33 mm sample, all samples underwent a B2-R-B19ʹ two-step forward transition and a single reverse transition.
- 5.The contribution of spatial inhomogeneous microstructure to mechanical anisotropy could be mainly concluded into three aspects: (I) the grain boundary spatial heterogeneous distribution and Ni4Ti3 always preferentially precipitates in the columnar crystal region resulting in a mechanical anisotropy between X-direction and Y-direction, (II) the Ni4Ti3 gradient distribution resulting in gradient mechanical performance along the Z direction, (III) the change of Ni-concentration caused by precipitates resulting a martensitic soften effect which is the dominant factor of the gradient mechanical performance along the Z direction.
- 6.The Z = 33 mm and Z = 24 mm specimens show obvious superelasticity, and the unloaded specimens recover to the initial shape after 2% deformation. The bottom sample (Z < 10 mm) exhibits a significant shape memory effect. The Z = 33 mm sample has a low-stress hysteresis and excellent stability at 2% strain. This is due to the supersaturated solid solution and austenite stabilization introduced by the extremely fast cooling rate of the top sample. The sample in the Z = 20.4 mm height has the best plasticity, with an elongation of 9.6% and a plateau strain of 6%. When the pre-strain is 5%, it shows the best recoverable strain of 4.2%.
Acknowledgments
The authors wish to acknowledge the financial support of the Hunan Innovation Platform and Talent Plan (2022RC3033), Natural Science Foundation of Shandong Province (ZR2020ZD04), and Ganzhou Science and Technology Planning Project (Grant No. Ganshikefa[2019]60).
Supplementary data (6.5 MB PDF)
Supplementary data (1.2 MB PDF)