
Abstract
Particulate-reinforced metal matrix composites (PRMMCs) are difficult to machine due to the inclusion of hard, brittle reinforcing particles. Existing experimental investigations rarely reveal the complex material removal mechanisms (MRMs) involved in the machining of PRMMCs. This paper develops a three-dimensional (3D) microstructure-based model for investigating the MRM and surface integrity of machined PRMMCs. To accurately mimic the actual microstructure of a PRMMC, polyhedrons were randomly distributed inside the matrix to represent irregular SiC particles. Particle fracture and matrix deformation and failure were taken into account. For the model's capability comparison, a two-dimensional (2D) analysis was also conducted. Relevant cutting experiments showed that the established 3D model accurately predicted the material removal, chip morphology, machined surface finish, and cutting forces. It was found that the matrix-particle-tool interactions led to particle fractures, mainly in the primary shear and secondary deformation zones along the cutting path and beneath the machined surface. Particle fracture and dilodegment greatly influences the quality of a machined surface. It was also found that although a 2D model can reflect certain material removal features, its ability to predict microstructural variation is limited.
Export citation and abstract BibTeX RIS

Original content from this work may be used under the terms of the Creative Commons Attribution 3.0 license. Any further distribution of this work must maintain attribution to the author(s) and the title of the work, journal citation and DOI.
1. Introduction
Particulate-reinforced metal matrix composites (PRMMCs) are engineered combinations of two or more constituent materials, which includes a metal matrix, such as Al, Mg, Ti, etc, and reinforcements composed of hard, brittle particles, such as SiC, B4C, Al2O3, SiO2, AlN, SiN4, and Si [1, 2]. PRMMCs have many advantages over monolithic materials, including higher specific stiffness and strength, modulus, improved thermal stability, and greater wear resistance. The engineering properties of PRMMCs can be tailored by adjusting the type, volume, and distribution of the reinforcements [3]. However, PRMMCs are difficult to be machined because of the hard and brittle nature of the reinforcements. During machining, the complicated particle-matrix-tool interactions may cause problems, such as particle fracture, matrix tearing, particle-matrix debonding, and severe wear of cutting tools [4].
Numerous experimental investigations have been conducted to identify the factors that influence the machining performances of PRMMCs. However, understanding of the MRM remains insufficient due to limitations in observing the dynamic processes during the machining experiments [5–8]. To solve this problem, numerical simulations, such as those utilizing the finite element method (FEM), have been extensively used. These simulations follow two general approaches similar to those used for cutting fibre-reinforced composites [9, 10]. One approach uses equivalent homogeneous material (EHM) modelling, which treats a PRMMC as an isotropic and homogeneous material by averaging its mechanical properties from the particle and matrix phases [11]. The other approach involves multi-phase (MP) modelling, which deals with the particles and matrix individually to carry out a more precise treatment of the PRMMC microstructure [12]. The EHM modelling has been used in both the two-dimensional (2D) and three-dimensional (3D) cutting simulations. Although EHM is easier to model and provides accurate predictions on cutting forces, it does not of reveal details about tool-particle interactions or the surface integrity of a machined PRMMC component [13–15]. Conversely, MP modelling explores both the material removal and surface generation processes, such as the formation of surface cavitation caused by particle fracture and dislodgement as well as by particle-matrix debonding. To reduce computing costs, previous numerical works utilizing the MP approach on PRMMC machining primarily focused on 2D orthogonal cutting processes under the plane-strain assumption. In these works, particles were either replaced by simplified geometries, such as round and square [12, 16–18], or represented by polygons [19–21]. These works demonstrated the mechanisms of particle cracking, chip formation, machined surface generation, and edge defect formation in machining PRMMCs. The tool-particle, tool-matrix and matrix-particle interactions during the machining process were analysed. The effects of particle morphology and distribution on the machining performance were discussed. However, a 2D model cannot describe the actual microstructure of a PRMMC. Although it may offer a qualitative understanding of the overall cutting force variation, it cannot provide a reliable picture of machining-induced surface integrity. To avoid the limitations of 2D modelling, 3D microstructure-based models were developed to investigate the machining process of PRMMCs [22]. Nevertheless, because of the modelling difficulties and high computing cost, particles in these works were simplified to regularly distributed spheres, which is inconsistent with a real composite structure.
This paper aims to develop a 3D microstructure-based model with randomly distributed polyhedron SiC particles in an A359 matrix to investigate material removal mechanisms (MRMs) and surface integrity. Particle fracture and matrix deformation and failure were taken into account. Relevant cutting experiments were performed to assess the model prediction in terms of chip morphology, surface finish, and cutting forces.
2. Micromechanical modelling
2.1. Particle characterization and modelling
In this study, an A359/SiC composite (supplied by Rio Tinto) with a volume fraction of SiC particles of 20% and an average particle size of 10 μm was used as the material example. The microstructure is shown in figure 1. The chemical content of the matrix alloy (A359) is listed in table 1 [23].

Figure 1. The microstructure of the A359/SiC composite used in the machining test.
Download figure:
Standard image High-resolution imageTable 1. Chemical composition of A359 (wt%).
| Si | Fe | Cu | Mn | Mg | Ti | Zn | Other |
|---|---|---|---|---|---|---|---|
| 8.5 ∼ 9.5 | ∼0.2 | ∼0.2 | ∼0.1 | 0.45 ∼ 0.65 | ∼0.2 | ∼0.1 | ∼0.15 |
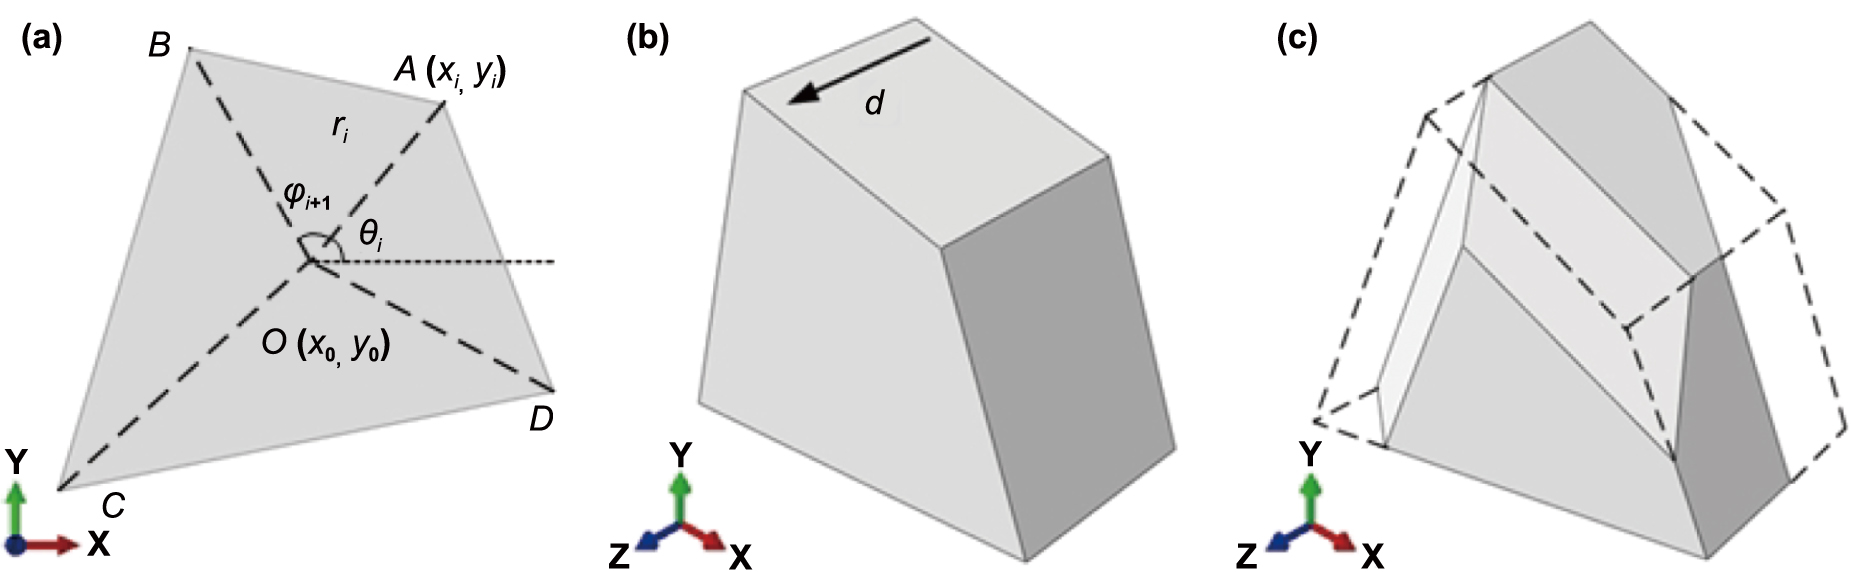
Polyhedrons were used to mimic the actual morphology of the irregular SiC particles in the modelling. Figure 2 shows the modelling procedure of the polyhedral particles. First, a 2D polygon was created by the following equations [24], shown in figure 2(a).
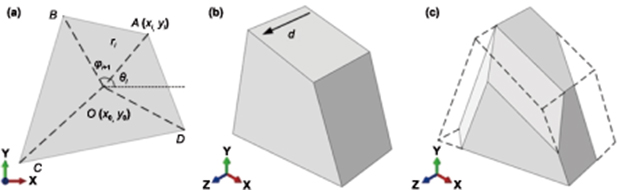
Figure 2. Modelling process of an SiC particle: (a) 2D modelling, (b) extrusion, and (c) 3D polyhedron particle.
Download figure:
Standard image High-resolution imagewhere L0 is the average radius; L1 is the amplitude; μi
is a random number ranging from 0 to 1; α is the initial phase angle, which is used to determine the initial orientation of the particle; k is the total number of edges contained in one polygon; and  is the subtended angle. The corresponding coordinates of the vertices are defined by:
The generated polygon was extruded along the Z-axis for a certain distance (particle size), d, to form a 3D geometry (figure 2(b)). The coordinates of the newly generated vertices on the Z-axis were defined by:

From this extruded geometry, several randomly selected edges were cut short, forming the 3D polyhedron particle (figure 2(c)). The polyhedron particle was rotated along the x- and y-axes to obtain a random orientation. The final coordinates of the vertices ( ,
,  ,
,  ) were transferred from the particle's original position (xi, yi, zi
) by:
) were transferred from the particle's original position (xi, yi, zi
) by:
where αx and αy are the rotating angles in x- and y-axes, respectively.
Finally, all the generated polyhedron particles were randomly placed in the matrix. An overlapping check was conducted to prevent interference with these particles. In order to minimize the effects of the model boundaries on the numerical simulation and maintain a high computing efficiency, the length, height, and width of model were set to 120 μm, 60 μm, and 30 μm, respectively. Figure 3(a) shows the generated geometrical model of the A359/SiC composite. The number of the particles was 82 and the volume fraction was 20.5%. Figure 3(b) shows the microstructure of a cross-section (z = 16 μm) of the established model.
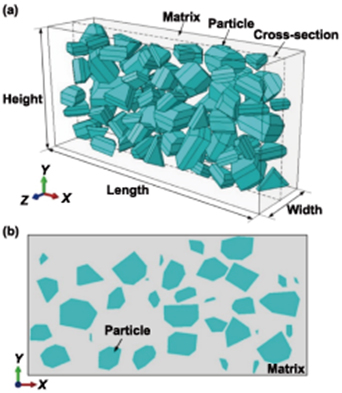
Figure 3. Geometrical model of the A359/SiC composite: (a) 3D model and (b) the microstructure of a cross-section at z = 16 μm.
Download figure:
Standard image High-resolution image2.2. Material property modelling
The Johnson–Cook (J–C) constitutive model has been widely used to describe the elastoplastic behaviour of ductile materials [25]. However, when the strain of A359 exceeds a certain value (≈0.3), its flow stress begins to decrease with the increasing strain. When the strain rate is higher than 103 s−1, the linear assumption of the strain rate hardening in the J–C model no longer applies to A359 [26]. Therefore, the following constitutive model with modified strain hardening and strain rate sensitivity functions is applied [26, 27]:
where  is the effective stress; A and B are the initial yield stress and hardening modulus, respectively; n is the coefficient of hardening; a is a corrected coefficient for strain hardening; c (= 0.45) is the coefficient of strain rate sensitivity;
  and
and  are the equivalent plastic strain and strain rate; 0 (= 1.47 × 10⁵ s−1) is the reference plastic strain rate [26]. Temperature increases were not considered in this study.
The J–C damage model was introduced to describe the fracture behaviour of A359, defined by [28]:

Fracture occurs once D reaches the value of 1;  is the increment of equivalent plastic strain and
  is the equivalent strain at failure, which is calculated by:
where Di
(i= 1, 2,...4) are constants depending on the material properties; σ* is the stress triaxiality; equals the ratio of hydrostatic pressure to von Mises equivalent stress; and  (=10–3 s−1) is the reference strain rate at failure.
To obtain the accurate simulation parameters of A359, standard (ASTM E9) compression tests under the quasi-static state (strain rate = 0.001 s−1) were conducted on an Instron 3369 universal testing machine to calibrate the initial yield stress A, hardening modulus B, the coefficient of hardening n, and the corrected coefficient of strain hardening a. Quasi-static tension tests (strain rate = 0.001 s−1) with smooth and pre-notched (notched radius of 1.5, 2.5 and 5 mm) samples were also conducted to calculated the damage constants D1, D2 and D3. The effect of strain rate on the material damage was not considered in the study. The results are listed in table 2. The material constitutive and damage models were incorporated into ABAQUS/Explicit by a VUMAT subroutine [19].
Table 2. Simulation parameters of A359.
| A (MPa) | B (MPa) | n | a | D1 | D2 | D3 | D4 |
|---|---|---|---|---|---|---|---|
| 83.1 | 457.8 | 0.416 | 0.791 | 0.004 | 0.237 | −2.775 | 0 |
To describe the elastic and brittle fracture of an SiC particle, a simplified Rankine criterion based on a Mode I fracture was applied to detect crack initiation. Particle cracking occurs when the maximum principal stress in the particle reaches its tensile strength σt . The fracture energy cracking criterion, in which the brittle behaviour is characterized by a stress-displacement response, was used to describe the particle post-failure behaviour [29, 30]. The normal crack displacement (un ), at which the complete loss of strength takes place, is calculated by:
where  is the energy required to open a unit area of a Mode I crack.
where KIC and E' are the fracture toughness and effective Young's modulus of SiC, respectively. The shear performance was also considered by reducing the shear modulus during crack opening, according to the Mode II fracture. To this end, shear modulus  is defined as a fraction of the uncracked shear modulus G by [30, 31]:
where  is the crack opening strain, and
  and
and  are material parameters. For an SiC particle,
  = 0.02,
  = 0.2, and
  = 2 [31]. The other material properties are detailed in table 3 [11, 32].
Table 3. Material properties.
| Material | A359/SiC | A359 | SiC |
|---|---|---|---|
| Density (g cm−3), ρ | 2.77 | 2.67 | 3.21 |
| Young's modulus (GPa), E | 98.6 | 73.9 | 410 |
| Poisson's ratio, ν | 0.26 | 0.33 | 0.14 |
| Fracture toughness (Mpa m1/2), KIC | — | — | 4.60 |
| Tensile strength (MPa), σt | — | — | 300 |
| Volume fraction (%), Vf | 20 | — | — |
| Particle size (μm), d | — | — | 6 ∼ 18 |
The high Si content in the A359 alloy prevents the dissociation of SiC into molten Al, which effectively reduces the precipitation of undesired aluminium carbide (Al4C3) at the matrix-particle interface, leading to a very high bonding strength [33, 34]. Therefore, an adhesion interface was used in this study (i.e. the matrix and particles were tied together).
3. Simulation and experimental conditions
Figure 4(a) shows the 3D cutting model that combines MP and EHM modelling. The MP layer was applied at the primary interaction zone in front of the cutting tool to investigate the tool-matrix-particle interactions during cutting process. Quadratic Tet elements (C3D10M) were used in the upper area of the matrix to increase the simulation's accuracy. Linear Tet elements (C3D4) were used in the lower area to reduce computing cost. To avoid the mesh size effect, meshes of the matrix model were refined to 1.5 μm. Linear Hex elements (C3D8R) with an average size of 1.5 μm were used at the particles. For the sake of maintaining computational efficiency without sacrificing generalizability, an EHM layer was used for the rest of the model. The length, height, and width of the EHM layer were 240 μm, 140 μm, and 30 μm, respectively. The cutting tool was regarded as a rigid body and temperature increases were not considered. The cutting conditions are listed in table 4.

Figure 4. Microstructure-based FE models with polygon particles: (a) 3D model and (b) 2D model.
Download figure:
Standard image High-resolution imageTable 4. Cutting conditions.
| Parameters | Values |
|---|---|
| Cutting speed (m min−1) | 100 |
| Cutting depth (μm) | 25 |
| Cutting edge radius (μm) | 12.4 |
| Rake angle (°) | 7 |
| Flank angle (°) | 5.3 |
As a comparison, a 2D cutting model (figure 4(b)) was created with the same microstructure shown in figure 3(b). The cutting conditions for these two models are listed in table 4.
To assess the numerical results, cutting experiments on the A359/SiC were conducted on a Mori Seki MT2000a1 SZ multi-axis turning centre as shown in figure 5. The cylindrical workpiece had a 63 mm diameter and 2 mm wide step. Diamond tools with the same geometrical dimensions as those in the simulation were used. Cutting forces were measured by a Kistler dynamometer (type 9121). Detailed conditions are listed in table 4.
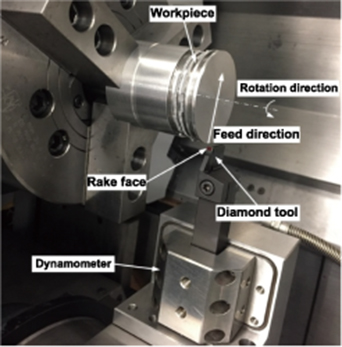
Figure 5. Experimental setup.
Download figure:
Standard image High-resolution image4. Results and discussion
4.1. Material removal mechanisms
Figure 6 shows the operations in the selected cross-section (z = 16 μm) of the 3D cutting simulation. As shown in figure 6(a), when the tool wedges into the workpiece, compressive stresses are induced ahead of the tool tip due to the extrusion of the tool. High tensile stresses concentrated among the clustered particles. This occurred because the embedded particles restrained the flow of the ductile matrix. The tool continues advancing and starts interacting with the particles distributed along the cutting path. When the major body of a particle was below the cutting path, it was pushed downwards into the matrix by the tool, distributing high compressive stresses underneath (figure 6(b)). Major particle bodies located above the cutting path were either cut through or pulled out of the workpiece, leaving cavities in the machined surface (figure 6(c)). The particles completely above the cutting path but near the cutting edge were directly crushed by the cutting tool (figure 6(b)). This type of particle cracking is caused by the direct tool-particle interaction. The fractured particles then move upwards and dislodge from the workpiece. The interactions between the adjacent particles (particle-particle interaction) could also lead to particle fracture. During the cutting process, some particles in front of the tool's rake face were pushed forward with the flow of the matrix. They may have collided with other nearby particles, resulting in particle fractures. This phenomenon mainly occurred in the primary shear zoon where the highly deformed matrix is located (figures 6(b) and (c)). Minor cracks were observed on some particles distributed along the cutting path but away from the cutting edge (figure 6(c)). This is a result of the non-uniform deformation at the matrix-particle interfaces, whcih induces stress concentration at these interfaces (matrix-particle interaction). As shown in figures 6(c) and (d), the particles distributed away from the primary shear zone may remain undamaged but dislodge from the workpiece with the formed chips.
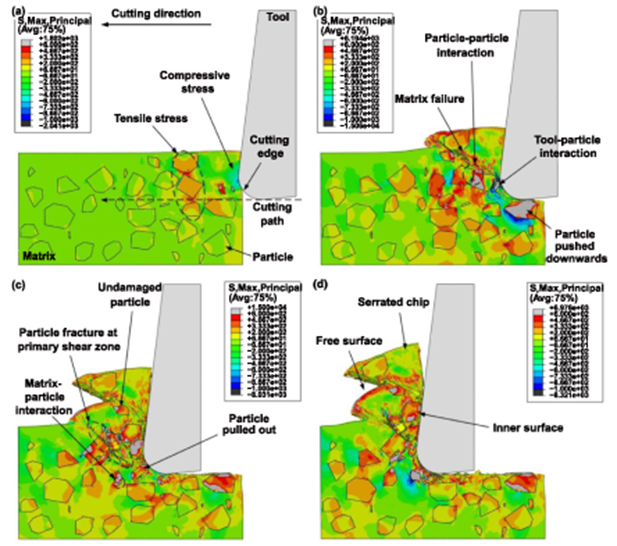
Figure 6. Distributions of principal stress during the 3D cutting process at (a) 5.83 × 10 e−6 s, (b) 1.75 × 10 e−5 s, (c) 3.73 × 10 e−5 s, and (d) 4.67 × 10 e−5 s.
Download figure:
Standard image High-resolution imageThe matrix began to deform once the tool wedged into the workpiece (figure 6(a)). On one hand, matrix deformations gradually accumulated at the tool tip as the tool advanced. Material failure emerges once the maximum equivalent plastic deformation exceeds the threshold, leading to microcracks. A chip was then generated along with the microcracks that propagated along the cutting path. On the other hand, the matrix material in front of the tool's rake face flowed upwards due to the pushing of the tool, leading to a large matrix deformation in the primary shear zone where matrix failure commonly occurs (figure 6(b)). Afterwards, the matrix continued moving forward along the shear plane from the root of the shear band to the top of the workpiece, forming a serrated chip (figures 6(c) and (d)).
To comprehensively investigate the machining process of PRMMCs, two more cross-sections (z = 4 μm and z = 20 μm) were analysed. Figure 7 shows the related principal stress distributions at the simulation time of 4.67 × 10 e−5 s. In a cross-section with very few particles, cracks at the primary shear zone are only observed at the matrix side (figure 7(a)). Nevertheless, if a cross-section consists of dense particle grains, particle fracture concentrates in four areas: the primary shear zone, in front of the cutting edge, the secondary deformation zone, and the machined surface (figure 7(b)). The causes of particle fracture at the former two zones have been detailed above. At the secondary deformation zone, particle fractures formed near the inner surface due to high compression caused by collisions between the chip and the tool rake face. As the tool cut through the workpiece, the tool flank face squeezed particles located at the machined surface, pushing them downward or crushing them, which led to more particle fractures in this area. On the contrary, particles distributed in these areas rubbed, carved, and impacted the tool, which made the tool wear quickly. To make the discussion on 3D cutting simulation more understandable, 3D views of the three previously mentioned cross-sections at the simulation time of 4.67 × 10 e−5 s are shown in figures 8(a)–(c). Additionally, the un-sectioning model is also provided in figure 8(d) as a comparison.
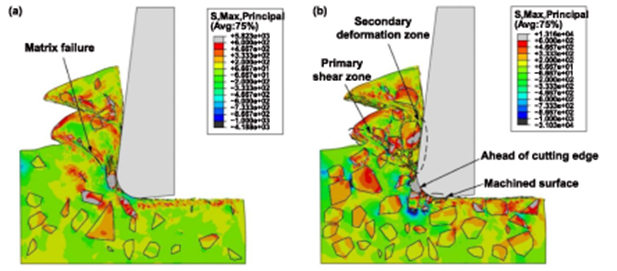
Figure 7. Distributions of principal stress in 3D cutting simulation at the cross-sections of (a) z = 4 μm, and (b) z = 20 μm.
Download figure:
Standard image High-resolution image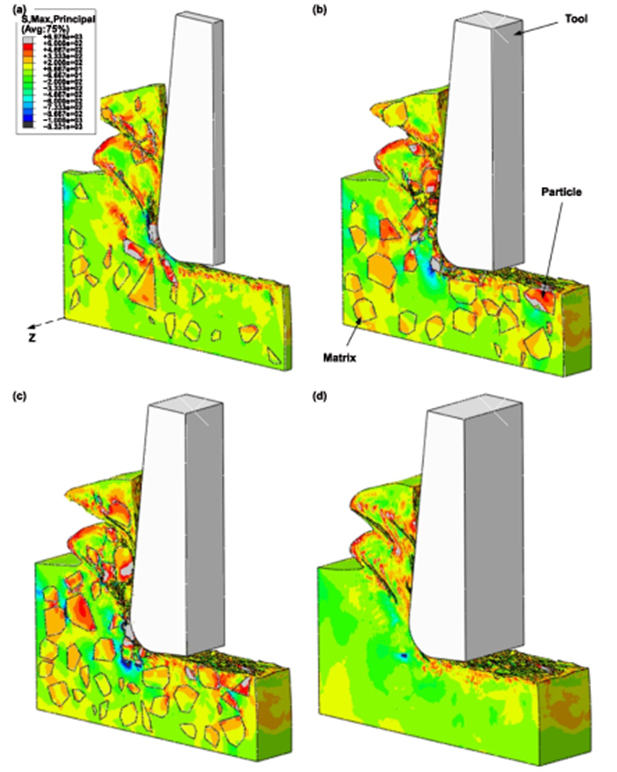
Figure 8. The 3D views of the cutting cross-section at (a) z = 4 μm, (b) z = 16 μm, (c) z = 20 μm and (d) z = 30 μm at the simulation time of 4.67 × 10 e−5 s.
Download figure:
Standard image High-resolution imageThe 2D cutting simulation under the plain-strain assumption is shown in figure 9(a). A stress distribution close to the 3D one was observed when the tool wedged into the workpiece. When the tool advanced further, the tool-particle, particle-particle, and matrix-particle interactions discussed above were also found (figures 9(a)–(c)). Serrated chips formed at the end (figure 9(d)). However, the 2D simulation shows more severe particle fractures. The plain-strain assumption in the 2D simulation defines off-plane strains as zero. However, this constraint is not realistic because in the cutting of PRMMCS, the movement of particles in the off-plane direction is rarely completely constrained by the surrounding soft matrix. As a result, stress concentration is more likely to occur in the 2D simulation, leading to more, but unrealistic, particle fractures.
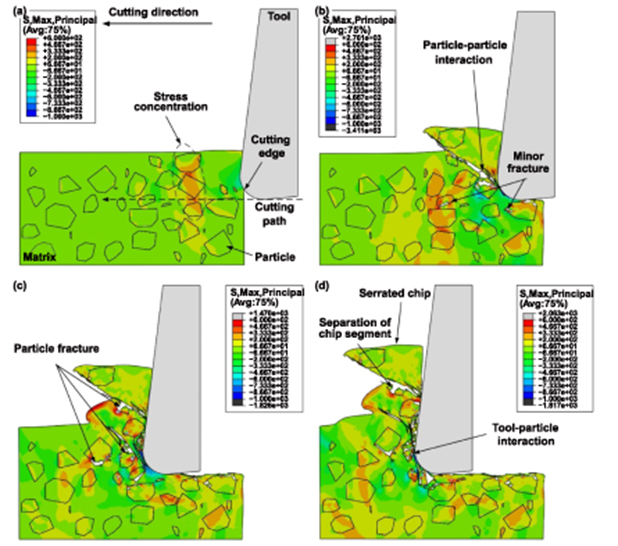
Figure 9. Distribution of principal stress during the 2D cutting process at (a) 5.83 × 10 e−6 s, (b) 1.75 × 10 e−5 s, (c) 3.73 × 10 e−5 s, and (d) 4.67 × 10 e−5 s.
Download figure:
Standard image High-resolution imageIn a cutting experiment, it is very difficult to trace the dynamic process of microscopic deformation of a PRMMC. Therefore, the chips were collected after the cutting experiment for further analysis. As shown in figure 10, the experimental result is consistent with the numerical prediction. The free surfaces of the chips are serrated while the inner surfaces are quite smooth. Several microcracks due to matrix failure were found in the area distributed with fewer particles (figure 10(a)). Particle fracture was observed at the shear plane and inner surface, due to the high stress conditions in these areas (figure 10(b)). Moreover, particle fracture at the primary shear zone caused the nucleation and growth of small voids. These voids rapidly expanded into microcracks among clustered particles, which led to large cracks and even breakage/separation of chip segments (figure 10(a)).
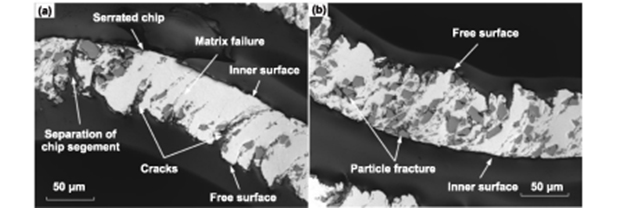
Figure 10. Microstructure of chips distributed with (a) few particles and (b) clustered particles.
Download figure:
Standard image High-resolution image4.2. Cutting force
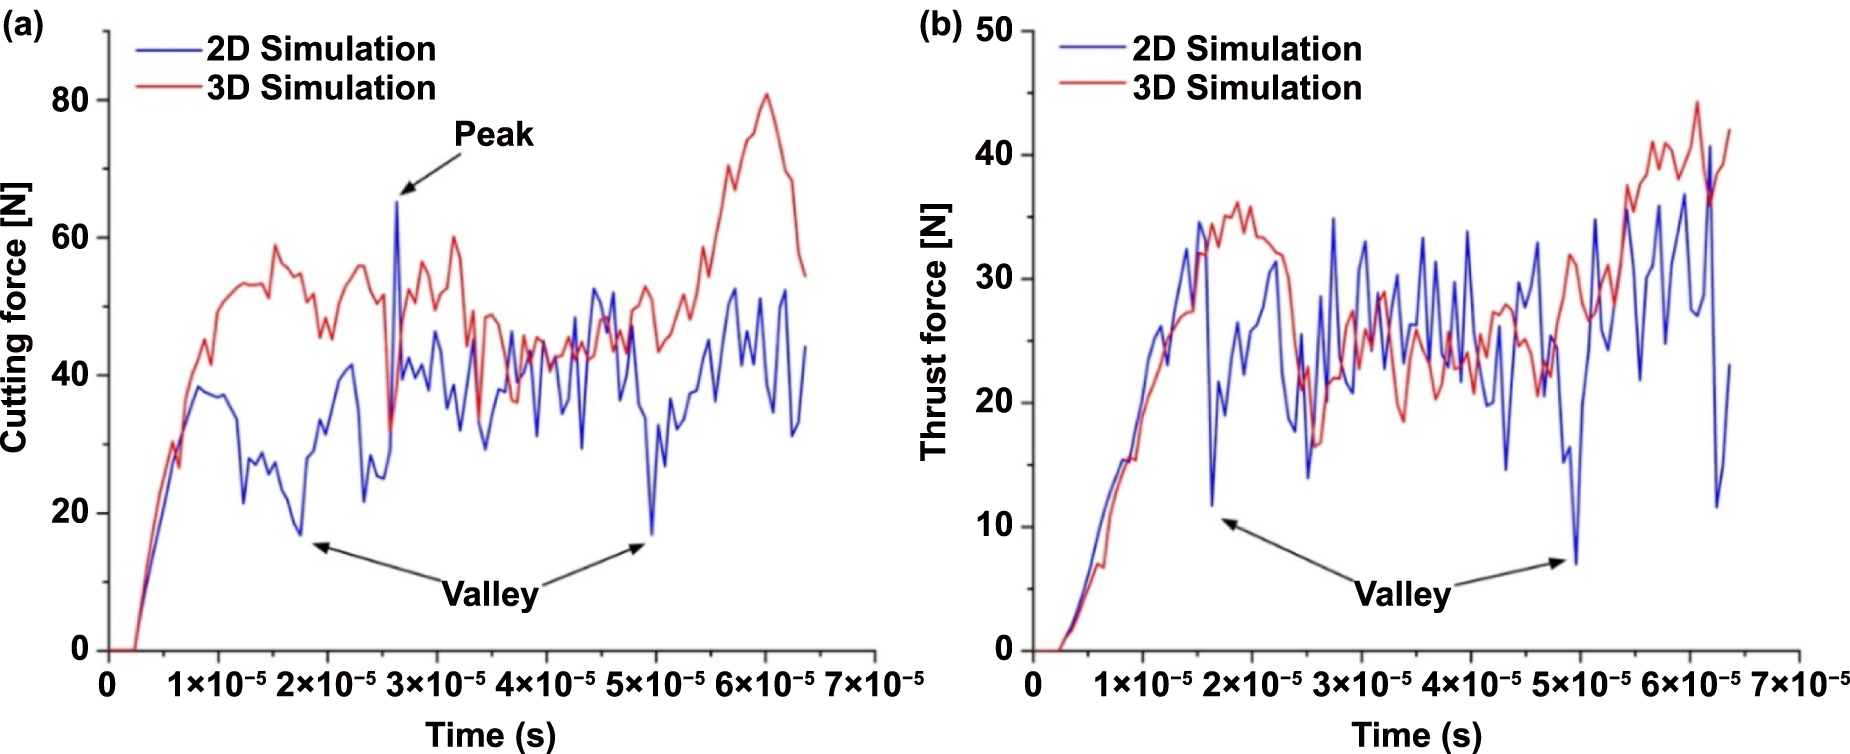
The comparisons of the predicted cutting and thrust forces are shown in figure 11 where the blue and red lines represent the forces obtained from 2D and 3D cutting simulations, respectively. Obviously, both the cutting and thrust forces fluctuate significantly because of the variant tool-workpiece interactions during cutting. The cutting force increases (figure 11(a)) as the chips move upwards, interacting with the tool rake face, and reaches its peak once the tool directly cuts the hard particles (figure 9(b)). The cutting force rapidly declines, forming valleys, due to the separation of chip segments because the chip breakage releases the contact stresses on the rake face (figure 9(c)). Meanwhile, the force in the thrust direction primarily comes from the extrusion of the tool flank face on the machined surface (figure 11(b)). It remains high when the tool flank face runs over the matrix and drops to valleys when the tool passes through the cavities created by fractured and detached particles (figure 9(d)).
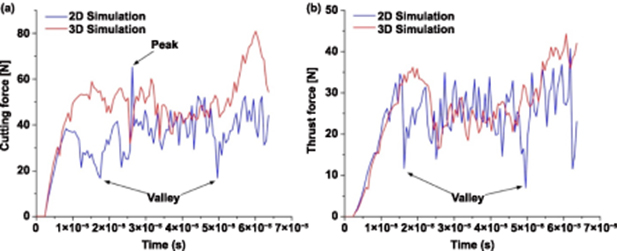
Figure 11. Comparison of (a) cutting and (b) thrust forces between 2D and 3D cutting simulations.
Download figure:
Standard image High-resolution imageThe average cutting forces of the simulations and the experiments are compared in figure 12. It can be seen that the 3D modelling is capable of providing a more accurate prediction than the 2D modelling because it mimics more precisely the complicated composite structure such that the material deformation and failure during cutting are well captured. As any 2D modelling cannot describe the actual microstructure of a PRMMC, its cutting force prediction varies significantly with the particle distribution within the plane under investigation.
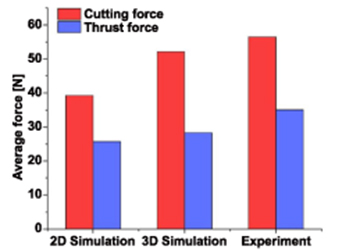
Figure 12. Comparison of measured and predicted average forces.
Download figure:
Standard image High-resolution image4.3. Machined surface topography
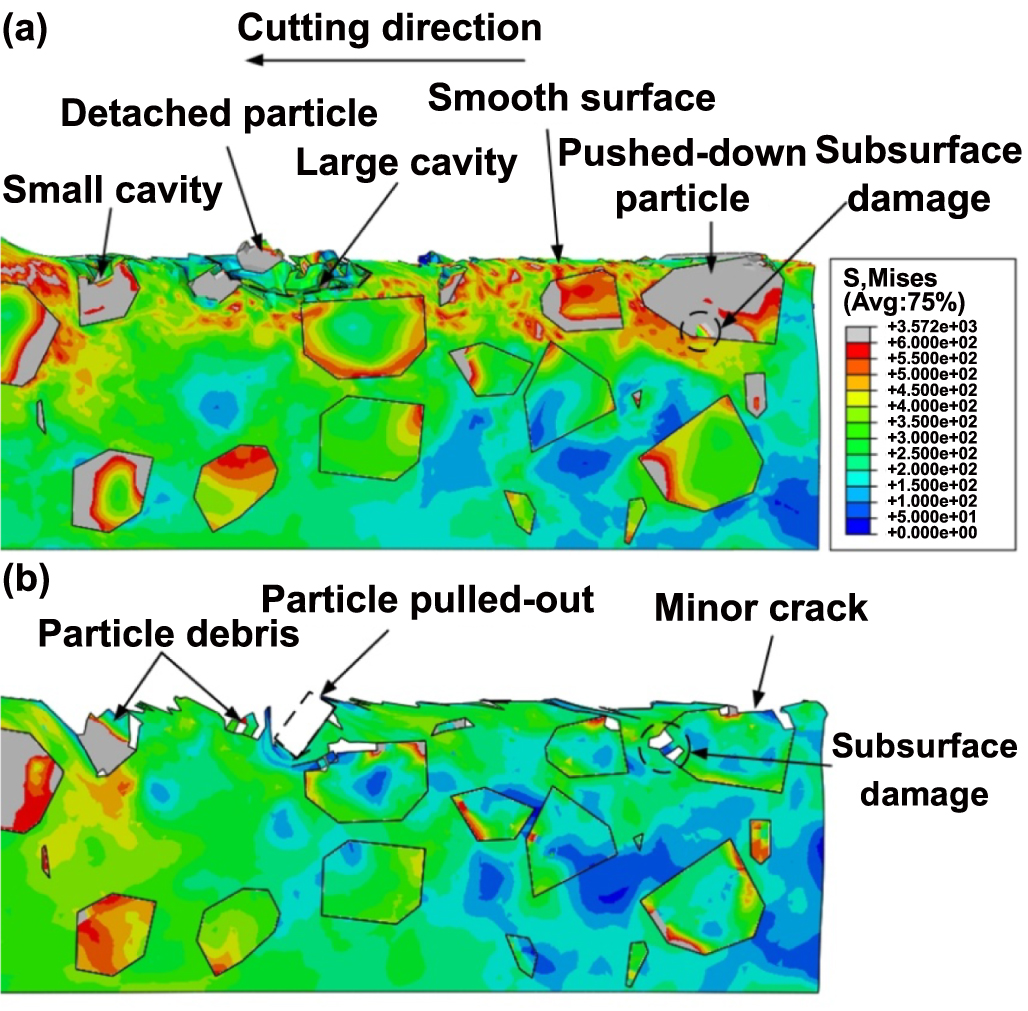
The predictions of the machined surfaces are shown in figure 13. Generally, the surface integrities obtained in 2D and 3D simulations are qualitatively similar. The major defects resulted from particle fracture and dislodgement along the cutting path. During cutting, the particles were either pushed into the surface or cut through by the cutting edge. The former caused minor cracks on the machined surface; but the latter resulted in severe surface defects. If a particle was directly cut off, it was also crushed into small fragments due to its brittleness. Subsequently, the crushed particles were partially or completely pulled out, leaving cavities in the matrix. Moreover, the tool pushed some particles forward along the cutting path, tearing to the matrix material and then forming larger surface cavities.
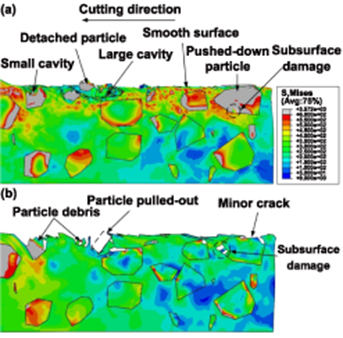
Figure 13. Machined surface morphology at (a) 3D simulation (z = 16 μm), and (b) 2D simulation.
Download figure:
Standard image High-resolution imageThere are two primary differences between the predictions by 2D and 3D models. One is that the 2D simulation predicts more subsurface damages, especially in the sharp corners of the particles (figure 13(b)). When the cutting edge advances along the cutting path, the tool flank face would squeeze the machined surface and induce high stresses beneath the finish surface, leading to particle fracture. As explained previously, stress concentration is more severe in the 2D model prediction due to the plane-strain assumption, which also causes more severe subsurface damages. On the other hand, the 3D model predicted higher residual stresses (figure 13(a)). This result aligns more realistically with an actual cutting of a PRMMC. The reason why the 2D simulation predicted lower residual stress is because particle fractures beneath the machined surface release nearby stresses without any constraints off the plane. This reduces the magnitude of the residual stresses.
Figure 14 exhibits a cross-section of the experimental surface. Obviously, the experimental observations are in excellent agreement with the numerical predictions. The machined surface quality is dominated by particle fracture and particle detachment along the cutting path. Particle fractures beneath the machined surface are also obvious. When a particle is pushed downward into the workpiece by the tool, it induces high compression stresses. These stresses transfer through the matrix and into the particle beneath the pushed particle (blue arrows in figure 14), thereby, causing a crack as subsurface damage.
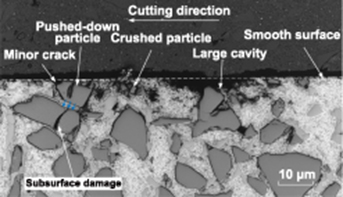
Figure 14. Cross-section image of a machined surface.
Download figure:
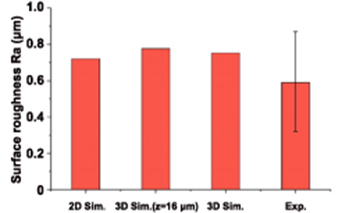
Standard image High-resolution imageTo further evaluate the surface integrity, the values of surface roughness Ra between the numerical predictions and the experiment were examined, as shown in figure 15. Clearly, the predicted surface roughness magnitudes in both the 2D and 3D models agree well with the experimental findings. As analysed above, the finish surface was significantly influenced by the distribution and shape of the particles along the cutting path. Therefore, 3D modelling can provide a more holistic prediction.
Figure 15. Comparison of measured and predicted surface roughness.
Download figure:
Standard image High-resolution image
5. Conclusions
This paper explains the development of a microstructure-based 3D model combining the EHM and MP modellings. This new microstructure-based 3D model accurately mimics the microstructure, deformation, and failure behaviours of PRMMCs. A 2D model with a specific microstructure was studied as a comparison. All the numerical predictions were assessed by corresponding cutting experiments. The mechanisms of material removal, machined surface generation, and the complicated tool-matrix-particle interactions were analysed in detail. The major conclusions of this study are as follows:
- (a)Particle fracture mainly occurs in four areas. The first is in the primary shear zone where the fracture is caused by high shearing due to matrix deformation. Fractures in the secondary deformation zone are induced by the extrusion between the chips and the tool rake face. The third area is located along the cutting path. Fractures occur here as a result of tool-particle (e.g. cut by the cutting edge or extruded by the tool flank face) and particle-particle interactions. Lastly, particle fractures form beneath the surface where the extrusion of the tool flank introduces high stresses in the machined surface.
- (b)Particle fracture predominately influences the machined surface's integrity. The primary defects, such as cavities, are mostly due to the fracture and dislodgement of particles along the cutting path.
- (c)3D modelling accurately captures the major features in the machining of PRMMCs, including particle fracture, matrix failure, chip formation, machined surface generation, and interactions. It also provides accurate and comprehensive predictions for cutting forces, chip morphology, and machined surface integrity.
- (d)The prediction of the 2D modelling is significantly influenced by the local microstructure.
Acknowledgments
Q Wu appreciates his discussions with W Xu in relation to the simulation and experiment.