

Abstract
The syntheses of FeS2 and Fe3S4 nanomaterials were optimized using a novel facile, surfactant-free, and microwave-assisted, one-pot synthesis method, run under ambient and reasonably mild reaction conditions. Synthetic parameters, such as metal precursor salt identity, reaction time, reaction temperature, metal:sulfur molar ratios, and solvent combinations, were all systematically investigated and optimized. A series of FeS2 (pyrite) samples was initially fabricated using thioacetamide (TAA) as the sulfur precursor to generate a distinctive, uniform octahedra-based morphology. Switching the sulfur precursor from TAA to L-cysteine resulted in a corresponding transformation in not only chemical composition from FeS2 to an iron thiospinel structure, Fe3S4 (otherwise known as greigite), but also an associated morphological evolution from octahedra to nanosheet aggregates. The study of these materials has enabled crucial insights into the formation mechanisms of these materials under a relatively non-conventional microwave-assisted setting. Furthermore, in separate experiments, multi-walled carbon nanotubes (MWNTs) and graphene were added in with underlying metal sulfide species to create conductive Fe–S/MWNT composites and Fe–S/graphene composites, respectively. The method of addition of either MWNTs or graphene was also explored, wherein an 'ex-situ' synthetic procedure was found to be the least disruptive means of attachment and immobilization onto iron sulfide co-reagents as a means of preserving the latter's inherent composition and morphology. The redox acidity for the parent material and associated composites demonstrates the utility of our as-developed synthetic methods for creating motifs relevant for electrochemical applications, such as energy storage.
Export citation and abstract BibTeX RIS
1. Introduction
Iron sulfide nanomaterials represent a viable option for electrochemical applications, such as lithium-ion battery (LIB) anodes, supercapacitors, and electrochemical catalysts for the hydrogen evolution reaction, in part because they are reasonably non-toxic, are relatively inexpensive, and possess a high natural abundance [1–3]. Specifically in the context of batteries, both greigite (Fe3S4) and pyrite (cubic FeS2) are known for their high specific capacity (i.e. FeS2: 894 mAh g−1; Fe3S4: 725 mAh g−1) as compared with conventional current anode (i.e. graphite, 175 mAh g−1) [4, 5]. Furthermore, Fe3S4 is characterized by an identical spinel structure to that of its iron-based analogue, magnetite, which has been extensively studied for its excellent performance as a battery material [4, 6–9]. In addition, cubic FeS2 has also been investigated as both an anodic and a cathodic material for LIB battery applications [10–23]. However, comparatively few studies to date have either investigated these iron sulfide analogues for LIB anodes or systematically devised means of rationally synthesizing these interesting materials.
Hence, this study will strive to systematically produce two structurally distinctive iron sulfides using a facile, ambient microwave-based method. Microwave-assisted protocols benefit from the ability to easily and controllably alter reaction parameters, such as frequency, power, temperature, and speed in a flexible manner, so as to be able to tunably generate series of samples with minimal effort, time, and cost. As compared with hydrothermal-based techniques for instance, the use of microwaves allows for a more thorough and uniform heating mechanism that invariably can lead to the production of more homogeneous and reproducible materials in a comparatively shorter reaction interval. Indeed, microwave-assisted methods have been previously used to generate FeS2 but not Fe3S4; even so, the emphasis of this prior work has focused on other applications, such as supercapacitors and electromagnetic shielding as opposed to batteries [24–33]. Moreover, it is worth pointing out that the microwave-assisted protocols used in past experiments have utilized potentially either more complicated or harsher protocols. Specifically, previous efforts have highlighted (i) 'two-step' procedures involving the preparation of a Fe2O3 intermediate that was subsequently subjected to sulfurization [28], (ii) the use of inert nitrogen gas to avoid possible oxidation effects [30], and (iii) longer reaction times (up to 12 h) [32] as compared with analogous hydrothermal and oven-based methods [25, 32]. Therefore, based on this precedence, our study is atypical in that we report on a 'one-pot', surfactant-free method operating with reaction times under 30 min, whose efficacy we have demonstrated with not only FeS2 but also, for the first time, Fe3S4. We have subsequently analyzed these as-produced materials within an LIB anode configuration.
From a synthetic perspective, our key (and non-trivial) goal in this study was to ensure that we achieved simultaneous control over both chemical composition and morphology with well-defined and uniform monodispersity and homogeneity. To highlight the issue of composition, it is worth emphasizing that the reliable and reproducible synthesis of well-defined iron sulfides is often complicated, because of the existence of many different but energetically similar variants, including but not necessarily limited to FeS, Fe3S4, Fe7S8, and FeS2.
The production of FeS2 is made even further intractable by the presence of two polymorphs, namely pyrite and marcasite, whose formation mechanism is poorly understood. It has been predicted [34] that marcasite formation is favored at lower pH values (i.e. below 5). Specifically, computational modeling suggests that marcasite growth in acidic media may be explained by its finite-size thermodynamic stability and preferential nucleation under these reaction conditions and that based on the consideration of particle-averaged surface energies, marcasite surfaces are more stable than those of pyrite at low pH. Crystallographically, in pyrite, the Fe atoms are located at the face centers and corners with the S atoms positioned at the octahedral vertices, whereas for marcasite, the Fe atoms are octahedrally coordinated, co-existing with edge-sharing Fe–S species [35]. Whereas no published reports have clearly indicated a noticeable difference in the electrochemical performance between marcasite versus pyrite polymorphs for LIB anodes, the metastable nature and intrinsic structural instability of marcasite have hindered a proper analysis of its electrochemical capabilities [36]. Hence, pyrite represents a more ideal synthetic target, due to its greater, inherent structural stability.
Prior methods which have sought to synthesize pure pyrite FeS2 have most often utilized procedures, operating under basic conditions in the presence of surfactants, such as polyvinyl pyrrolidone (PVP) [37], polyvinyl alcohol (PVA) [38], and oleylamine [20]. Such protocols have been successfully and primarily used to generate morphologies, such as spheres and cubes [29]. However, there are comparatively fewer studies that have reliably generated pyrite FeS2 octahedra. In fact, the octahedral morphology is much more difficult to synthesize, since it incorporates potentially more reactive and higher surface energy (111) facets. By contrast, the generation of cubes and spheres is far easier, because these motifs feature lower energy facets, i.e. (100) for cubes [39, 40]. As such, to overcome these issues, our key advance has been to reliably and reproducibly isolate and fabricate FeS2 octahedra under neutral conditions in the absence of a surfactant. The octahedral motif is highly desirable for energy applications, due to the surface exposure of a potentially highly reactive (111) facet [36].
In addition, as implied earlier, Fe3S4 nanosheets have previously been produced with either hydrothermal-based or hot injection techniques but not using a microwave-assisted method [7, 41, 42]. Indeed, Fe3S4 nanosheets are known to exhibit excellent LIB performance with a stable capacity of 548 mAh g−1 for over 120 cycles at a current density of 0.2 A g−1 [7]. This attractive performance likely arises as a consequence of nanosheet aggregation, which leads to an increase in active sites. Moreover, the complex 3D agglomerate that forms can likely more effectively accommodate for volume changes during the lithiation process [7]. However, to their detriment, both FeS2 and Fe3S4 suffer from large volume expansion effects upon lithiation and delithiation, thereby resulting in a low observed cyclability. To account in part for these issues, Fe3S4 has previously been combined with reduced graphene oxide (rGO) with the resulting composite evincing good performance as an LIB anode [8]. By analogy, herein, our strategy of improving upon Fe3S4's intrinsic conductivity has been to mix these sulfides with either multi-walled carbon nanotube (MWNT) or graphene additives, an idea which has been earlier shown to not only increase stability but also enhance overall performance [36, 43].
As precedence for this approach, our group has previously generated a monometallic sulfide-MWNT composite, incorporating VS4, using a microwave-assisted method. When tested within an LIB anode battery configuration, it was noted that the addition of MWNTs to the VS4 nanorod motif led to both a greater conductivity and an improved stability of the as-prepared product [43]. To date, to the best of our knowledge, no previous motifs consisting of Fe3S4 coupled with MWNTs within an LIB anode have been reported, whereas a prior study of a FeS2/MWNT composite emphasized its superior performance as compared with both FeS2/rGO and pristine FeS2 counterparts [44]. Furthermore, with respect to the production of the analogous Fe3S4/graphene composite, the majority of prior work has focused on the incorporation of rGO as opposed to graphene itself [4, 8]. Therefore, building on this prior body of work, we have created Fe3S4/MWNT and Fe3S4/graphene composites herein for the first time to demonstrate their potential for boosting the inherent stability and performance of Fe3S4 itself.
To summarize, because there are very few studies that have investigated the FeSx system using a microwave-based process, our goal herein has been to synthesize iron sulfide nanomaterials through a careful tailoring and optimization of key reaction parameters, such as sulfur precursor identity, metal precursor identity, time, temperature, solvent, oxidation state, and relative metal:sulfur (M:S) ratios. The novelty of our analysis can be summed up, as follows. To the best of our knowledge, we are the first to fabricate a uniform series of not only pure pyrite FeS2 octahedra but also Fe3S4 nanosheets with well-defined composition and morphology using a novel and rapid (under 30 min) one-step microwave-assisted synthesis protocol, operating under neutral conditions and in the absence of surfactants. We have complemented these efforts by generating the corresponding Fe3S4/MWNT and Fe3S4/graphene composites for incorporation as part of battery configurations. Electrochemical studies of these materials indicate redox activity that is consistent with prior reports, thereby highlighting the utility of the as-discussed synthetic methods in terms of generating appropriate motifs relevant for electrochemical applications, such as energy storage.
2. Experimental
2.1. Synthesis of FeS2 octahedra
The controllable synthesis of FeS2 octahedra was performed using a commercial microwave synthesizer (CEM, Discover SP) instrument, operating in the dynamic mode. First, 0.2 mmol of ferric chloride (FeCl3·6H2O) (ACS reagent, 97%) and 0.3 mmol of thioacetamide (TAA) (Alfa Aesar, 99%) were dissolved into an aqueous solution, consisting of 3.33 ml of ethylene glycol (EG) (Fisher Scientific), and 6.66 ml DI water (volume ratio of 2:1 of H2O:EG), and subsequently stirred for 15 min to produce a homogeneous dispersion. This solution mixture was subsequently transferred to a microwave reaction vessel (30 ml) and subjected to a microwave-based treatment protocol, consisting of operating at 180 °C for 30 min at a pressure of 250 psi and a power of 200 W with medium stirring. After cooling down to room temperature, a resulting black powder was isolated and collected by centrifugation, prior to washing with ethanol and water.
2.2. Synthesis of Fe3S4 nanosheet aggregates
The analogous synthesis of Fe3S4 nanosheet aggregates was performed using the identical procedure, as described above, again using the microwave apparatus, operating in the dynamic mode. Apart from the reaction temperature, the main difference was in the identities of the precursors that were used. First, 0.2 mmol of L-cysteine (LC) (Sigma Aldrich) and 0.1 mmol of ferric chloride (FeCl3·6H2O) were added to a 2:1 H2O:EG mixture by volume (total of 10 ml) and stirred for 15 min, until a complete dissolution to form a homogeneous medium was achieved. This solution was then transferred to the microwave reaction vessel (30 ml). The microwave processing conditions used entailed running the instrument at 180 °C for 10 min at a pressure of 250 psi and a power of 200 W with medium stirring. After cooling down to room temperature, a black powder was eventually collected after centrifugation, before subsequent washing with ethanol and water.
2.3. Synthesis protocols of FeS-based MWNT composites
2.3.1. In-situ procedure
To attach FeS2 octahedra onto MWNTs (SES Research, >95 weight %) through an in-situ growth process, the method described previously for creating pristine FeS2 was utilized. The as-obtained samples of commercial MWNTs were characterized by lengths of several microns and average outer diameters, measuring in the range of 40–100 nm; Figure S1(A) highlights a transmission electron microscopy (TEM) image of the as-obtained MWNTs. In terms of purity, from the SES research company website, these MWNTs possess >95% nanotubes vs. amorphous carbon (<2%) with an ash content of <0.2%. In the first step, set quantities of these MWNTs (∼1 mg) were put into the H2O:EG 2:1 mixture, prior to the addition of iron and sulfur precursors. These were dispersed through the mediation of ultrasonication. After the relative iron and sulfur precursors were added (2:3 FeCl3:TAA), the solution was stirred for 30 min followed by our as-developed microwave protocol, conducted at 180 °C for 30 min under otherwise identical conditions. The as-prepared FeS2/MWNT composites were ultimately separated by centrifugation, following by washing with ethanol, prior to characterization.
2.3.2. Ex-situ procedure
Pre-formed Fe3S4 nanosheets were synthesized, as stated above. Then 1 mg of MWNTs was dispersed in 5 ml ethanol using sonication to ensure a final mass loading of 10% MWNTs. Next the Fe3S4 material was added in with the MWNT mixture and stirred for 30 min. After stirring, the solution was centrifuged and washed with ethanol. FeS2/MWNT composites were similarly constructed, by means of comparison.
2.4. Synthesis protocols of Fe3S4–graphene composites
Pre-formed Fe3S4 nanosheets were synthesized, as described above. Then 1 mg of graphene (nanoplatelet aggregates; sub-micron particles with a surface area of 500 m2 g−1 as per the Thermo Scientific company website). Figure S1(B) presents a TEM image of the as-obtained graphene, which was dispersed in 5 ml ethanol using sonication to ensure a final mass loading of 10% graphene. Subsequently, the Fe3S4 material was added in with the graphene mixture and later stirred for 30 min. After stirring, the solution was centrifuged, and the product was washed with ethanol.
2.5. Characterization methods
2.5.1. X-ray diffraction (XRD)
Powder XRD has been utilized to analyze the crystallographic information and confirm the chemical composition of as-prepared samples. To prepare the XRD sample for analysis, as-prepared nanomaterials were dispersed in ethanol and then drop cast onto a zero-background holder (MTI Corporation, Zero diffraction plate for XRD, B-doped, p-type Si, 23.6 mm in diameter by 2 mm in thickness). The Rigaku Miniflex diffractometer, operating in the Bragg configuration with Cu Kα radiation (λ = 1.5418 Å), was used to obtain sample powder XRD data over the 2θ range of 20°–60°, with a scan rate of 10° min−1.
2.5.2. Electron microscopy
Electron microscopy techniques that we employed included scanning electron microscopy (SEM), TEM, and high-resolution transmission electron microscopy (HRTEM). These were all used to obtain key information about sample morphology, sample size, and crystal lattice identification. Specifically, SEM data were acquired using a Hitachi 4800S instrument under 10 kV voltage conditions. To prepare the SEM sample for characterization, our Fex Sy nanomaterials were dispersed in ethanol prior to drop-casting onto a silicon wafer followed by air drying. The TEM and HR-TEM samples were prepared by drop casting aliquots of the Fex Sy nanomaterials solution in ethanol onto a lacey carbon-coated 300 mesh copper grid. The TEM images were collected using a JEOL JEM 1400 LaB6 TEM, equipped with a 2048 × 2048 Gatan CCD camera, operating at an accelerating voltage of 120 kV. HRTEM analysis was performed on a JEOL 2100F, run with an accelerating voltage of 200 kV.
2.5.3. X-ray photoelectron spectroscopy (XPS)
XPS was used to confirm elemental composition and derive oxidation state information about the various different elements within our samples. Specifically, XPS sample preparation was similar to that used for SEM. Fex Sy nanomaterials were dispersed in ethanol and then drop cast onto a Si wafer (1 cm × 1 cm). The XPS characterization was conducted using a home-made system, with a model SPECS Phoibos 100 electron energy analyzer for electron detection. Al Kα radiation (1486.6 eV) (model XR 50) was used as the x-ray source for the characterization process. Data collected in the Fe 2p and S 2p regions were interpreted using commercial CasaXPS software; we used well-established background correction and curve fitting algorithms for our subsequent data processing.
2.5.4. Electrochemical methods
Working electrodes were developed by combining an active material—Fe3S4, Fe3S4/MWNTs, or Fe3S4/graphene—with conductive carbon black, and polyvinylidene difluoride, all of which were suspended in N-methylpyrrolidinone to generate electrodes with an 8:1:1 mass ratio. Within an Ar environment, coin cells were assembled by pairing working electrodes with lithium metal anodes, separated by a polypropylene film, in the presence of a 1.0 M lithium bis(trifluoromethanesulfonyl)imide and 0.2 M LiNO3 in a dipropylene glycol dimethyl ether (DPGDME) electrolyte. Cyclic voltammetry (CV) measurements were collected using a Biologic VSP multichannel potentiostat at a scan rate of 0.1 mV s−1 between a 3 V to 1 V potential range, for five cycles. The resulting current values were normalized with respect to the active mass of each working electrode.
3. Results and discussion
To gain insights into the synthesis of Fex Sy nanomaterials, various reaction parameters were investigated, including, as a key starting point, the identities of the individual reagent precursors. It is worth highlighting that each sulfur precursor tested yielded different and distinctive morphologies and chemical compositions, when run under identical reaction conditions. Each of the other reaction parameters was therefore individually analyzed for each unique sulfur precursor examined. Specifically, a self-contained series of experiments for every discrete sulfur precursor evaluated was performed in which featured reaction variables such as (i) the identity of the anion associated with the Fe precursor, (ii) the metal-to-sulfur (M:S) molar ratio, (iii) the solvent combination, (iv) the reaction time, and (v) finally, the addition of a conductive carbon additive (i.e. MWNTs) were systematically probed and altered with the goal of achieving meaningful correlations with the resulting composition and morphology.
In this vein, reaction conditions associated with functional sulfur precursors, such as TAA and LC, were ultimately optimized. A third sulfur precursor, namely thiourea, was also investigated under analogous reaction conditions, but no apparent product was formed. Specifically, no obvious precipitate was observed, even with reaction times of up to 2 h, so additional experiments were not pursued with this reagent.
3.1. Parameter optimization while using TAA as the sulfur precursor
Initially, TAA was tested as the sulfur precursor. It has previously been observed to act as an electron donor, due to the fact that it hydrolyzes to form electron-rich ammonium ions [45]. Previous studies of metal sulfides utilizing TAA have suggested that TAA reacts with water to form H2S which subsequently goes on to form the associated, desired metal sulfide. By contrast, the use of other sulfide sources tends to induce the initial formation of a M–S complex [46]. Other studies have proposed that TAA forms a metal complex via its NH2 pendant moiety, which is broken apart at higher temperatures, thereby releasing free and reactive species of TAA and metal ions into solution which can subsequently interact with each other. Notwithstanding the precise explanation, the resulting hydrolysis of TAA is expected to yield H2S which then reacts with the free metal ions in solution to produce the relevant metal sulfide [47]. To reinforce the suitability of TAA as an effective S-containing precursor, we also note that TAA possesses a faster S2− release rate as compared with LC.
3.1.1. Effect of iron precursor salt type
A recently published paper discussed the significance of anion identity on the resulting iron oxide nanoparticle size, using a microwave-assisted method [48]. Generally, it was observed that the type of anion used in the reaction affected the corresponding size of the iron oxide nanoparticle products [48]. In particular, it was theorized that whereas the use of sulfate anions impacted the nucleation process through steric effects, the introduction of chloride ions favored lower bonding coordination modes, all of which led to the formation of variously sized particles. Another study suggested that the smaller Cl− anion could be incorporated into the structure of the iron oxyhydroxide precursor, β-FeOOH, thereby stabilizing the FeO6 complex, whereas the larger SO4 2− anion distorted the FeO6 octahedral unit, thereby assisting in the creation of a different iron hydroxide, namely α-FeOOH [49].
Given the clear importance of the anion, we compared the behavior of chloride versus sulfate salts under reaction conditions known to successfully produce FeS2 octahedra. Specifically, we ran 2:3 M:S ratios in the presence of Fe3+ within a 2:1 H2O:EG mixture at 180 °C for 30 min. The use of sulfate yielded not only compositionally undesirable marcasite impurities (figure S2(A), orange) but also a polydisperse mixture of morphologies, including unwanted particles (figure S3(B)). This finding correlates with the prior reported study on iron oxides, wherein the SO4 2− anion appeared to induce the formation of the orthorhombic precursor, which in our case was marcasite. By extension, the chloride anion tended to favor the production of the preferred cubic material. Hence, we were able to highlight the importance of the choice of iron precursor salt type, in this case, ferric chloride.
3.1.2. Effect of metal:sulfur precursor molar ratio
The precursors' relative concentrations were analyzed within a precise and limited range of relatively small increments, comprised of 2:3, 2:4, and 2:5 M:S molar ratios, respectively (figure S2(B)). It was experimentally deduced that a 2:3 M:S molar ratio represented an optimized quantity, because in this case, XRD was consistent with a pure pyrite composition whereas the corresponding SEM data highlighted the formation of homogeneously dispersed octahedra (figures S2(B), yellow, and S3(A)). Increasing the M:S molar ratios to 2:4 and 2:5 worsened the sample quality in that we observed increasingly greater distortions of the octahedral shape coupled with a rise in the amount of marcasite impurity detected (figure S2(B) orange and yellow, respectively, and figures S3(C) and (D), respectively).
Since, as previously noted, marcasite formation is favored at lower pH [34], the appearance of marcasite at higher M:S ratios may indicate that the solution pH becomes lower with greater S precursor content, due to the increased hydrolysis of TAA and the concomitant formation of ammonium ions. Therefore, 2:3 was determined to be the optimized M:S ratio, when using TAA. Reflecting the trajectory of our experiments, in the presence of TAA, the optimized reaction conditions consisted of a 2:3 M:S molar ratio in which ferric chloride was utilized as the iron precursor. This sample was subsequently used for additional experimentation with other reaction parameters.
3.1.3. Effect of solvent composition
The role of solvent was consequently explored. For microwave-assisted reactions, solvent choice is significant in the context of its intrinsic tangent factor, a reflection of how much microwave energy it can absorb. Because EG maintains a higher tangent factor (and hence an increased absorption of microwave energy) as compared with water, the reaction kinetics in this medium will be noticeably faster than in a pure aqueous solvent. Furthermore, the reducing properties of EG render it possible for ferric chloride to be used as a precursor, because this solvent can convert Fe3+ to Fe2+. In prior studies, adjusting the relative volumes of H2O to EG could promote the formation of either magnetite or hematite, respectively [50]. Hence, EG played a dual role as an effective reducing agent and a microwave heat absorber.
Therefore, not surprisingly, the amount of EG incorporation impacts upon the resulting chemistry and morphology of as-prepared samples, a finding that was apparent upon systematically increasing relative EG content in the context of H2O:EG volume ratios of 1:0, 2:1, and 1:1, respectfully. Specifically, using a 1:0 H2O: EG ratio, we isolated not only slight marcasite impurities (figure S2(C), red) but also a mixture of nanoflowers and octahedra (figure S3(E)). With a 2:1 H2O:EG volume, we observed uniform octahedra (figure S3(A)) that consisted of pure pyrite (figure S2(C), orange). However, increasing the amount of EG still further to a 1:2 H2O:EG volume ratio led not only to a greater size polydispersity of the octahedra but also a 'roughened' surface (figure S3(F)). Furthermore, although the associated XRD was indicative of FeS2, it was still of low enough crystallinity that we could not conclusively rule out the presence of other detrimental impurities, especially amorphous ones (figure S2(C), yellow).
Hence, our data implied the presence of a 'sweet spot' in which the use of a 2:1 H2O:EG solvent ratio by volume enabled us to achieve the targeted chemical composition and morphology. Our observations reflect similar findings in a previous report, which analyzed the effect of varying the relative components of a water:diethylene glycol mixture [51].
3.1.4. Effect of time
The effect of reaction time was similarly investigated. Specifically, the reaction was tested using a 2:1 H2O:EG ratio with a 2:3 M:S precursor ratio, run at 180 °C after 10, 15, 30, and 45 min, respectively. At lower reaction times, i.e. at 10 min, the solution yielded no perceptible precipitate. By increasing the microwave irradiation time to 15 min, octahedra and particles were observed (figure S3(G)). However, the amount of as-prepared precipitate was minimal and insufficient for an interpretable XRD scan. Raising the irradiation time further to 30 min solved that latter issue. Whereas the measured XRD pattern (figure S2(D), yellow) was consistent with pure pyrite formation, the associated morphology consisted of homogeneously dispersed octahedra (figure S3(A)) with average diameters of 1.1 ± 0.5 μm. Increasing the reaction time still further to 45 min was less helpful in terms of sample quality, because we observed the formation of distorted octahedra (figure S3(H)) with a composition comprised of pyrite with marcasite impurities (figure S2(D), orange). Again, because marcasite formation is favored under lower pH conditions [34], the appearance of marcasite at longer reaction times may be an indication that the solution pH decreases over time with increasing TAA hydrolysis and corresponding production of H+ as the reaction proceeds.
To summarize, in the presence of TAA, our collective data supported the notion that the optimized reaction conditions could be described as follows. In particular, the use of a 2:3 M:S molar ratio in the presence of a 2:1 H2O:EG solvent volume ratio at 180 °C for 30 min, while utilizing ferric chloride as the iron precursor [37], was optimal in terms of forming the desired motif consisting of uniform pyrite FeS2 octahedra, measuring ∼1 μm in diameter. Simulations, probing the production of FeS2 pyrite polyhedral motifs using the METADISE program [39], have suggested that the primary facet, characteristic of FeS2 pyrite octahedra, consists of the (111) plane. In particular, theory implied that the (111) plane is highly reactive and could only form either within a highly S-rich environment or in the presence of additives as diverse as arsenic, an ethanolamine:H2O mixture [52], or PVP [37, 39]. As such, our work was able to experimentally demonstrate that octahedral pyrite FeS2 possessing the desired (111) plane could be produced in the absence of not only toxic additives but also surfactants, thereby reinforcing the novelty of our contributions.
3.1.5. Effect of addition of carbon nanotubes (CNTs)
Although the above-mentioned optimized synthesis of FeS2 is a novel endeavor in and of itself, the disadvantages of FeS2 and other metal sulfides for electrochemical performance needed to be addressed. In particular, as mentioned, this material is limited by an undesirable volume expansion that occurs under realistic cycling conditions. Previously, in a similar study, our group mitigated for this effect through the microwave-assisted addition of conductive MWNTs in an effort to boost the intrinsic electrochemical behavior of vanadium sulfide motifs [43].
Therefore, by analogy, we hypothesized a similar outcome in terms of improving the reversibility and conductivity of our as-produced FeS2 materials through a simple addition of conductive MWNTs into the reaction medium, prior to metal precursor and sulfur precursor addition. As with our previously published strategy on vanadium sulfides [43], an in-situ method was initially tried. In particular, we added in 1 mg of MWNTs to the mixed solvent solution, before placing in iron and sulfur-containing precursors. The solution then underwent microwave irradiation under the optimized reaction conditions described previously, consisting of using a 2:3 M:S precursor ratio in a 2:1 H2O:EG volume solvent ratio at 180 °C for 30 min, with ferric chloride as the iron-containing precursor.
However, unlike what we had been able to implement with VS4, the addition of MWNTs in this case appeared to noticeably affect both the chemical composition and the morphology of the isolated products. Specifically, with the in-situ reaction protocol, octahedra still formed, but the size polydispersity perceptibly increased (figure S3(K)) coupled with the appearance of undesirable marcasite impurities, as seen in the associated XRD pattern (figure S2(E), orange).
To overcome this issue, an equally promising ex-situ reaction process was explored, wherein the same quantity of MWNTs was sonicated with pre-formed FeS2 octahedra for 30 min. This procedure resulted in the formation of a relatively homogeneous dispersion of MWNTs, which were relatively uniformly distributed onto the surfaces of the iron sulfide octahedra (figure S3(J)). The resulting XRD pattern evinced the presence of FeS2 pyrite with a slight amorphous hump, located at ∼25° and indicative of the presence of carbon. Therefore, the ex-situ method represented an effective means with which to enable conductive carbon attachment without initiating the formation of either morphological or compositional impurities.
3.2. Parameter optimization while using LC as the sulfur precursor
Having optimized the experimental synthesis conditions using TAA as the sulfur precursor, we performed an analogous exercise with LC. LC possesses three functional groups (i.e. –SH, –NH2, and –COOH), whose greater collective hydrophilicity promotes an increased metal ion affinity as compared with the –CSNH2 functional moiety associated with TAA [53, 54]. Not surprisingly, as compared with other S-containing sources, LC is associated with a slower S2− formation [54, 55]. Furthermore, due to its metal ion affinity, LC is also known for its ability to influence and modify shape, because it can selectively bind onto and thereby dictate the preferential growth of certain specific crystalline planes [1, 56–58]. Hence, LC was a reasonable starting point with which to generate iron-based metal sulfides, such as Fe3S4.
3.2.1. Effect of iron precursor salt type
Similar with our efforts on TAA, as described previously, we compared and contrasted the use of a chloride versus a sulfate precursor to determine the effect of the choice of the anion, associated with the iron precursor, when using reaction conditions of 180° for 10 min with 1:2 M:S ratio in the presence of a 2:1 H2O:EG volume solvent mixture. By analogy with TAA, the use of sulfate gave rise to not only undesirable marcasite impurities (figure S4(A), orange) but also a morphological mixture, incorporating unwanted particles (figure S5(B)). This was a much more heterogeneous sample, as compared with the use of the chloride precursor (figures S3(A), red and S4(A)). This finding supports the idea that the use of the sulfate anion led to the preferred production of orthorhombic marcasite versus cubic pyrite. Hence, the optimized iron precursor salt type incorporated chloride.
3.2.2. Effect of metal:sulfur molar ratios
By analogy with TAA, the M:S molar ratio incorporating LC was systematically varied from 1:1 to 1:4. It was observed that at 1:1 M:S, there was no evident precipitate. Upon increasing the relative amount of LC to 1:2 M:S, we were able to generate the desired Fe3S4 (figure S4(B), red). However, if we continued to raise the relative quantity of LC within the context of 1:3 M:S, we produced unwanted pyrite impurities (figure S4(B), orange). We confirmed this trend of diminishing returns in that the use of a 1:4 M:S molar ratio also led to the formation of pyrite impurities (figure S4(B), yellow).
With respect to the isolated morphology, with a 1:2 M:S molar ratio, the sample was mainly comprised of nanosheet aggregates (figure S5(A)). The lengths of these sheets appeared to increase with correspondingly higher LC content for the 1:3 and 1:4 M:S molar ratio samples (figures S5(C) and (D), respectively). Hence, based on all of these collective results, the 1:2 M:S molar ratio was found to be an optimal compromise in terms of enabling the generation of simultaneously chemically pure and reasonably monodisperse nanosheet aggregates.
3.2.3. Effect of solvent combination
The solvent ratio was subsequently optimized. It was observed that a pure aqueous solution yielded a mixture of Fex Sy materials, including pyrite, marcasite, greigite, and FeS (figure S4(C), red) with a resulting morphology, consisting of nanosheet aggregates with octahedral impurities (figure S5(E)). The addition of EG within a 2:1 volume ratio gave rise to a comparative increase in Fe3S4 production, characterized by fewer pyrite impurities (figure S4(C), orange) coupled with a nanosheet morphology possessing smaller dimensions than that noted using a pure aqueous solution (figure S5(A)). Further increasing the relative amount of EG within a 1:1 volume ratio was less beneficial in that it yielded very little precipitate. This was found to consist of Fe3S4 and pyrite (figure S4(C), yellow) which had formed as an aggregated nanosheet morphology (figure S5(F)). Hence, by analogy with TAA, whereas the 1:1 H2O:EG volume ratio could indeed generate the correct composition to some degree, the lack of crystallinity of that sample did not rule out the possibility of other compositional impurities, including amorphous ones. Moreover, analysis of the associated morphology implied that whereas the constituent nanosheet size had reduced in magnitude, the corresponding size of the overall aggregate had actually enlarged. Therefore, based on all of these data, we determined that the optimized solvent ratio consisted of a volume ratio of 2:1 H2O:EG.
3.2.4. Effect of Time
Finally, the reaction time was explored after 5, 10, 30, and 45 min, respectively. It was observed that after 5 min, there was insufficient precipitate for XRD characterization, though SEM analysis revealed a distinctive nanoflower assembly (figure S5(G)). Raising the reaction time to 10 min yielded monodisperse nanosheet aggregates (figure S5(A)), composed of pure Fe3S4 greigite (figure S4(D), red). Increasing the time further to 30 min led to the appearance of not only pyrite impurities (figure S4(D), orange) but also nanosheet aggregates (figure 4(H)). At 45 min, we could not isolate enough precipitate for XRD analysis; the sample that we produced was comprised of nanoflowers, hierarchically and unusually arranged in a linear fashion (figure S5(I)). As such, based on all of these data, we concluded that 10 min of reaction time generated the best results in terms of promoting the desired Fe3S4 growth. To summarize, the optimized conditions for Fe3S4 nanosheet growth can be described, as follows: a 1:2 M:S molar ratio of FeCl2:LC within a 2:1 H2O:EG solution by volume, heated via a microwave-assisted reaction protocol for 10 min at 180 °C.
3.2.5. Effect of addition of CNTs
Similar to what we had undertaken with the TAA-based system, the method of addition of the MWNTs was also investigated in the presence of LC. An in-situ procedure was first explored, wherein the MWNTs were dispersed in a mixed solvent solution, prior to Fe and S precursor addition, before subjecting the reaction medium to microwave irradiation at 180 °C for 10 min, as per the optimized conditions we had finalized previously. Unlike the in situ FeS2 reaction above wherein the introduction of MWNTs led to compositional impurities, in the case of Fe3S4, there were the added complications of the appearance of serious morphological inhomogeneities upon MWNT addition. Specifically, the latter manifested themselves as not only the inhomogeneous growth of nanosheet aggregates but also the apparent growth of Fe–S structures on the MWNTs themselves (figure S5(J)).
Therefore, by analogy with TAA, an ex-situ reaction was explored, wherein the same amount of MWNTs as mentioned above was sonicated with preformed Fe3S4 nanosheets for 30 min. The resulting SEM image (figure S5(K)) highlights the attachment of MWNTs onto Fe3S4 nanosheets with no apparent morphological impurities, thereby reinforcing the effectiveness of applying the ex-situ method to functionalizing these metal sulfides with conductive CNTs. Furthermore, the addition of graphene onto the Fe3S4 nanosheets was performed in an analogous manner (figure S5(L)); the corresponding as-generated sample did not give rise to any obvious morphological impurities.
3.3. Characterization of as-prepared FeS2 and Fe3S4 materials
3.3.1. Characterization of FeS2
Upon optimizing the synthesis conditions for generating FeS2 nanomaterials, we collected XRD data, which corroborated the production of cubic FeS2 (figure 1(C)). In particular, the experimental pattern (black) clearly matches that of the predicted cubic pattern expected for pyrite FeS2 (blue, JCPDS 42-1430) with no obvious marcasite impurities (red, JCPDS 37-0475). The HRTEM images (figures 1(A) and (B)) emphasize the crystalline nature of this material; the complementary SEM image (figure 1(D)) highlights the fabrication of octahedra with edge lengths of ∼220 ± 54 nm. Furthermore, HRTEM analysis of these features evinced a measured d-spacing value of 2.4 ± 0.1 Å, consistent with the (210) FeS2 plane (figure 1(B)). Additional HRTEM-EDS results were utilized to determine the relative elemental content and distribution of Fe and S (figure 2). Specifically, Fe and S elements were found to be homogenously dispersed within the octahedral motif, as noted by figures 2(B) and (C), respectively. From the accompanying EDS spectra, the relative ratio between the Fe and S elements was determined to be 1:2, respectively, again confirming the desired FeS2 composition (figure S6(A)).
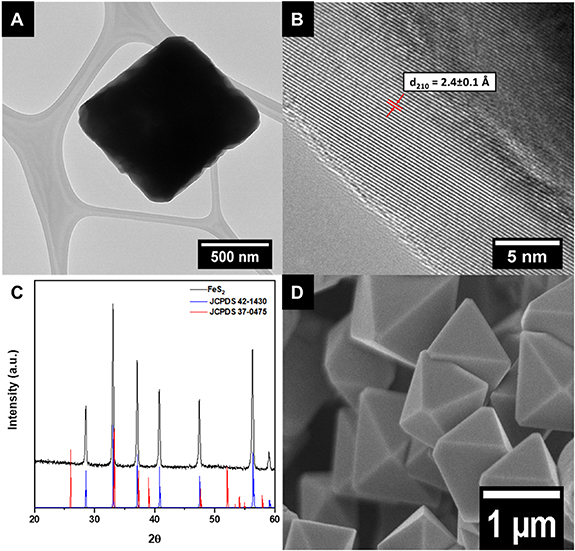
Figure 1. Experimental (A) TEM and (B) HRTEM images, (C) XRD pattern, and (D) SEM image of as-produced FeS2 octahedra. The relevant d210 spacing is indexed in (B). For the XRD data, database standards, associated with pyrite (blue, JCPDS # 42-1430) and marcasite (red, JCPDS 37-0475), are shown in (C).
Download figure:
Standard image High-resolution image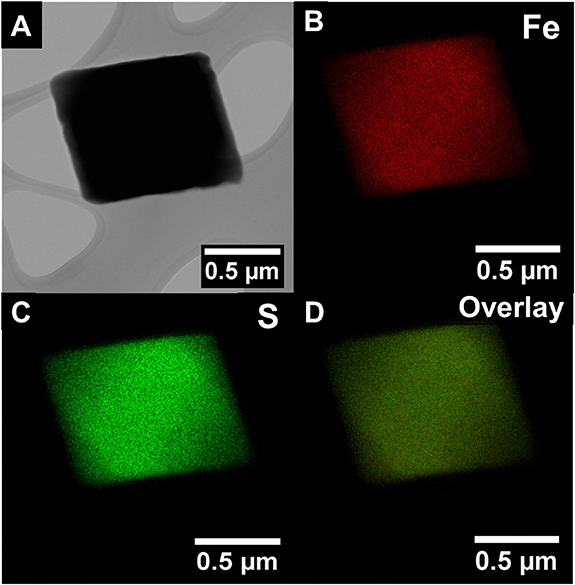
Figure 2. (A) HRTEM image, along with the corresponding HRTEM-EDS mapping spectra of (B) Fe, (C) S, and (D) overlay of FeS2 octahedra, are presented.
Download figure:
Standard image High-resolution imageHowever, further experimentation, including XPS and electrochemical characterization and testing, could not be conducted on pristine FeS2 alone, because of the low yield (∼2 mg) of the original reaction. This situation could be ascribed to our inability, despite significant time expended and numerous iterations attempted, to upscale this synthesis to hundreds of mg, a necessity for ensuring the interpretability of the resulting electrochemical analysis. In fact, the quality of the products of these larger-scale syntheses was characterized not only by the appearance of compositional impurities such as marcasite but also morphological contaminants such as spheres [40]. Therefore, moving forward, only Fe3S4 nanosheets and their corresponding MWNT-based composites were subjected to electrochemical testing.
3.3.2. Characterization of as-prepared Fe3S4 and Fe3S4/MWNT/graphene composites
Optimized Fe3S4 nanomaterials were characterized with XRD to ascertain the compositional purity of spinel Fe3S4 (figure 3(C)). As observed from the XRD data, the experimental pattern (black) clearly matches that of the database spinel pattern, expected for greigite Fe3S4 (red, JCPDS 89-1998) with no apparent impurities. HRTEM images (figures 3(A) and (B)) show consistent features with that noted in the SEM image (figure 3(D)). Specifically, we noted the appearance of nanosheets, measuring ∼35 ± 15 nm in width and characterized by crimped edges that were roughly microns in length. Furthermore, HRTEM analysis of these nanosheets suggested a d spacing value of 2.9 ± 0.1 Å, consistent with the expected (311) Fe3S4 plane (figure 3(B)). Moreover, the corresponding Fe3S4/MWNT composite was also analyzed using HRTEM (figure S7(A)); the blue arrows indicate the locations of adjoining MWNTs. In the corresponding HRTEM image of the Fe3S4/graphene composite, the blue arrows point to the presence of graphene (figure S7(B)). Complementary HRTEM-EDS was utilized to determine the elemental distribution of Fe and S (figure 4). Both Fe and S elements were perceived to be homogeneously dispersed within the nanosheets, as noted in figures 4(B) and (C), respectively. From the EDS spectra, the relative ratio between the Fe and S elements was found to be 1:1.3 respectively, thereby verifying the anticipated Fe3S4 composition (figure S6(B)).
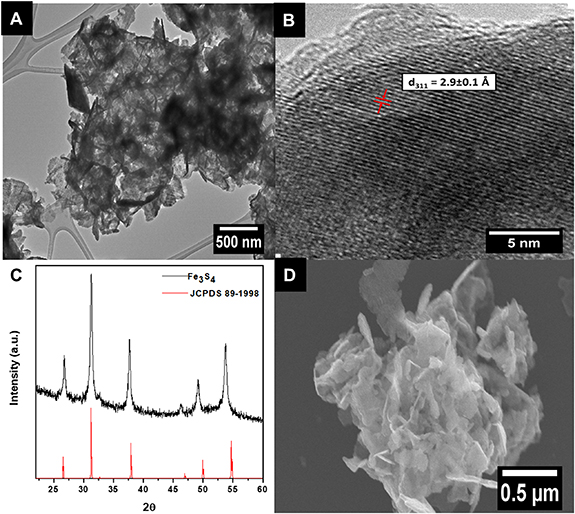
Figure 3. (A) and (B) HRTEM images, (C) XRD pattern, and (D) SEM image of Fe3S4 nanosheet aggregates. The relevant identifiable d311 spacing is indexed in (B). For the XRD data, database standards, associated with greigite (red, JCPDS # 89-1998), are shown in (C).
Download figure:
Standard image High-resolution image
Figure 4. (A) HRTEM image and accompanying HRTEM-EDS mapping spectra of (B) Fe, (C) S, and (D) the associated overlay of Fe3S4 nanosheets.
Download figure:
Standard image High-resolution imageBy contrast with FeS2, we were able to generate sufficient quantities of Fe3S4 for further analysis. Specifically, the surface chemistry of these nanosheets was probed using XPS, wherein we collected data on the Fe 2p and S 2p regions. The S 2p spectra consisted of both S2− and S− species, due to the spin–orbit coupling of the S orbitals (figure 5(A)) [59]. In particular, the S2− peaks were located at both 163.0 and 164.2 eV, corresponding to the 2p3/2 and 2p1/2 peaks, respectively, whereas the S− 2p1/2 peak was positioned at 161.2 eV. The Fe 2p region was analyzed, incorporating the presence of two oxidation states of iron, namely Fe2+ and Fe3+ (figure 5(B)). The associated peaks for Fe2+ and Fe3+ were found not only at 709.6 and 712.2 eV for the 2p3/2 peaks but also at 723.2 and 725.8 eV for the 2p1/2 peaks, respectively, all of which agreed with the previous literature [59]. Because of the observation of the mixed oxidation states of both Fe and S, these findings further validated our assertion that Fe3S4 had indeed been produced.
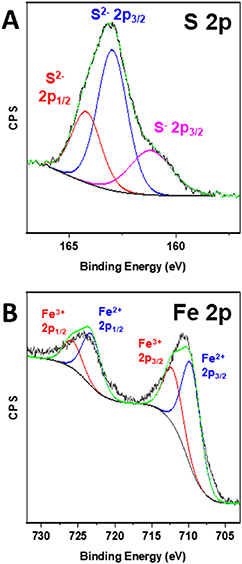
Figure 5. XPS spectra of as-obtained Fe3S4 nanosheets, associated with (A) the S 2p region and (B) the Fe 2p region.
Download figure:
Standard image High-resolution imageThe Fe3S4/MWNT composite was also analyzed using XPS with little to no changes noted in the profiles of the S 2p and Fe 2p spectra (figures S8(A) and (B) respectively). Within the S 2p region, the S2− signal indicated the presence of not only peaks located at 163.2 and 164.4 eV for the 2p3/2 and 2p1/2 peaks respectively but also a S− 2p1/2 peak situated at 160.9 eV (figure S8(A)). With respect to the Fe 2p region, by analogy with pristine Fe3S4, we observed the presence of two oxidation states, namely Fe2+ and Fe3+ species (figure S8(B)). In particular, Fe2+ peaks were observed at 709.5 and 723.2 eV for the 2p3/2 and 2p1/2 signals, respectively, whereas Fe3+ manifested itself as peaks present at 712.0 and 725.7 eV for the 2p3/2 and 2p1/2 data, respectively. Furthermore, the C 1s region exhibited peaks, indicative of C–C and C–O bonds at 284.4 and 286.5 eV respectively, comparable to previously published literature on metal sulfide/MWNT composites (figure S8(C)) [43].
The analogous Fe3S4/graphene composite was also probed using XPS with little to no alterations observed at the profiles of the Fe 2p and S 2p spectra, associated with either the Fe3S4 or the corresponding MWNT composite (figures S8(E) and (D) respectively). With respect to the S 2p region, a S2− signal consisted of features, situated at 163.0 and 164.1 eV, and could be attributed to the 2p3/2 and 2p1/2 peaks respectively (figure S8(D)). In this case, we did not observe any extraneous S− peaks. Regarding the Fe 2p region, by analogy with our prior discussion of similar samples, two oxidation states were noted that could be assigned to Fe2+ and Fe3+ species (figure S8(E)). In particular, Fe2+ peaks were observed at 710.3 and 723.8 eV, associated with the 2p3/2 and 2p1/2 signals, respectively, whereas Fe3+ peaks located at 712.4 and 726.4 eV could be assigned as 2p3/2 and 2p1/2 data, respectively. Next, the C 1s region was found to exhibit 2 peaks, similar to what we had found for the MWNT composites above, and these signals could be attributed to the presence of C–C and C–O bonds at 284.2 and 286.0 eV, respectively. Our findings are comparable to previously published literature on related metal sulfide/graphene composites (figure S8(F)) [8]. Collectively, this combination of diffraction, microscopy, and spectroscopy data indicates that we were able to fulfill our stated objective herein of optimizing sample uniformity, homogeneity, and monodispersity in terms of the isolated chemical composition and morphology of as-generated Fe3S4 nanosheets and their associated Fe3S4/graphene and Fe3S4/MWNT composites.
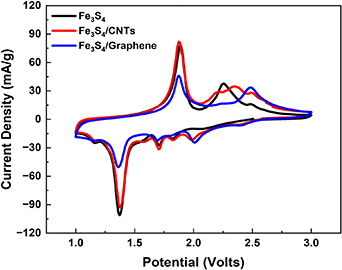
The CV experiments were conducted to probe the electrochemistry of the Fe3S4 structure and associated composites within lithium half cells. We note that a non-toxic ether, DPGDME, was selected as the electrolyte to provide for a benign battery system. The results illustrated in figure 6 display cyclic voltammograms for Fe3S4, Fe3S4/MWNT, and Fe3S4/graphene, respectively. The overall reactions taking place can be represented by the following: Fe3S4 + 8Li+ + 8e− → 4Fe + 3Li2S [1]. The initial CV curves show three distinctive peaks in the reduction region at approximately 1.37 V, 1.58 V, and 1.87 V. These peaks have been previously assigned to the formation of Lix Fe3S4 at ∼1.8 V, the reduction of Fe3+ to Fe2+ at ∼1.6 V, and a two-phase reaction to form Fe0 and Li2S at ∼1.37 V, respectively [1]. Two distinctive peaks are observed in the charge region at approximately 1.9 V and 2.5 V, corresponding to the oxidation of Fe into Li2FeS2 and the delithiation of Li2FeS2 into either Li2−x FeS2 or FeS, respectively [1, 4, 5]. Interestingly, figure 6 demonstrates differences among the sample types. The delivered current density for Fe3S4/graphene is smaller than that of the pure Fe3S4 and that of the Fe3S4/MWNT composite; properly understanding these observations will be the basis of more extensive characterization studies in the future. Nevertheless, these preliminary findings suggest that MWNTs are a more effective electrode additive for these sulfide-based materials as compared with graphene.
Figure 6. Cyclic voltammetry measurements of (black) Fe3S4, (red) Fe3S4/MWNTs, and (blue) Fe3S4/graphene.
Download figure:
Standard image High-resolution image
4. Conclusions
In summary, two chemically distinctive types of iron sulfides, considered to be electrochemically promising anode materials for LIBs, were synthesized using a novel microwave-assisted method. Individual reaction parameters, such as iron precursor salt type, time, temperature, solvent combination, metal:sulfur ratio, and sulfur precursor type, were systematically probed and subsequently optimized. Furthermore, to enhance conductivity, either MWNTs or graphene nanoplatelets were added in, using an ex-situ method. The materials were analyzed using a suite of characterization techniques, including SEM, TEM, EDS, and XRD.
Pyrite FeS2 was successfully generated as an octahedral motif, possessing average size dimensions of 1.1 μm using an optimized protocol in which a 2:3 M:S precursor ratio immersed in a medium consisting of a 2:1 H2O:EG solvent ratio by volume was irradiated at 180 °C for 30 min in the combined presence of ferric chloride and TAA. By analogy, greigite Fe3S4 could be produced as nanosheet aggregates using an optimized procedure in which a 1:2 M:S precursor ratio of FeCl2:LC was dispersed within a 2:1 H2O:EG solution and subsequently heated via a microwave-assisted reaction process for 10 min at 180 °C. As noted above, to the best of our knowledge, we are the first to produce a uniform series of not only pure pyrite FeS2 octahedra but also Fe3S4 nanosheets with well-defined composition and morphology using a relatively simple and rapid (under 30 min) 'one-step' microwave-assisted protocol, operating under neutral conditions and in the absence of surfactants. In doing so, we have put forward further evidence that microwave irradiation can be used to generate distinctive families of functional and energy-relevant nanomaterials. The tested materials demonstrate electrochemical activity consistent with prior reports, thereby featuring the viability and validity of our as-developed synthetic methods towards producing useful motifs for energy storage.
Acknowledgments
All of the work described in these studies was funded as part of the Center for Mesoscale Transport Properties (m2M), an Energy Frontier Research Center supported by the U.S. Department of Energy, Office of Science, Basic Energy Sciences, under Award #DE-SC0012673. Experimental research characterization was carried out in part at the Center for Functional Nanomaterials, Brookhaven National Laboratory, an Office of Science User Facility, which is supported by the U.S. Department of Energy, Office of Basic Energy Sciences, under Contract No. DE-SC0012704. E S T acknowledges funding from the William and Jane Knapp Chair for Energy and the Environment. E M B acknowledges support from the National Science Foundation Graduate Research Fellowship Program under Grant No. 2234683. Any opinions, findings, and conclusions or recommendations expressed in this material are those of the author(s) and do not necessarily reflect the views of the National Science Foundation.
Data availability statement
All data that support the findings of this study are included within the article (and any supplementary files).
Supplementary data (4.3 MB PDF) Additional sets of microscopy, diffraction, and spectroscopy characterization results obtained on as-prepared samples, discussed in the main text, are included and presented.