

Abstract
High-reflection interference mirrors for current gravitational wave detectors (aLIGO, Advanced Virgo, KAGRA) are made of high-quality oxide multi-layers deposited by ion beam sputtering (IBS) at the Laboratoire des Matériaux Avancés (LMA). For this task, LMA uses a large IBS custom-made machine (the grand coater GC) able to deposit very uniform coatings over very large surfaces, with diameter of some tens of cm. We report for the first time about the optical characterization by spectroscopic ellipsometry of oxide coatings deposited by the GC under strictly the same conditions used for the production of interference mirrors. We have investigated oxide materials like silica (SiO2), tantala (Ta2O5) and titania-doped tantala (Ti:Ta2O5), providing for each material a broad-band (190–1700 nm) accurate determination of the complex index of refraction, with particular attention to wavelengths used in interferometers. Particular focus has been dedicated to the influence of Ti-doping on tantala coating. The doping induces a red-shift of the optical gap and an increase of the NIR refractive index. Furthermore, doping induces a decrease of the so-called Urbach energy, consistent with the well-known reduction of the internal friction in these kind of systems.
Export citation and abstract BibTeX RIS

Original content from this work may be used under the terms of the Creative Commons Attribution 3.0 licence. Any further distribution of this work must maintain attribution to the author(s) and the title of the work, journal citation and DOI.
1. Introduction
First detections of gravitational waves have opened a new era on multi-messenger astronomy [1–3], leading to the determination of fundamental quantities such as the Hubble constant [4]. This remarkable result has been achieved thanks to the efforts dedicated to the development of highly sensitive interferometric gravitational-wave detectors (GWD) [5, 6]. Such ground-based interferometers use large, massive suspended mirrors as gravitational field probes, where the mirror high-reflection coatings are made of stacked oxide materials having alternate refractive index. In facts, mirrors used in current interferometers are ion beam sputtered (IBS) coatings made of several doublets of low- and high-index of refraction amorphous oxides [7]. The mirrors in operation have been produced at Laboratoire des Matériaux Avancés (LMA, Lyon, France) using an IBS custom-made apparatus (Grand Coater, GC), able to deposit very uniform coatings over very large surfaces, with diameter of some tens of cm.
Current GWD mirrors exploit silica (SiO2) as low-index material and tantala (Ta2O5) or titania-doped tantala (Ti:Ta2O5) as high-index material. More precisely, a stack of SiO2 and Ti:Ta2O5 deposited on large, massive silica substrate is adopted at Advanced LIGO (aLIGO) and Advanced Virgo (AdV) [8]. A stack of SiO2 and Ta2O5 deposited on sapphire (Al2O3) substrate is adopted at KAGRA [9], until materials more appropriate for cryogenic temperature are available.
Despite the high-quality optical properties and uniformity, these coatings are the dominant source of thermal noise of detectors [10], limiting the sensitivity of the experiment. Coating thermal noise is mostly caused by the high-index material which has a higher internal friction than silica [11]. Indeed, this factor led to the development of titania-doped tantala [12] as high refractive index material, which presents a lower mechanical loss than tantala. The first study of mechanical properties of Ti:Ta2O5 was reported in [13] and revised values of mechanical losses can be found in Granata et al [14]. There is a continuous effort to increase detectors sensitivity by improving coating mechanical properties.
There are several strategies aiming to lower thermal noise. For example, a high refractive index contrast of materials allows to reduce the total thickness of the coating and hence to decrease the total thermal noise. Once the coating materials are selected, the knowledge of layers refractive index allows to optimize the thickness ratio of the stack compounds, thus possibly reducing the thickness of the dissipative layers [15]. In this view, a precise determination of refractive index and thickness of coating layers is a key ingredient in the improvement of the mirrors. Adding to this, an accurate knowledge of coating thickness is important in order to evaluate the density of the materials under investigation, which is an essential parameter in the analysis of mechanical loss data providing information about the internal friction [14, 16].
Spectroscopic ellipsometry (SE) is a feasible method to investigate optical properties and thickness of thin film materials. It is known that the optical properties and density of amorphous solids depend on micro-structure and morphology, in turn finally depending on deposition method and parameters. Here we report on a SE study of oxide coating materials deposited by the GC, under the same condition used in the deposition of multi-layers of current interference mirrors. The analysis of SE data has been performed by exploiting well known models describing optical properties of amorphous oxides (e.g. Tauc–Lorentz (TL) [17] and Cody–Lorentz (CL) [18] models) providing a Kramers–Kronig (KK)-consistent determination of the complex refractive index in a wide energy region (from NIR to UV). A wide-band analysis addresses the investigation of the absorption edge, which provides information on the short- and medium-range atomic structure through the absorption involving localized states [19].
Particular attention has been dedicated to Ti:Ta2O5 films that, to our knowledge, have not been studied by SE before. SE allows a careful determination of coating thickness and optical properties in a wide wavelength range and in particular of the near IR refractive index. Preparation conditions (coater machine used, growth parameters, annealing parameters) are well representative of the films adopted in advanced GWD mirrors. In these respects, this work can be considered as an updated reference for the refractive index of the current GWD mirror materials.
We remark that the knowledge of refractive index of high-quality amorphous oxides with low thermal noise is important not only for GWD but also for other experiments using coating technology [20].
2. Materials and methods
The samples are IBS mono-layers of relatively thick oxide materials, deposited on 1 mm thick silicon wafers, having 2'' of diameter and one surface rough in order to avoid backside light reflections, covered by a thin native oxide layer. For ellipsometry measurements aimed to determine optical properties of the coating a reflective substrate is to be preferred to transparent materials (e.g. silica), to increase the reflected signal, also avoiding problems arising with substrate backside reflections. Deposition has been made by the GC, which allows to obtain highly uniform coatings with high repeatability. We considered SiO2, Ta2O5 and Ti:Ta2O5 coatings. In the case of the doped material, the ratio of Ti to Ta has been obtained through Rutherford backscattering spectrometry (RBS) measurements, taken on witness samples having coating deposited in the strictly same condition of the samples presented here. In particular, the percentage atomic concentrations obtained by RBS are Ta = 22.2 ± 0.7, Ti = 6 ± 0.6, O = 69 ± 7 and Ar = 4 ± 2, thus giving a Ti to Ta ratio of 0.27 ± 0.04. The presence of argon in the coating is due to the deposition method. The deposition conditions are exactly the same used in the production of the stack interference mirrors.
High-reflective coatings for GW detectors undergo a standard post-deposition heating treatment at 500 °C for 10 h, to reduce optical and mechanical losses. For this reason, results refer to the coatings after the annealing.
Coating refractive index and thickness have been determined by SE [21] by coupled analysis of sets of data taken with two different commercial instruments: a rotating compensator ellipsometer (J A Woollam M-2000), operating in the 245–1700 nm wavelength range probing 674 points, and a J A Woollam VASE ellipsometer, operating in the 190–1100 nm range probing 910 points, thus obtaining information related to a broad wavelength range extended from 190 to 1700 nm. The (Ψ, Δ) measurements have been acquired at different angles 55°, 60°, 65°, close to the Brewster angle θB (for example, θB ∼ 55.3° for SiO2 and θB ∼ 63.7° for Ta2O5).
By combining the data obtained from the two instruments it is possible to investigate a wide energy region, 0.7–6.5 eV. The two ellipsometers cover an overlapping energy region where comparable results have been obtained. The analysis is done independently for VASE and M-2000 data and eventually the information is combined in order to obtain the final results.
SE measures the change in light polarization after reflection from the sample under investigation. The ellipsometry angles (Ψ, Δ) are related to the Fresnel reflection coefficients rp, rs, through the well known formula

The experimental data (Ψexp, Δexp) are usually compared with simulations (Ψmod, Δmod) based on realistic optical models (appendix A) of the system under investigation [21]. Models account parametrically for the complex dielectric function ε and the thickness of layers in the optical stack. In order to optimize the parameters' values and test the validity of the model, minimization of mean squared error (MSE) is exploited

where N is the number of experimental points, M is the number of the parameters used in the model to simulate the points and σexp is the standard deviation of experimental data.
Materials properties obtained by the two ellipsometers are comparable within the models uncertainty and under this evaluation, for sake of clarity only the analysis done on VASE data are showed.
The optical response of the substrate has been characterized with prior dedicated measurements (appendix B). Once the substrates optical properties are determined it is possible to concentrate on the analysis of coating optical properties.
3. Results
3.1. High-index materials
In figures 1 and 2, (Ψ, Δ) data of a Ta2O5 and Ti:Ta2O5 representative sample obtained by VASE ellipsometer are presented, respectively. Data are presented up to 6 eV because for higher energy the signal to noise ratio shows a degradation and data are no longer useful for fitting purposes.

Figure 1. SE from tantala coatings. Experimental data obtained with the VASE instrument at three angles of incidence are compared with best fit curves.
Download figure:
Standard image High-resolution imageIt is interesting to have a preliminary look at the data, which may provide useful hints towards a quantitative analysis. The interference features, related to multiple reflections in the transparent region of the coating, stop quite sharply around 4 eV; this behavior marks the fundamental absorption edge.
Similarly to previous work on related systems [22], we have analyzed the data through a three-layers model including the substrate, the thin film and a surface layer. The latter was modeled through a Bruggeman effective medium approximation (EMA) layer, which accounts for roughness. A sketch of the model is showed in figure 2(a). The roughness allows to improve the fit model especially in the strong absorption region (UV), where light mostly probes the surface features of the film. As showed in table 1, the roughness obtained on these coatings is less than 1 nm and the value is comparable with atomic force microscopy (AFM) measurements of root mean square roughness on this kind of samples [22]. Since its value is less than 1% of the coating thickness, the EMA layer does not affect substantially the coating fit optical parameters, especially in the NIR region.
Table 1. MSE, thickness and roughness of tantala and titania-doped tantala coatings for CL and TL models, obtained by VASE ellipsometer.
| Coating | MSE | Thickness (nm) | Roughness (nm) | |||
|---|---|---|---|---|---|---|
| (CL) | (TL) | (CL) | (TL) | (CL) | (TL) | |
| Ta2O5 | 10 | 10 | 590 | 590 | 0.23 | 0.28 |
| Ti:Ta2O5 | 5 | 6 | 511 | 511 | 0.32 | 0.28 |
Regarding the coating optical model, in a first step of the analysis Cauchy and 2-poles functions have been used in order to describe the optical properties in the region of high transparency, below 3 eV. The values of thickness and refractive index of the coating obtained by this kind of analysis have been used as starting point in physical models aimed to reproduce data in the whole measured energy region. Then, addressing the fitting of broadband data including the absorption region, the dielectric function ε2 has been modeled by KK-consistent TL and CL formulas (appendix A). Both models reproduced well the data with comparable MSE and provided strictly similar values for the thickness of the film and roughness layer (1) and for the refractive index (2). Note that both TL and CL model provided IR refractive index consistent with the values derived from the models on the transparent region with the Cauchy or two-pole models. Indeed, the CL model provides a slightly better fit in the absorption edge region. The good agreement between data and CL simulations can be appreciated in figure 2 and the corresponding MSE value is in table 1.
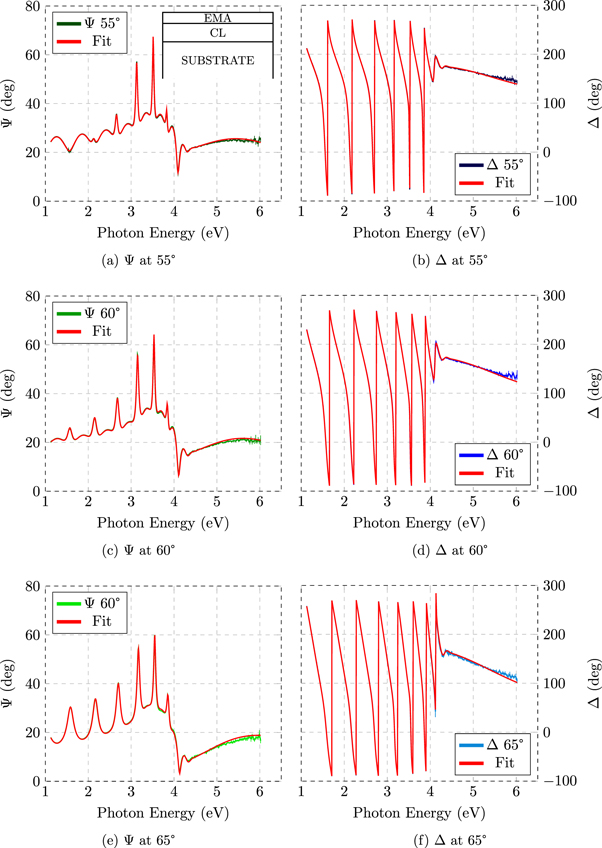
Figure 2. SE from Ti-doped tantala coatings. Experimental data obtained with the VASE instrument at three angles of incidence are compared with best fit curves. (a) is the sketch of the three-layers model.
Download figure:
Standard image High-resolution imageTable 2. Refractive index at selected wavelengths and energy gap Eg of coatings after the annealing at 500° C. 1064 nm is the wavelengths of operation in current GWD interferometers (aLIGO, AdV). The gap Eg has been worked out using the Tauc–Lorentz and Cody–Lorentz models described in the appendix A. The values reported here are the average of the values coming from the two models and the uncertainty corresponds to the difference of these values.
| Coating | Refractive index | Eg | |||
|---|---|---|---|---|---|
| @405 nm | @632 nm | @1064 nm | @1550 nm | (eV) | |
| Ta2O5 | 2.20 ± 0.01 | 2.09 ± 0.01 | 2.05 ± 0.01 | 2.03 ± 0.01 | 4.0 ± 0.1 |
| Ti:Ta2O5 | 2.27 ± 0.01 | 2.14 ± 0.01 | 2.09 ± 0.01 | 2.08 ± 0.01 | 3.6 ± 0.1 |
| SiO2 | 1.474 ± 0.003 | 1.460 ± 0.003 | 1.452 ± 0.004 | 1.45 ± 0.01 | — |
From the best fit dielectric functions it is possible to obtain the complex refractive index of the films (n, k), which are shown in figure 3 on the examples of the CL model. The results are comparable to the optical properties obtained by using the M2000 ellipsometer. In figure 3 we also show the complex refractive index of un-doped tantala coating, obtained after a closely similar analysis procedure. As detailed in appendix A one of the parameters obtained by the CL model is the fundamental absorption edge (optical energy gap). Fitting results regarding the refractive indexes at common wavelengths and energy gaps are shown in table 2.
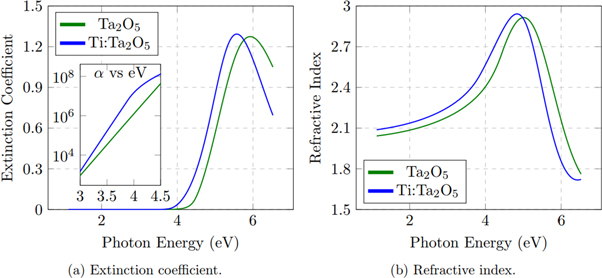
Figure 3. Comparison of the complex index of tantala (green) and titania-doped tantala (blue) coating obtained by CL model. (a) Extinction coefficient and  as function of energy in logarithmic scale, (b) refractive index.
Download figure:
Standard image High-resolution imageThe comparison between doped and un-doped samples helps to understand how optical properties of tantala-based coatings are affected by titania doping. As reported in table 2 and also clearly visible in figure 3(a), the Ti-doping induces a red-shift of the absorption edge of about 0.4 eV with minor changes in the amplitude of the absorption resonance shape. This effect is responsible of the higher refractive index of titania-doped tantala with respect to the pure material in the NIR region by almost 2%, as reported in table 2 and visible in figure 3(b). The slightly larger refractive index provides a higher index contrast when building the stack for GWD mirrors.
Regarding Ti:Ta2O5 coating refractive index values, made at LMA, exploiting several Ti concentration were early presented in [12]. In that study Ti:Ta2O5 coatings were deposited using various coating machines and variety of deposition methods, which provide films with different mechanical and optical properties [7]. In particular, the deposition conditions adopted to create the coatings analyzed in [12] were not the same used to deposit the materials currently used in GWD. The analysis presented here exploits a broad-band spectroscopic investigation, including the absorption region of the film across and above the gap. It regards coatings deposited by the same machine and the same deposition conditions used to build high-reflection mirrors. For this reason, the values reported here for the refractive index must be considered as the reference for the coating currently adopted in GWD.
Another interesting feature regards the Urbach tails, which are related to the degree of structural disorder especially in amorphous materials [23]. The absorption coefficient α = 4πk/λ decays exponentially in the region where Urbach tails occurs [24]. Considering the  versus photon energy plot in logarithmic scale, shown as inset in figure 3(a), we can observe a linear behavior close to the absorption edge. The slope of the straight line is related to the inverse of the Urbach energy Eu (see appendix A). It is evident from figure 3(a) that the doped coating has an Urbach energy smaller than the un-doped one, 0.11 ± 0.01 eV and 0.13 ± 0.01 eV respectively, as resulting from the fit analysis by the CL model. This finding is consistent with recent work, exploiting a combination of electron diffraction data and atomic modeling, claiming that the structure of Ti:Ta2O5 has a short-range atomic configuration more homogeneous than Ta2O5 [25].
Coming to the tantala coating, the refractive index at 1064 nm is comparable with the one reported in previous work using the same deposition conditions (2.03–2.06 in [13]), whereas it is slightly lower than the one obtained in other laboratories by using a different coater machine and hence different deposition conditions (2.09 in [26]). Comparable values of refractive index at 400 nm can be found in [27]. Furthermore, the energy gap presented in table 2 is comparable to IBS amorphous tantala analyzed by SE in [28].
3.2. Low-index material: silica
In order to reproduce the experimental data we used Cauchy or two poles function as optical models of the coating, with EMA layer on top to simulate the surface roughness which is of the order of 3 nm over a film thickness of 725 ± 2. In figure 4 (Ψ, Δ) data and fit curves are shown at different angles. It is evident from the data that the oscillations, related to the interference of the multiple reflection of transparent film, do not stop pointing out that any absorbing mechanism occurs in the whole energy region. Indeed, the coefficient extinction is too low to be appreciated by reflection SE whereas in figure 4(c) one can finds the best-fit refractive index as function of the energy.
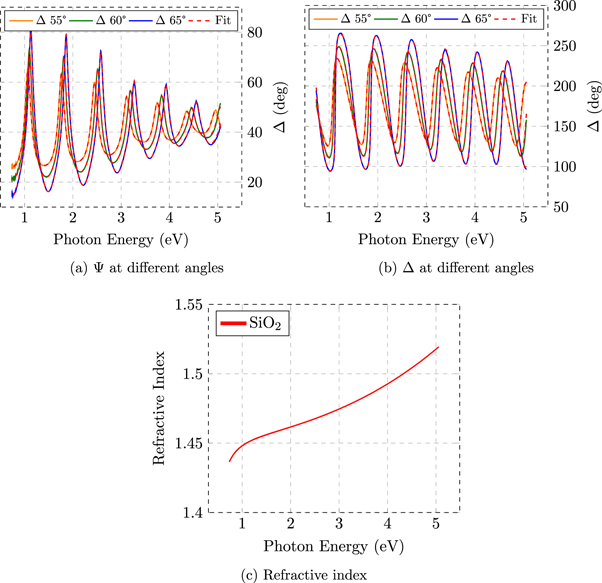
Figure 4. Experimental data and fit curves at different angles for silica coating. (c) Refractive index of silica coating as function of energy.
Download figure:
Standard image High-resolution imageThe final results presented in table 2 are obtained by taking into account Cauchy and poles models which give comparable and reasonable MSE, considering the measurements of both ellipsometers.
The resulting refractive index is comparable with previous determination, such as those reported for a silica film deposited by dual Ar+ IBS coater [29], which use a growth method similar to the GC. Furthermore, at 600 nm the refractive index of our coating is comparable to other experiments reporting on ion-beam assisted SiO2 growth [30].
4. Conclusion
High quality oxide coating materials deposited by IBS have been analyzed by SE, covering a wide energy region (UV–Vis–NIR). The materials under investigation are thin films (monolayers) of silica, tantala and Ti-doped tantala deposited at LMA using the so-called grand coater apparatus. Growth conditions, post-growth treatments and Ti-doping were the same adopted for the coating currently used for the mirrors of GWD interferometers (aLIGO, AdV and KAGRA). Table 2 shows a summary of the results pointing out the refractive index of the analyzed coatings for selected wavelengths of common interest in technology research, including 1064 nm, the laser wavelength used in GWD interferometers operating at room temperature and 1550 nm, a wavelength suggested for interferometers working at cryiogenic temperatures.
Tantala and Ti-doped tantala SE data have been analyzed modeling the absorption region exploiting Tauc- and CL oscillators. The doping induces a clear red-shift of the optical gap, as expected for the formation of an uniform mixed Ta–Ti oxide. Amplitude and width of the CL (or TL) oscillator are apparently much less touched by the doping. As a result, doping induces an increase of the NIR refractive index.
In the CL model, the so-called Urbach tails of the mixed oxide are less extended than in the case of pure tantala, suggesting a morphology of the amorphous oxide with lower deviation from the ideal crystal. This finding has possible interesting implications regarding a deeper comprehension of the mechanical behavior of these coatings for GWD purposes. Indeed, the finding regarding the Urbach tails parallels the well-known (yet still not fully understood) doping-induced reduction of internal friction observed in these films [7]. It has been shown that there is a correlation between mechanical losses and the disordered structure of this coatings [16, 25]. The results of this work offer therefore new stimuli for a more systematic investigation of the correlations between the optical properties of high quality Ti-doped tantala coatings, with particular attention to the extension of Urbach tails, and their mechanical properties.
Appendix A.: Optical models
For highly transparent materials (like silica), Cauchy function and pole oscillators are used to describe the real part of the dielectric function ε1. The pole oscillators function reads

where An is the amplitude and En is the energy position of the pole n. In the presence of absorption a model which describes the imaginary part of the dielectric function ε2 is needed, and ε1 can be obtained by the KK relations. Since the coating materials are amorphous, the models describing the absorption edge differ from Lorentz model

where A, E0 and Γ represent the amplitude, the resonant energy and the oscillator width respectively. The difference is related to a factor G(E), which depends on the description of optical transitions [31] and the imaginary part of the dielectric function reads

with

where Et is the limit energy between the Urbach tail transitions and 'band-to-band' transitions and EU is the Urbach energy.
The TL [17] model does not include the Urbach tail within the gap so Et converges to the energy gap Eg and U(E) = 0. Furthermore, it assumes parabolic density of states and a constant momentum matrix element for the band-to-band transition and G(E) can be written as

The CL [18] model considers the Urbach tail transitions and assumes a constant dipole matrix element instead, so that

where Ep is the transition energy separating the absorption onset behavior from the Lorentz oscillator.
The films are extremely smooth as obtained by AFM measurements performed in previous work [22] and to simulate the surface roughness of the film when it is necessary, one can introduce an EMA [32] layer mixes the top material with void (n = 1 and k = 0) using a fraction of 50%.
Appendix B.: Substrate
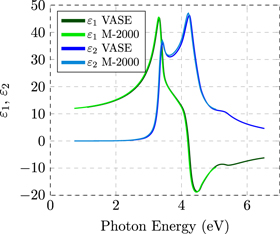
Creating a model that reproduces well the optical properties of the substrate is extremely important for the analysis of the coating. In fact, any unknown feature of the substrate will introduce uncertainties in describing the optical properties of the coating materials. This model is set as bottom layer in the analysis of the optical system. In the case of silicon wafers the model consists of two layer. The first includes several oscillators centered at critical points of the joint-density of state [33]. The other one is a ultra-thin layer, of the order of 2 nm, representing the native thermal oxide and described by library optical properties [34].
The data acquired by the two ellipsometers have been analyzed independently using the same method and, as showed in figure B1, the results are equivalent within the fitting errors.
Figure B1. Real (green) and imaginary (blue) part of dielectric function for silicon substrate obtained by VASE and M-2000 (light colors) ellipsometers.
Download figure:
Standard image High-resolution image