


Abstract
The hydrological implications of discontinuous permafrost thaw in peatland-dominated basins are not well understood. While there is evidence suggesting that permafrost-thaw-driven land cover change increases annual runoff and the runoff ratio in the Taiga Plains of northwestern Canada, few studies have evaluated the impact on small to medium sized basins (<105 km2) outside this ecoregion. Here, we assess runoff, runoff ratio, and precipitation trends for 34 peatland-dominated basins, of which 28 are in the discontinuous and sporadic permafrost zones and 6 in adjacent permafrost-free environments. We calculated annual and monthly trends between 1970 and 2016 using the Mann-Kendall test and found that annual runoff, runoff ratio, and precipitation increased significantly in 25%, 16%, and 13% of basins respectively, at a 5% significance level, and decreased significantly in 3%, 19%, and 9% of basins, respectively. Increased annual runoff ratios occurred exclusively in basins overlying permafrost, while increases and decreases in annual runoff and precipitation were found in both permafrost and permafrost-free basins. Increases of annual runoff and runoff ratio occurred independently of precipitation changes in only the Taiga Plains and in the Western Siberian Plain. Runoff during winter increased significantly in all ecoregions and occurred independently of the areal extent of permafrost, although the magnitude of these increases was small compared with those of April and May.
Export citation and abstract BibTeX RIS

Original content from this work may be used under the terms of the Creative Commons Attribution 4.0 licence. Any further distribution of this work must maintain attribution to the author(s) and the title of the work, journal citation and DOI.
Introduction
Permafrost underlies 25% of land area in the Northern Hemisphere (Gruber 2012). Globally, there is strong evidence that climate change is warming and thawing permafrost (Romanovsky et al 2010a, 2010b, Biskaborn et al 2016). In non-alpine sporadic (<30% areal) and discontinuous (30%–<80% areal) permafrost zones (Harris et al 1988), permafrost is most often found in peatlands (Vitt et al 1994, Camill 1999), organic terrains with a minimum peat accumulation of 30 cm (Russia) or 40 cm (North America) (Martini et al 2006). Peatlands cover approximately 3% of the global land area, two-thirds of which occur in the mid- to high-latitudes of North America (> 40° N) and Eurasia (> 50° N) (Martini et al 2006). The highest concentrations of northern peatland-dominated landscapes are found in the Western Siberian Plain in Russia and the Hudson Plains in Canada (Martini et al 2006). Similar landscapes occur in the Taiga Plains, Boreal Shield, and Boreal Plains in Canada, the Boreal Interior of Alaska, and the European Taiga of Fennoscandia (NWWG 1988, Martini et al 2006, Xu et al 2018). Despite their vast geographical extent and importance to hydrological (Smith et al 2010, Orlova and Branfireun 2014) and ecological (Camill 1999, Turetsky et al 2012)) processes, and carbon cycling (Gorham 1991, Köchy et al 2015), the impact of rapid permafrost thaw below peatland-dominated landscapes remains poorly understood (Kirpotin et al 2009, Sjöberg et al 2012, Raudina et al 2017).
Intensive field, remote sensing, and modelling studies in the peatland-dominated landscapes of the Mid-Boreal Taiga Plains provide key insights into how permafrost thaw can transform land covers (Chasmer and Hopkinson 2017, Carpino et al 2018) and consequently, change hydrological functioning (Helbig et al 2016, Connon et al 2014, 2018, Quinton et al 2019). Here, ice-saturated permafrost occurs below tree-covered peat plateaus that rise 1–2 m above the surrounding permafrost-free, treeless collapse-scar wetlands (Vitt et al 1994). The plateaus and collapse scars collectively form plateau-wetland complexes separated by channel fens or water bodies. Hydrological inputs to plateaus are strictly meteoric, while precipitation onto collapse-scars is augmented by runoff from surrounding plateau flanks. Plateaus have been described as 'permafrost dams' (Hayashi et al 2004) since their permafrost tables occupy an elevation above the water table of adjacent wetlands which are therefore impounded. However, permafrost thaw has generated channels between wetlands, and as a result, such thaw has increased the hydrological connectivity within plateau-wetland complexes (Connon et al 2014), the runoff contributing area of basins (Connon et al 2015), and therefore basin runoff (Connon et al 2018). Permafrost thaw has also increased the occurrence of talik layers which introduce new, year-round subsurface flowpaths to the basin drainage network (Devoie et al 2019) and thereby augment the above-mentioned increases of surface and near-surface flow (Connon et al 2018). These permafrost-thaw-driven land cover changes and their hydrological impacts provide a plausible explanation for the increasing annual basin runoff trends observed throughout most of the Taiga Plains since the mid-1990s that occurred without any significant change in precipitation (St. Jacques and Sauchyn 2009, Connon et al 2014).
At higher latitudes in the Taiga Plains, permafrost underlies the entirety of plateau-wetland complexes rather than the plateaus only; and the active layer of wetlands is thicker (∼1 m) than of plateaus (0.3–0.4 m) (Ecosystem Classification Group 2009). Permafrost thaw in these high-boreal basins of the Taiga Plains is not as advanced as at lower latitudes (Kwong and Gan 1994; Carpino et al 2018), and as a result they do not contain the runoff pathways that develop during more advanced stages of permafrost thaw (e.g., drainage channels, talik layers) present in the Mid-Boreal Taiga Plains (Connon et al 2015) that greatly enhance landscape drainage. This latitudinal variation in the form of peatlands has implications to their hydrological function. For example, the removal of permafrost impoundments and the development of drainage channels and talik layers appear to have enabled the Mid-Boreal basins of the Taiga Plains to generate more runoff per unit input of precipitation than basins at higher latitudes. However, it is expected that with on-going permafrost thaw, the hydrological functioning of the higher latitude basins of the Taiga Plains will transition toward that of the Mid-Boreal basins. Likewise, the peatland-dominated basins at the southern limit of permafrost, being in an advanced stage of permafrost thaw (Kwong and Gan 1994), have presumably already transitioned to a largely permafrost-free regime in terms of their hydrological functioning.
Other peatland landforms common in permafrost environments include polygonal peat plateaus, low and high center polygons, fen ridges, and palsas (Zoltai and Tarnocai 1974). While the hydrological impacts of permafrost thaw on high and low center polygons in the continuous permafrost zone (Liljedahl et al 2016) and palsas in the sporadic and discontinuous permafrost zone have received some attention (e.g. Seppälä 2011, Sjöberg et al 2012), polygonal plateaus and fen ridges have received far less. Nonetheless, peat plateaus of the type described above for the Taiga Plains are the most ubiquitous permafrost peatland form in the discontinuous permafrost regions of the world (Zoltai and Tarnocai 1974).
Changes to basin hydrological functioning can be detected from changes to the annual ratio of runoff to precipitation (i.e., the runoff ratio). Barring significant changes to land cover or to precipitation, the runoff ratio of a given basin should be relatively constant from year to year. Therefore, an increase in annual runoff ratio without an increase to annual precipitation suggests a physical basin transformation that has released water from long-term storage, increased runoff efficiency, or both. Since permafrost thaw is a major driver of land cover change in the Taiga Plains (Chasmer and Hopkinson 2017), the runoff ratio is a useful tool to diagnose the possibility of permafrost-thaw-driven hydrological change.
This study seeks to (1) determine if the increase in basin runoff observed throughout the Taiga Plains also occurs in other peatland-dominated, permafrost terrains elsewhere in the circum-polar region, or if such increases are unique to the Taiga Plains; and (2) evaluate the possibility of permafrost thaw induced changes to runoff from peatland-dominated basins in other circum-polar ecoregions using the relatively well studied Taiga Plains ecoregion as a frame of reference. These objectives will be accomplished by examining the runoff records of 28 peatland-dominated basins throughout the circumpolar discontinuous permafrost zone (DPZ) and sporadic permafrost zone (SPZ) for trends in runoff, runoff ratio, and precipitation. We also assess six peatland-dominated basins that are not underlain by permafrost but are in the seasonal frost zone (SFZ), to determine if the hydrological changes considered are exclusive to permafrost terrain. For each basin we will examine temporal patterns and trends for monthly and annual periods; and evaluate the spatial distributions of the identified trends according to ecoregion, mean annual air temperature (MAAT), latitude range, peatland percentage, permafrost zonation, and basin size.
Methods
Basin characteristics
Selection criteria for the 34 peatland-dominated basins (figure 1) included (a) a minimum gauging record length of 20 years, (b) basin area less than 100,000 km2, and (c) an absence of human impoundments or structures. The area of each basin occupied by peatland was quantified by cross-referencing true-colour Landsat and Copernicus imagery on (zoom.earth) with PEATMAP shapefiles (Xu et al 2018), and histosol or histolsel soil classifications from the Northern Circumpolar Soils Map, Version 1 (Tarnocai et al 2002). Basin peatland percentage and permafrost extent were estimated using PEATMAP and Brown et al (2002), respectively.

Figure 1. The locations of each drainage basin (white circles) and ecoregion (black boundaries) including the Taiga Plains (TP), Hudson Plains (HP), Boreal Plains (BP), Boreal Shield (BS), Boreal Interior (BI), European Taiga (ET), and Western Siberian Plain (WSP). Permafrost distribution is from Brown et al (2002).
Download figure:
Standard image High-resolution imageData sources and calculations
Daily runoff records were retrieved from the Water Survey of Canada (wateroffice.ec.gc.ca/), United States Geological Survey (waterdata.usgs.gov/), Finnish Environmental Institute (syke.fi/), Global Runoff Data Base (bafg.de/), and Russian Federal Water Resources Agency (gmvo.skniivkh.ru). A subset of Russian runoff was manually digitized using Russian Hydrometeorological Agency records and augmented to their digital records (Gidrometeoizdat 1956–2007). Monthly runoff was only available in the Hay, Keg, Bol'shol Yugan, Kazym, Konda, and Pur basins. Runoff was reported as average daily (m3 s−1 or ft3 s−1) and converted to monthly depths (mm) using basin area (km2). When records were missing, daily gap-filling was calculated using a running mean, while monthly gaps were filled using monthly means. For trend analysis, no more than 10% of basin's monthly runoff record was gap-filled. All runoff records and an annotated r-code (R Core Team 2019) are provided as supplementary information (available online at stacks.iop.org/ERC/3/075006/mmedia).
The Global Precipitation Climatology Center 0.5° × 0.5° v2018 gridded dataset (psl.noaa.gov/) provided monthly precipitation data. The gauge-based reanalysis dataset was selected for its global coverage (67,000 stations) and record length (1891–2016) (Schneider et al 2017). For each basin, precipitation grid cells or multiple arithmetically averaged cells were cropped with maximum 0.5° overlay. Grid cells were then converted to tables and joined with runoff time series to calculate monthly runoff ratios.
The National Centers for Environmental Prediction/National Center for Atmospheric Research (NCEP/NCAP) Reanalysis 1: Surface, provided MAAT for each basin (Kalnay et al 1996). The 2.5° × 2.5° gridded dataset available from 1948 to present provided near-surface air temperatures for each basin four times each day. Because the gridded dataset resolution was relatively coarse, a single 2.5° × 2.5° grid cell had to be used for multiple basins in several instances. Like the precipitation dataset, grid cells were converted to tables and joined with monthly and annual runoff time series after calculating mean monthly and mean annual air temperature.
All time series were organised by water year (01 October–30 September). An overall trend analysis period was defined as October 1969 to September 2016 (i.e., 1970–2016) because gridded precipitation data were not available after 2016. Monthly records were then summarised by annual water year. In three basins (Keg, Hay, and Overflowing), December–March runoff was not measured and therefore not gap filled, however trends were still calculated.
Trend analysis was conducted on annual and monthly intervals between 1970 and 2016 and for each intervening decade. Monthly trends were chosen because defining seasons in 34 basins distributed across 18.3° latitude and 234.5° longitude was impractical. Trends were assessed using the Mann-Kendall test (Mann 1945, Kendall 1975), a non-parametric, rank-based statistical test often applied to hydrological time series. The null hypothesis states that annual runoff, for example, arises from processes that are independent and random. The alternative hypothesis states that annual runoff increased or decreased as a monotonic trend. Next, Theil-Sens slope estimates (Sens 1968) were calculated and using the Box-Peirce test (Box and Pierce 1970) their residuals tested for lag-1 serial correlation — a condition where measurements closest-in-time strongly correlate (Hipel and McLeod 1994). In such instances a modified Mann-Kendall test, the variance corrected approach (Hamed and Rao 1998), was used. Significant trends were reported when Mann-Kendall p-values met a 5% significance level. Lastly, Pearson correlations were calculated between the slopes of significant trends and basin characteristics (latitude, peatland percentage, and basin area).
Results
Ecoregion and basin characteristics
Twenty-eight of the thirty-four basins occur within the DPZ or SPZ (table 1). The remaining six basins occur in the SFZ, approximately 25–150 km south of the SPZ. Peatland percentage estimated from PEATMAP closely matched the estimates provided by other studies for all ecoregions except for the European Taiga and Boreal Interior where the PEATMAP estimates were 13% to 29% lower (Xu et al 2018).
Table 1. Basin characteristics sorted by ecoregion and descending latitude. Peatland percentage estimates, permafrost zonation, and mean annual ground temperatures (where available) based on PEATMAP (Xu et al 2018), Brown et al (2002), and the Global Terrestrial Network for Permafrost (GTN-P) Database (gtnpdatabase.org/boreholes), respectively.
| Basin | Peatland | MAGT/ | Total | ||||||
|---|---|---|---|---|---|---|---|---|---|
| area | area | Permafrost | at depth | Start | End | trend | |||
| Basin name | Lat. | Long. | (km2) | (%) | Zone | °C/m | Year | Year | Years |
| Taiga Plains | |||||||||
| Martin | 61.89 | −121.61 | 2050 | 28% | DPZ | −0.1/5 | 1973 | 2016 | 44 |
| Jean Marie | 61.45 | −121.24 | 1310 | 46% | DPZ | −0.1/5 | 1973 | 2015 | 43 |
| Scotty | 61.42 | −121.46 | 152 | 37% | DPZ | 0.2/6 | 1996 | 2016 | 21 |
| Birch | 61.34 | −122.09 | 542 | 37% | DPZ | −0.1/5 | 1975 | 2016 | 42 |
| Trout | 61.14 | −119.84 | 9270 | 37% | DPZ | −0.2/6 | 1970 | 2016 | 47 |
| Blackstone | 61.06 | −122.89 | 1910 | 36% | DPZ | −0.1/5 | 1992 | 2016 | 25 |
| Hay | 59.97 | −117.63 | 36900 | 36% | SPZ | −0.2/6 | 1976 | 2016 | 41 |
| Keg | 57.74 | −117.62 | 649 | 9% | SFZ | ―/― | 1972 | 2015 | 44 |
| Hudson Plains | |||||||||
| Weir | 57.03 | −93.45 | 2280 | 96% | DPZ | −4.7/4.5 | 1978 | 2016 | 39 |
| Angling | 56.67 | −93.64 | 1560 | 75% | DPZ | −4.7/4.5 | 1980 | 2016 | 37 |
| Shamattawa | 54.28 | −85.65 | 883 | 96% | DPZ | ―/― | 1970 | 2016 | 47 |
| Pontax | 51.53 | −78.1 | 4710 | 57% | SPZ | ―/― | 1976 | 2012 | 37 |
| Boreal Shield | |||||||||
| Taylor | 55.49 | −98.19 | 8133 | 33% | SPZ | ―/― | 1971 | 2014 | 44 |
| Boreal Plains | |||||||||
| Overflowing | 53.15 | −101.11 | 3350 | 50% | SFZ | ―/― | 1970 | 2016 | 47 |
| Boreal Interior | |||||||||
| Slate | 67.25 | −150.18 | 189 | 12% | DPZ | −1.1/30 | 1997 | 2016 | 20 |
| European Taiga | |||||||||
| Stuorraluoppal | 69.78 | 26.99 | 1520 | 15% | DPZ | −0.2/10 | 1970 | 2016 | 47 |
| Vaehaeskanjoki | 66.55 | 27.69 | 16 | 13% | SFZ | ―/― | 1970 | 2015 | 46 |
| Landbru | 64.89 | 13.92 | 61 | 16% | DPZ | ―/― | 1970 | 2014 | 45 |
| Grotsjoen | 61.81 | 12.44 | 565 | 41% | SPZ | ―/― | 1970 | 2016 | 47 |
| Etna | 60.93 | 9.63 | 557 | 10% | SPZ | −0.2/10 | 1970 | 2013 | 44 |
| Western Siberian Plain | |||||||||
| Sovetskaya | 66.81 | 83.71 | 1430 | 30% | DPZ | −0.7/10 | 1970 | 2016 | 47 |
| Puloy | 66.03 | 68.73 | 15100 | 36% | DPZ | −0.2/10 | 1970 | 2016 | 47 |
| Pur | 65.97 | 78.35 | 80400 | 50% | DPZ | −0.7/10 | 1970 | 2015 | 46 |
| Turukhan | 65.97 | 84.34 | 10100 | 40% | DPZ | −0.7/10 | 1970 | 2016 | 47 |
| Kazym | 63.68 | 69.65 | 7540 | 48% | SPZ | −0.2/10 | 1970 | 1998 | 29 |
| Shoma Ya | 63.66 | 62.14 | 468 | 33% | SPZ | −0.2/10 | 1972 | 2016 | 45 |
| Amnya | 63.72 | 67.23 | 7100 | 18% | SPZ | −0.2/10 | 1970 | 2016 | 47 |
| Severnya Sos'va | 62.43 | 60.87 | 9850 | 30% | DPZ | −0.7/10 | 1970 | 2016 | 47 |
| Nazyma | 61.45 | 68.92 | 11500 | 35% | SPZ | −0.2/10 | 1970 | 2016 | 47 |
| Malyy Yugan | 60.49 | 74.46 | 8130 | 41% | SPZ | −0.2/10 | 1970 | 2016 | 47 |
| Bol'shol Yugan | 60.27 | 73.82 | 18300 | 43% | SPZ | −0.2/10 | 1970 | 1995 | 26 |
| Vandras | 60.06 | 71.47 | 1740 | 50% | SFZ | ―/― | 1984 | 2016 | 33 |
| Konda | 59.82 | 68.8 | 65400 | 41% | SFZ | ―/― | 1970 | 2015 | 46 |
| Paydungina | 59.36 | 82.82 | 6500 | 33% | SPZ | ―/― | 1970 | 2016 | 47 |
For the thirty-one basins with 12-month records, mean annual values of precipitation and runoff ranged from 322 to 936 mm and from 131 to 536 mm, respectively (table 2). There were non-significant decreases of the mean (sd, n) runoff ratio with increasing permafrost extent from 0.55 (0.27, 6) in the SFZ, to 0.52 (0.17, 11) in the SPZ, and to 0.43 (0.20, 17) in the DPZ. Runoff ratios were greatest in the Boreal Interior, 1.05 (0.32, 1) and indicated either underestimated precipitation, basin area, or both. This was followed by the European Taiga, 0.68 (0.09, 5), Western Siberian Plain, 0.51 (0.09, 14), Boreal Shield 0.48 (0.12, 1), Hudson Plains, 0.44 (0.12, 4), Taiga Plains, 0.31 (0.12, 8), and finally the Boreal Plains, 0.09 (0.08, 1). A marginally significant correlation occurred between mean annual basin runoff ratio (table 2) and latitude (r = 0.33, p = 0.051) while no significant correlation occurred between runoff ratio and either peatland percentage (r = −0.29, p = 0.10) or basin area (r = −0.08, p = 0.66).
Table 2. Mean and standard deviations (sd) of annual runoff, precipitation and runoff ratio for each basin sorted by ecoregion and descending latitude.
| Annual runoff | Annual precipitation | Annual runoff ratio | |
|---|---|---|---|
| Mean (sd) | Mean (sd) | Mean (sd) | |
| Basin name | (mm) | (mm) | ― |
| Taiga Plains | |||
| Martin | 131 (70) | 374 (65) | 0.34 (0.14) |
| Jean Marie | 127 (70) | 367 (70) | 0.34 (0.16) |
| Scotty | 136 (62) | 438 (58) | 0.31 (0.12) |
| Birch | 163 (81) | 419 (70) | 0.38 (0.15) |
| Trout | 138 (58) | 375 (62) | 0.36 (0.13) |
| Blackstone | 176 (76) | 452 (70) | 0.38 (0.13) |
| Hay | 62 (28) | 429 (68) | 0.14 (0.05) |
| Keg | 95 (47) | 453 (89) | 0.20 (0.08) |
| Hudson Plains | |||
| Weir | 218 (63) | 446 (92) | 0.49 (0.11) |
| Angling | 217 (75) | 440 (96) | 0.49 (0.11) |
| Shamattawa | 272 (80) | 616 (84) | 0.44 (0.13) |
| Pontax | 376 (50) | 812 (127) | 0.48 (0.12) |
| Boreal Shield | |||
| Taylor | 172 (65) | 479 (67) | 0.36 (0.12) |
| Boreal Plains | |||
| Overflowing | 85 (47) | 527 (80) | 0.16 (0.07) |
| Boreal Interior | |||
| Slate | 332 (114) | 322 (80) | 1.05 (0.32) |
| European Taiga | |||
| Stuorraluoppal | 363 (81) | 417 (70) | 0.87 (0.12) |
| Vaehaeskanjoki | 417 (85) | 594 (111) | 0.71 (0.12) |
| Landbru | 536 (116) | 936 (163) | 0.57 (0.05) |
| Grotsjoen | 477 (102) | 798 (116) | 0.6 (0.09) |
| Etna | 531 (135) | 772 (168) | 0.69 (0.08) |
| Western Siberian Plain | |||
| Sovetskaya | 345 (57) | 456 (59) | 0.76 (0.1) |
| Puloy | 277 (47) | 481 (76) | 0.58 (0.09) |
| Pur | 317 (67) | 520 (65) | 0.61 (0.1) |
| Turukhan | 348 (77) | 475 (64) | 0.74 (0.15) |
| Kazym | 317 (69) | 531 (72) | 0.6 (0.11) |
| Shoma Ya | 208 (57) | 482 (88) | 0.43 (0.1) |
| Amnya | 274 (40) | 543 (74) | 0.51 (0.06) |
| Severnya Sos'va | 332 (77) | 595 (80) | 0.56 (0.09) |
| Nazyma | 250 (59) | 585 (84) | 0.43 (0.07) |
| Malyy Yugan | 220 (47) | 572 (90) | 0.39 (0.07) |
| Bol'shol Yugan | 211 (52) | 586 (102) | 0.36 (0.07) |
| Vandras | 215 (71) | 566 (94) | 0.38 (0.1) |
| Konda | 164 (48) | 507 (82) | 0.32 (0.09) |
| Paydungina | 261 (54) | 578 (88) | 0.45 (0.08) |
Decadal comparisons of hydrological response
For each ecoregion, relationships between MAAT and mean annual basin runoff, precipitation, and runoff ratio were explored over each decade between 1970 and 2016 (figure 2). This analysis was repeated using combined data for April and May because these months are associated with annual snowmelt, the period of greatest hydrological connectivity (Woo and Winter 1993). In each ecoregion, MAAT increased between the first (1970–1979) and last (2010–2016) decadal period (figure 2(a)). The greatest MAAT increase occurred within the Western Siberian Plain (1.9 °C), followed by the Taiga Plains (1.3 °C), Boreal Plains (1.1 °C), the Boreal Shield (0.9 °C), Hudson Plains (0.8 °C), and finally the European Taiga (0.6 °C). MAAT increased by 2.0 °C in the Boreal Interior between the first (1990–1999) and last (2010–2016) decadal period for that ecoregion. Among ecoregions, annual and April–May precipitation was inversely related to MAAT over successive decades (figures 2(a), (e)). A similar relationship did not occur within ecoregions. Annual runoff and precipitation were positively correlated for each decade in the Hudson Plains, Boreal Plains, Boreal Interior and Western Siberian Plain. This was also observed in the European Taiga until 2010–2016, when annual runoff decreased despite precipitation increases. By contrast, mean annual precipitation did not change substantially in the Taiga Plains, despite a 63 mm increase in mean annual runoff between the decades of 1990–1999 and 2000–2009. This resulted in an increase of 15% in the mean annual runoff ratio for the basins of the Taiga Plains. Runoff ratio did not increase substantially over successive decades in all ecoregions. It is noteworthy that in the Boreal Interior, annual precipitation between 2000–2009 and 2010–2016 decreased by 56 mm (17%) in, and that this resulted in a decrease of the annual runoff by only 8 mm (2%) and the annual runoff ratio decreased by 25%.

Figure 2. Decadal plots mean annual air temperature (MAAT) and mean annual (a) runoff, (b) precipitation, and (c) runoff ratio and mean April–May combined (d) runoff, (e) precipitation, and (f) runoff ratio for each ecoregion.
Download figure:
Standard image High-resolution imageDecadal means for April–May approximate the annual patterns described above. April–May runoff decreased in the Hudson Plains, Boreal Shield, and Boreal Interior. In the European Taiga, runoff and runoff ratio were greatest during 1980–1989, 174 mm and 2.25, respectively. Overall, April–May runoff varied between 145 and 160 mm, while runoff ratio steadily decreased to 1.60 by 2010–2016 in that ecoregion. Runoff ratios in this period can exceed 1.00 since the precipitation of this period is augmented by the melt of a snowpack that developed from the precipitation of the entire winter season. April–May runoff and runoff ratio increased over successive decades throughout the Taiga Plains and Western Siberian Plain where the greatest increases occurred since 1990–1999 in the Taiga Plains (25 mm and 0.44), and since 2000–2009 in the Western Siberian Plain (9 mm and 0.28). In the Boreal Plains, April–May runoff and runoff ratio also increased in recent decades but are not as high as they were for 1970–1979.
Among the ecoregions in table 1 with more than one drainage basin, the Taiga Plains, Hudson Plains, and Western Siberian Plain, demonstrated decadal changes to runoff during April, May, or June of sufficient magnitude to change the annual runoff in these ecoregions (figure 3). Figure 3 also shows that in the European Taiga, the frequency of extreme monthly runoff increased between December and March over the latter part of the decadal sequence, and that June runoff decreased over the successive decades in the Hudson Plains and Western Siberian Plain. By contrast, June runoff varied only negligibly in the Taiga Plains. While in the European Taiga, June runoff fell between 1990–1999 and 2000–2009 following a three-decade increase, then moderately increased between 2010–2016.

Figure 3. Decadal box and whisker plots showing monthly runoff distributions for each multi-basin ecoregion. The boxes bound the 25th and 75th percentile, i.e., the interquartile range (IQR) and are hinged at the median. Whiskers extend from the IQR by 1.5*IQR. Outlying points are those monthly runoff values > or <1.5*IQR. To aid in figure interpretation, the y-axis for the Taiga Plains is less (0–200 mm) than those of the other ecoregions (0–400 mm). The Boreal Interior, Plains, and Shield ecoregions were excluded from this analysis since they each have only one representative basin.
Download figure:
Standard image High-resolution imageAnnual trends
Among the 34 basins analysed, annual runoff significantly increased in eight basins, six in the Taiga Plains (1 in SFZ and 5 in DPZ), and two in European Taiga (1 in SPZ and 1 in SFZ) (figure 4). Increases ranged from 1.7 mm year−1 (80 mm or 37% total) in Trout (Taiga Plains, DPZ) to 3.5 mm year−1 (88 mm or 50% total) in Blackstone (Taiga Plains, DPZ) (table 3). Latitude (r = 0.02, p = 0.97) and peatland percentage (r = −0.16, p = 0.68) did not significantly correlate with increased runoff, but basin area did (r = −0.69, p = 0.04). Kazym, in the Western Siberian Plain SPZ, where runoff records terminated in 1998, was the only basin where annual runoff significantly decreased, falling by 3.0 mm year−1 (87 mm or 27% total).
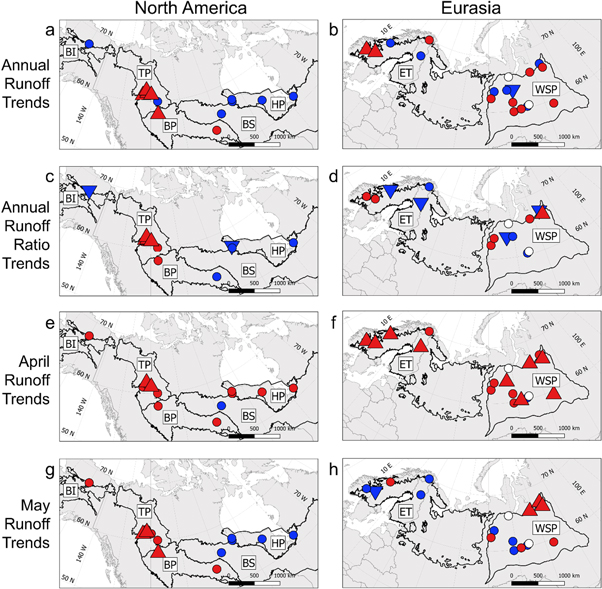
Figure 4. Annual, April, and May trends for all basins in the Taiga Plains (TP), Hudson Plains (HP), Boreal Shield (BS), Boreal Plains (BP), Boreal Interior (BI), European Taiga (ET), and Western Siberian Plain (WSP) between 1970 and 2016. Symbols indicate  positive and significant trends,
  positive trends,
  negative and significant trends,
  negative trends,
  and Puloy and Malyy Yugan basins where gap-filling was ≥10%.
Download figure:
Standard image High-resolution imageTable 3. Annual, April and May Theil-Sens slopes, where bolded text indicates trend significance at (p ≤ 0.05), *(p ≤ 0.01), ** (p ≤ 0.001), and ***(p ≤ 0.0001). Theil-Sen slope estimates ≤0.000005 (mm year−1) or ≤0.0005 (% year−1) are reported as 0.0. +Indicates basins where gap-filling could not meet the ≤10% threshold.
| Annual | April | May | |||
|---|---|---|---|---|---|
| Runoff | Runoff ratio | Precipitation | Runoff | Runoff | |
| Basin name | (mm Δ year−1) | (% Δ year−1) | (mm Δ year−1) | (mm Δ month−1) | (mm Δ month−1) |
| Taiga Plains | |||||
| Martin | 2.4* | 0.6** | 0.8 | 0.1 | 0.7 |
| Jean Marie | 2.7*** | 0.7*** | 0.5 | 0.04 | 0.7 |
| Scotty | 2.9 | 0.6 | −0.4 | −0.1 | 2.7 |
| Birch | 2.4*** | 0.6*** | 0.4 | 0.2 | 1.2 |
| Trout | 1.7*** | 0.5*** | −0.1 | 0.1 | 0.3 |
| Blackstone | 3.5 | 0.6 | 3.0 | 0.2 | 3.1 |
| Hay | −0.1 | 0.3 | −1.8 | 0.03 | 0.02 |
| Keg | 2.7*** | 0.4 | 0.5 | 0.4 | 0.3 |
| Hudson Plains | |||||
| Weir | −2.0 | −0.4 | −0.1 | 0.02 | −0.6 |
| Angling | −1.1 | −0.2 | 0.7 | 0.1 | −0.7 |
| Shamattawa | −0.6 | 0.0 | −1.9 | 0.02 | −0.7 |
| Pontax | −0.5 | −0.1 | −0.1 | 0.3 | −0.6 |
| Boreal Shield | |||||
| Taylor | −0.8 | 0.0 | −1.1** | −0.004 | −0.7 |
| Boreal Plains | |||||
| Overflowing | 0.8 | −0.2 | −0.6 | 0.1 | 0.2 |
| Boreal Interior | |||||
| Slate | −6.5 | −1.5* | −0.1 | 0.01 | 0.4 |
| European Taiga | |||||
| Stuorraluoppal | 0.8 | −0.2 | 2.1* | 0.1 | −0.2 |
| Vaehaeskanjoki | −0.2 | −0.5* | 2.7* | 0.8** | −0.7 |
| Landbru | −1.0 | −0.2*** | 1.5 | 0.2 | 0.5 |
| Grotsjoen | 3.3* | 0.2 | 2.1* | 0.7*** | −2.4* |
| Etna | 3.4* | 0.2 | 4.0* | 0.7*** | −0.4 |
| Western Siberian Plain | |||||
| Sovetskaya | −1.4 | −0.4* | 0.7 | 0.03 | 0.3* |
| Puloy+ | ― | ― | ― | ― | ― |
| Pur | 1.1 | 0.1 | 1.2 | 0.1*** | 0.7*** |
| Turukhan | 1.5 | 0.3 | −1.1 | 0.02 | 1.0*** |
| Kazym | −3.0 | −0.5 | −1.3 | 0.0 | 0.0 |
| Shoma Ya | −0.7 | 0.1 | −0.9 | 0.04 | −0.3 |
| Amnya | −0.4 | −0.1** | 1.5 | 0.1 | 0.0 |
| Severnya Sos'va | 1.7 | 0.2 | −0.3 | 0.1 | 0.3 |
| Nazyma | −0.02 | 0.0 | 0.7 | 0.1 | −0.2 |
| Malyy Yugan+ | ― | ― | ― | ― | ― |
| Bol'shol Yugan | −2.5 | −0.1 | −5.7 | −0.1 | −0.7 |
| Vandras | 0.8 | 0.0 | 5.1 | 0.3 | 0.5 |
| Konda | −0.1 | 0.0 | 1.2 | 0.03 | −0.1 |
| Paydungina | 1.0 | 0.0 | 2.1 | 0.1* | 0.3 |
Annual runoff ratio significantly increased in five basins, four in the Taiga Plains (all in DPZ) and one in the DPZ of the Western Siberian Plain. Runoff ratio increased from 0.3% year−1 (14% total) in Turukhan (Western Siberian Plain, DPZ) to 0.7% year−1 (30% total) in Jean-Marie (Taiga Plains, DPZ). Increases did not significantly correlate with latitude (r = −0.17, p = 0.67), peatland percentage (r = 0.25, p = 0.52) or basin area (r = −0.30, p = 0.43). Runoff ratio significantly decreased in six basins, one in the Boreal Interior DPZ, one in the Hudson Plains DPZ, one each in the DPZ and SFZ of the European Taiga, and one each in the SPZ and DPZ of the Western Siberian Plain. Runoff ratio decreases ranged from 0.2% year−1 (9% total) in Landbru (European Taiga, DPZ) and 1.5% year−1 (30% total) in Slate (Boreal Interior, DPZ). Decreased runoff ratios did not significantly correlate with latitude (r = −0.13, p = 0.78). peatland percentage (r = 0.20, p = 0.67), or basin area (r = −0.35, p = 0.65).
Annual precipitation significantly increased only in four basins, all in the European Taiga, two in the SPZ (Grotsjoen and Etna), one in the DPZ (Stuorraluoppal) and one in the SFZ (Vaehaeskanjoki) (figure 5). Over the same period, annual runoff from the Grotsjoen and Etna basins increased, and the runoff ratio of the Vaehaeskanjoki decreased. Precipitation significantly decreased in the Shamattawa (Hudson Plains, DPZ), Taylor (Boreal Shield, SPZ) and Bol'shol Yugan (Western Siberian Plain, SPZ) basins. No significant changes to runoff or runoff ratio occurred in these basins in response to decreased precipitation.
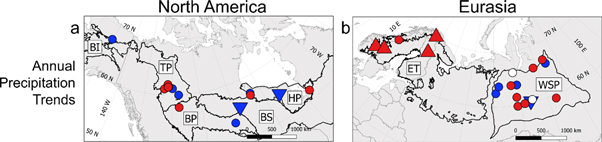
Figure 5. Annual precipitation trends for all basins in the Taiga Plains (TP), Hudson Plains (HP), Boreal Shield (BS), Boreal Plains (BP), Boreal Interior (BI), European Taiga (ET), and Western Siberian Plain (WSP) between 1970 and 2016. Symbols indicate  positive and significant trends,
  positive trends,
  negative and significant trends,
  negative trends, and
  Puloy and Malyy Yugan basins where gap-filling was ≥10%.
Download figure:
Standard image High-resolution imageMonthly trends
Among all 32 basins where trends could be analysed, the greatest number of positive and significant trends of runoff occurred during the winter period between November and March (figure 6), with 78% of basins demonstrating at least one month of increased runoff during this period (figure 7). Runoff during the snowmelt months of April and May significantly increased in 47% of basins (figure 4) and accounted for the greatest proportion of the annual runoff increases (figure 7). In the Grotsjoen basin, runoff increased in each month between December and April, totalling 3.9 mm months−1. Those increases were then substantially diminished by a 2.4 mm month−1 decrease in May (figure 7). Similarly, in Sovetskaya a runoff increase in May of 0.35 mm month−1 was then counteracted by a 1.6 mm months−1 decrease over June and July.
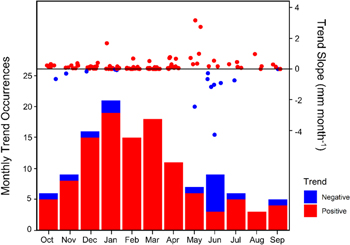
Figure 6. Significant (p ≤ 0.05) monthly trend occurrences and their corresponding Theil-Sens slope between 1970 and 2016. Slopes are plotted in relation to a zero-line reference and as a jitter plot to assist with interpretation.
Download figure:
Standard image High-resolution image
Figure 7. Heatmap of monthly runoff trends between 1970 and 2016 for all basins in the Taiga Plains (TP), Hudson Plains (HP), Boreal Shield (BS), Boreal Plains (BP), Boreal Interior (BI), European Taiga (ET), and Western Siberian Plain (WSP) except for Puloy and Malyy Yugan where gap-filling was ≥10%. Basins are sorted by descending latitude within each ecoregion. Colour indicates a positive (red) or negative (blue) slope direction, while opacity corresponds to the magnitude of the slope relative to zero. Labelled cells indicate indicates trend significance at (p ≤ 0.05), *(p ≤ 0.01), ** (p ≤ 0.001), and ***(p ≤ 0.0001) and the corresponding Theil-Sens slope. Slopes ≤0.005 mm Δ month−1 are reported as 0.
Download figure:
Standard image High-resolution imageMonthly runoff ratios, computed for the snow-free period of April to October, demonstrated several distinct differences among the ecoregions. Significant trends in the Taiga Plains were persistently positive (figure 8). In the European Taiga, two of the five basins showed modest April increases with all five basins decreasing over May and/or June. Runoff ratios decreased in August in the Slate basin (Boreal Interior), but increased in four of thirteen Western Siberian Plain basins over April and May, then decreased in June in two of those four. Monthly runoff ratios showed no pattern in the Hudson Plains, Boreal Plains, Boreal Shield or in the remaining nine Western Siberian Plain basins.
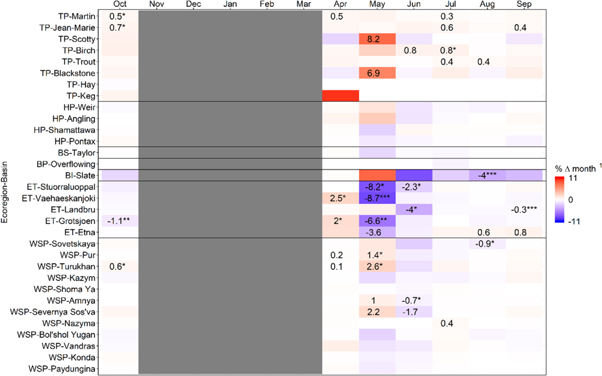
Figure 8. Heatmap of monthly runoff ratio trends between 1970 and 2016 for all basins in the Taiga Plains (TP), Hudson Plains (HP), Boreal Shield (BS), Boreal Plains (BP), Boreal Interior (BI), European Taiga (ET), and Western Siberian Plain (WSP) except for Puloy and Malyy Yugan where gap-filling was ≥10%. Basins are sorted by descending latitude within each ecoregion. Colour indicates a positive (red) or negative (blue) slope direction, while opacity corresponds to the magnitude of the slope relative to zero. Labelled cells indicate indicates trend significance at (p ≤ 0.05), *(p ≤ 0.01), ** (p ≤ 0.001), and ***(p ≤ 0.0001) and the corresponding Theil-Sens slope.
Download figure:
Standard image High-resolution imageExcept for basins in the European Taiga where monthly precipitation increased in either in March, May or August, few significant monthly precipitation trends occurred and where they were evident, they showed no persistent ecoregional or seasonal patterns (supplementary information). The greatest change in monthly discharge occurred in the Western Siberian Plain, where the greatest increase (1.6 mm month−1) occurred in the Vandras (SFZ) in June, and the greatest decrease (0.82 mm month−1) occurred in the Kazym (SPZ) in September.
Monthly composite hydrograph comparison
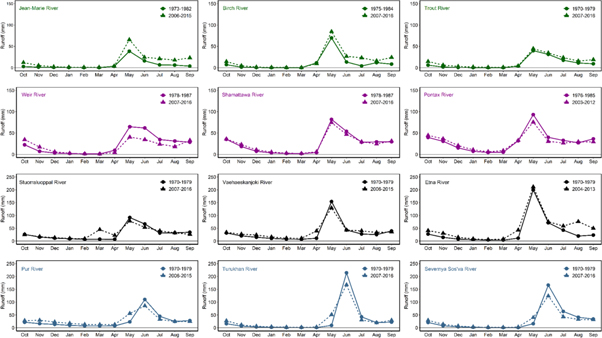
Three basins were selected from each ecoregion that contains more than one basin (table 1), and for each, a composite hydrograph representing the initial and final decadal periods for each basin is plotted in figure 9. In the Taiga Plains, average monthly runoff rose by 0.3 to 42 mm between the initial and final decades. In the Hudson Plains, average monthly runoff decreased from 0.02 to 27 mm between the first and last decades for the period between April and August but increased by 1 to 12 mm per month for the months of September to January, most notably for the Weir and Pontax. In the European Taiga, the initiation of the annual spring freshet appears to have shifted from May in the initial hydrographs to April in the final. Specifically, runoff increased by 16 to 32 mm in April, while May runoff decreased by 14 mm (Stuorraluoppal) and 25 mm (Vaehaeskanjoki). In the Etna basin, runoff increased by 12 mm in May, although runoff from the Etna basin increased in all months and is especially pronounced in August, indicating a possible departure from a snowmelt dominated hydrograph to one increasingly influenced by summer/fall precipitation. Such a shift away from snowmelt dominated hydrographs is also evident in the Taiga Plains. The shift from May to April observed in the European Taiga is also evident in the Western Siberian Plain, and as a result the hydrograph peaks were lower in the final (i.e. most recent) hydrographs, but the high flows resulting from annual freshet were extended over a longer period such that the decrease in June runoff was approximately equal in magnitude to the increase in May runoff. Although, unlike in the Taiga Plains and the European Taiga, summer and fall runoff did not increase between the initial and final hydrographs of the Western Siberian Plain. However, as for the hydrographs of the other three ecoregions, winter base flow in the hydrographs of the Western Siberian Plain increased between the first and last decades.
Figure 9. Average monthly total runoff for three basins in the Taiga Plains (green), Hudson Plains (purple), European Taiga (black), and Western Siberian Plain (blue). Plotted are the first decade (circles and solid line) and last decade (triangles and dashed line) of runoff for each basin. Basins are sorted by descending latitude from left to right.
Download figure:
Standard image High-resolution image
Discussion
This study found that the Taiga Plains is unique in the circumpolar region as it is the only peatland-dominated ecoregion with widespread, significant increases of annual basin runoff and runoff ratios in the absence of increasing precipitation. Outside this region, only the Turukhan basin of the Western Siberian Plain DPZ was found to have these same characteristics. Therefore, other than for the Taiga Plains and the Turukhan, the interpretation of annual runoff and runoff ratio trends is challenged by variations in precipitation from decade to decade. However in these cases, insights were gained by comparing the timing of the changes to the precipitation and runoff regimes. For example, in the European Taiga, runoff increased significantly in the November to March period in the Vaehaeskanjoki, Grotsjoen, and Etna basins. These runoff increases were not driven by increased precipitation, since precipitation increases were largely during the May to August period (supplementary information). In the Grotsjoen and Etna, any potential permafrost-thaw-driven increases to runoff would have been obscured by the annual precipitation increases.
The circum-polar region has warmed in a non-uniform manner and its peatland-dominated ecoregions have warmed at different rates and over different temperature ranges. Over the period 1970 to 2016, the rate that MAAT increased was highest in the eastern region of the Western Siberian Plain (0.07 °C year−1), followed by the Taiga Plains (0.05 °C year−1), Hudson Plains (0.04 °C year−1), the European Taiga (0.04 °C year−1) and finally the remaining regions of the Western Siberian Plain (0.04 °C year−1) (ncdc.noaa.gov/cag/) (supplementary information). However, the temperature increase between the first and last decade of the analysis was most consequential in the Mid-Boreal Taiga Plains (−1.7 °C to −0.5 °C) since the MAAT rose very close to the melting point. By contrast, MAAT in the final decade in the Hudson Plains (−3.5 °C to −2.7 °C) and Western Siberian Plain (−3.8 °C to −2 °C) did not rise above −2 °C. In the European Taiga, the MAAT was already positive in the initial decade (0.7 °C) and rose to 1.3 °C. Considering the range of the temperature change in each ecoregion in relation to the melting point temperature, the Hudson Plains has the lowest MAAT and therefore is the most delayed with respect to the onset of permafrost thaw. Based on MAAT, permafrost thaw in the Western Siberian Plain would be more advanced than in the Hudson Plain, but delayed behind the Taiga Plains. The relatively high MAAT of the European Taiga suggests that it may have already transitioned to a largely permafrost-free landcover and associated runoff regime.
In the Landbru (DPZ) and Vaehaeskanjoki (SFZ), the decreasing annual runoff ratios without a decrease to annual precipitation indicates changes have occurred that would reduce the partitioning of precipitation to runoff. Such changes could include increased boreal forest and peatland evapotranspiration (Helbig et al 2020) and/or increased canopy interception (Allen and Chapman 2001, Schelker et al 2013) resulting from afforestation throughout Fennoscandia (Fuchs et al 2013). Although precipitation amounts did not change, changes to the distribution of precipitation (e.g. more or fewer multi-day events) have been found to affect runoff production, especially in basins exhibiting a threshold runoff response (e.g. Dumanski et al 2015).
In the Western Siberian Plain, runoff increases were greatest during the snowmelt months of April and May in the Turukhan and Pur basins, while summer (June and July), runoff decreased between the first and last decade of analysis. This earlier occurrence of snowmelt runoff has been reported by others and attributed to a more rapid end-of winter snowmelt event (Makarieva et al 2019), or increased frequency of rain-on-snow events (e.g., Ye et al 2008, Pall et al 2019). An earlier onset of snowmelt runoff was also noted for European Taiga. For both ecoregions, the earlier onset of runoff reduced the annual peak of the average total monthly runoff (figure 9), but the increased duration of this annual high flow period resulted in there being little change in the total freshet runoff between the first and last decade. This pattern in the Western Siberian Plain and European Taiga stands in contrast to that in the Taiga Plains, where the timing of the hydrograph peak did not change, but the peak height increased. Another noteworthy contrast is that unlike in the European Taiga and Taiga Plains, runoff during summer in the Western Siberian Plain remained low and so does not appear to be increasingly influenced by summer precipitation, whether due to increasing precipitation (European Taiga) or increasing landscape connectivity (Taiga Plains). Among the basin studies, those of the Western Siberian Plain are biophysically most similar to those of the Taiga Plains. For example, peat plateau wetland complexes described above for the Taiga Plains occur widely throughout the Pur and Turukhan basins. Whether the extent of permafrost in these complexes is similar to that described above for the Mid-Boreal or elsewhere in the Taiga Plains, is unknown. However, the increased summer and fall runoff observed throughout the Taiga Plains and believed to be an important indicator of increased landscape connectivity induced by permafrost thaw, is not observed in the basins of the Western Siberian Plain.
All ecoregions in the present study demonstrated increased flows during the winter months, and this has also been reported widely in the literature (e.g., Walvoord and Striegl 2007, St. Jacques and Sauchyn 2009, Muskett and Romanovsky 2011). For the Taiga Plains, St. Jacques and Sauchyn (2009) suggested that since precipitation has not increased, permafrost thaw induced reactivation of groundwater was primarily resposible for increased winter baseflow. Increased discharge from groundwater aquifers to river channels seems unlikely given the thick clay-rich glacial till underlying many of the basins of the Taiga Plains. However, subsequent studies demonstrated increasing contributions of suprapermafrost groundwater supplied to river channels through the active layer (Connon et al 2014) and underlying taliks (Muskett and Romanovsky 2011, Devoie et al 2019). These two flowpath types are increasingly prevalent due to permafrost thaw (Connon et al 2018), and both can hydrologically connect river channels to basin areas that were (prior to permafrost thaw) hydrologically-isolated.
Increased annual runoff between 1936 and 1999 from northern Eurasia's largest river basins (Yenisei, Ob, Lena, Kolyma, Pechora, and Severnaya Dvina) that include both permafrost and permafrost-free terrains, was reported by McClelland et al (2004). Smith et al (2007) reported increasing baseflow contributions in 111 Russian basins and suggested that the increases were driven by the thaw of seasonal ice and permafrost. The study by Tananaev et al (2016) on the Lena River basin did not attribute increased groundwater flow to permafrost thaw, suggesting instead that unique basin characteristics may conduct or resist groundwater flow, irrespective of permafrost presence.
Among the 34 basins in this study, increasing runoff or runoff ratio trends could not be detected in 11 of them, eight in the Western Siberian Plain (Sovetskaya, Puloy, Kazym, Shoma Ya, Amnya, Severnya Sos'va, Nazyma, Malyy Yugan) and three in the Hudson Plains (Angling, Weir, Shamattawa). Apart from the Puloy and Malyy Yugan basins where gap filling prevented trend analyses, we suggest that in these basins, changes to runoff response as a result of permafrost thaw, remains a potential. A delay in the onset of permafrost thaw, and/or a slower rate of permafrost thaw are primary factors that explain the absence of significant trends in runoff and runoff ratio. For instance, Chasmer and Hopkinson (2017) reported that compared with the permafrost thaw in the Taiga Plains between 1970 and 2015, such thaw in the Hudson Plains reported by Pironkova (2017) for the 1954 to 2011 period and by Ou et al (2016b) for the periods between 1960 to 1969 and 2000 to 2009, started later and proceeded at a lower rate. While no similar studies were found in the Western Siberian Plain, permafrost temperatures in that ecoregion are generally lower and are warming more slowly than in the Taiga Plains (Romanovsky et al 2010a, 2010b, Smith et al 2010).
Conclusion
Most research at a circumpolar scale has focused on analysing trends of large basins (>100,000 km2) which can mask trends occurring in specific landcover types of interest, such as peatland-dominated basins where permafrost may be thawing, and as a result, the land cover form and hydrological function could be transitioning. Owing to the paucity of field-based studies examining the impacts of permafrost thaw on runoff pathways and processes for many of the widely occurring peatland types of the DPZ, the drivers of such changes are difficult to identify. Of the 32 peatland-dominated basins whose records were sufficient to compute trends, five showed increases to the annual runoff ratios, six showed decreases, and 21 had no statistically significant trend. The ecoregions that demonstrated significant increases were the Taiga Plains and the Western Siberian Plain, where the rates of climate warming were highest. The trends of increasing runoff and runoff ratio in the absence of increasing precipitation reported in the literature for the Taiga Plains, is not widespread in the circumpolar region at present. These results indicate the need for more field-based research on the hydrological response of different permafrost peatland landforms in colder DPZ environments. Such studies should be coupled with analyses of historical aerial/satellite imagery of landcovers that are in the process of transitioning due to permafrost thaw, or have already transitioned. Combined field and remote sensing studies of this type would improve the current understanding of the rates and patterns of permafrost thaw-induce peatland change and their hydrological consequences. Finally, there is also a need for detailed modeling experiments to better understand the response of peatland-dominated basins on climate change in different land cover conditions.
Acknowledgments
The authors wish to thank the offices of the Liidlii Kue First Nation, the Jean-Marie River First Nation, and the Dehcho First Nations for their support of both the Scotty Creek Research Station and this project. We would also like to acknowledge the indigenous peoples who's lands and waterways were analyzed in this study, and are experiencing described impacts of climate change. Those include: Gwich'in Alaskan Natives, the Sapotaweyak Cree Nation, the Nisichawayasihk Cree Nation, the Fox Lake Cree Nation, the Weenusk First Nation, the Waskaganish First Nation, the Sámi people of Fennoscandia, and indigenous people of Khanty-Mansy and Nency living in the Western Siberian Plains of Russia. We also gratefully acknowledge ArcticNet for their support of the Dehcho Collaborative on Permafrost, the Natural Sciences Engineering Research Council (NSERC), the Northern Studies Training Program (NSTP), the Cold Regions Research Centre, the Russian Foundation for Basic Research (RFBR), and St. Petersburg University. We also wish to thank Olivia Carpino, Élise Devoie, Alex MacLean, Caren Ackley, Kristine Haynes, and Donald Burns for their assistance throughout this study.
Data availability statement
The data that support the findings of this study are openly available at the following URL/DOI:https://github.com/p3atmack/circumpolar-peatland-runoff-trends.