
Abstract
The hot deformation tests of in situ ZrB2 and Al2O3 nanoparticles reinforced AA6016 matrix composite were studied at deformation temperature of 300 °C–450 °C and strain rate of 0.001–1 s−1. In this paper, the ZrB2 and Al2O3 nanoparticles were successfully prepared by direct melt reaction method firstly. Based on experimental results, the flow stress increased rapidly with the increasing true strain and decreased with the increasing temperature. Constitutive equation of the composite can be established based on the Arrhenius constitutive model. The processing map based on dynamic material model showed two stable processable domains: Domain A(300–360 °C/0.08–0.01 s−1), which was controlled by dynamic recovery and domain B(410–430 °C/0.37–1 s−1), which was typical dynamic recrystallization structure. The microstructural changes of the samples after deformed were observed through optical microscope (OM), scanning electron microscope (SEM) and transmission electron microscope (TEM). It was concluded that these two kinds of reinforced particles can greatly promote recrystallization nucleation at high temperatures. Thus, domain B is optimum hot processing window.
Export citation and abstract BibTeX RIS

Original content from this work may be used under the terms of the Creative Commons Attribution 4.0 licence. Any further distribution of this work must maintain attribution to the author(s) and the title of the work, journal citation and DOI.
1. Introduction
Recent years, reinforced particles have been used to strengthen the aluminum alloy, which was called particle reinforced aluminum matrix composite (PRAMC [1–4]). PRAMC is widely used in many fields such as automotive and aerospace for its various advantages, such as high specific strength, formability, weldability, low thermal expansion coefficient as well as wear-resisting property [5, 6]. According to the related research, different types, characteristics, sizes, distribution of reinforced particles and methods of production have an important effect on the structure and performance of the PRAMC [6]. Compared to external method, reinforced nanoparticles can be easily prepared by in situ synthesis method. Meanwhile, the fine particles and good interface bonding strength between nanoparticles and matrix lead to better mechanical properties [7]. With regard to the reinforced particles, there are many types of reinforced nanoparticles being applied, such as TiB2 [8], Al2O3 [9], ZrB2 [10].
Hot deformation process is widely used in formability and mechanical property improvement of the metals and alloys. The proper processing conditions can greatly improve the workability of the materials. However, the addition of the reinforced particles will complicate the hot workability, such as hot extrusion, hot forging, and hot rolling [11, 12]. The main reason is that the effect of the particles on the strain hardening and dynamic softening may change the dislocation density and the microstructure transformation. Thus, the study about hot deformation behavior of the PRAMC plays an important role in secondary processing parameters. Zhao et al [13] found that the optimal working area was 430 °C–460 °C/0.13–1.1 s−1 from the processing map of ZrB2/AA6111 composite. It could be concluded that the hot deformation was more dangerous at high strain rate. In addition, the researches on the hot deformation behavior mainly focused on the softening mechanisms of dynamic recovery and dynamic recrystallization. F. Khodabakhshi et al [14] found out the main mechanism of aluminum-matrix hybrid nanocomposite at high temperature deformation was DRX. Chen et al [15] prepared the micro-SiC and nano-TiB2 reinforced aluminum matrix composite and found that the major softening mechanism was DRV. Meanwhile, they claimed that the reinforced particles provided power for partial DRX. However, micro-SiC will be broken during deformation, which led to a bad effect on bonding strength of interface. So, the addition of two kinds of reinforced nanoparticles, which are used to form reinforced phase at the same time, is also an ideal method to obtain higher strength and formability [16]. The ZrB2 and Al2O3 nano particles chosen in this paper own similar and low coefficient of thermal expansion. Moreover, the good stability, high elasticity modulus and high temperature strength are also reasonable factors for the formability properties.
In this study, the in situ 3 vol% (ZrB2 + Al2O3)/AA6016 composite was prepared by direct melt reaction of Al–K2ZrF6–Na2B4O7 system. Then, the samples were compressed on the thermal simulation testing machine to establish flow stress-strain curves. Afterwards, constitutive equation was obtained through Arrhenius equation according to stress of the elected strain. Moreover, the processing map, based on the rules of DMM (Dynamic Material Model) [17], was built on the value of the flow curves to describe the relationships between constitutive behavior, microstructure evolution, rheological instability and hot workability of composite. Afterwards, an optimized processing parameter and the softening mechanisms of the in situ (ZrB2 + Al2O3)/AA6016 nanocomposite can be analyzed by the established processing map and microstructure changes.
2. Experimental procedure
2.1. Synthesis of materials
The in situ (ZrB2 + Al2O3) nanoparticles reinforced composite used the AA6016 as the matrix material. The industrial salt K2ZrF6 and Na2B4O7 · 10H2O powders were used as the reactant and respectively dried at 473 K for 2 h to eliminate the crystal water. Na2B4O7 provided more B element to decrease the total mass of reactants. Furthermore, more B element prevented the generation of Al3Zr particles. Then the two powders were grinded and mixed uniformly in mortar according to an appropriate B:Zr ratio of 1:1.56. Then AA6016 alloy ingot was melt at 1123 K in a graphite crucible. Then, the mixed salt was pressed into the molten aluminum by a graphite bell to for complete reaction between reactant and matrix. At the same time, magnetic field system (10 Hz, 200 A) was used to expand reaction area and promote particle dispersion. After 15 min of reaction, the floating dross should be removed and the melt was degassed by C2Cl6. Subsequently, the final melt was dropped into the wedge metal mold at 993 K. The essential reaction equation can be summarized as follows:

Cylindrical specimens with the diameter of 10 mm and height of 15 mm from composite cast ingot were tested by thermal simulation testing and the sample compression axis was vertical to the sprue runner. Before the hot compression testing, the samples were subject to homogenization treatment at 833 K for 20 h, which can prevent segregation to obtain the uniform composition and structure. Subsequently, the surface of the samples was ground by sand paper to reduce the friction. Finally, all the samples were tested on Gleeble-3500 thermal simulation testing machine. Deformation strain rates of the samples were 0.001 s−1, 0.01 s−1, 0.1 s−1, 1 s−1 and the deformation temperatures were 300 °C, 350 °C, 400 °C, 450 °C. 5 mm thick graphite sheet was attached to the both end of the specimen to reduce the friction so that the specimen would not be subjected to shear stress. Before the deformation, the samples were heated up to experimental temperature at a speed of 5 °C s−1 and maintained at the temperature for 1 min All the samples, which had been pressed up to a true strain of 0.91, were quenched in the water at the first time after deformation to reserve structure. Finally, the specimens after deformed were sectioned into two parts along the direction of compression. The compositions of the in situ (ZrB2 + Al2O3)/AA6016 composite were determined by the direct-reading spectrometer (DRS, SPECTRO MAXx mm06), as shown in table 1. The existence of particles was determined by x-ray diffraction (XRD, DMAX2500PC) with Cu Kα radiation while their microstructures were observed by optical microscope (OM, Observer.Z1m), scanning electron microscope (SEM, JEOL-JSM-7001F) after polishing and corrosion. The dislocations were analyzed by transmission electron microscope (TEM, JEM-2100).
Table 1. Chemical compositions of the in situ (ZrB2 + Al2O3)/AA6016 composite (wt%).
| Elements | Si | Mg | Cu | Mn | Fe | Zn | Ti | Zr | B |
|---|---|---|---|---|---|---|---|---|---|
| Standard range | 1.0–1.5 | 0.25–0.6 | ≤0.2 | ≤0.2 | ≤0.5 | ≤0.2 | ≤0.15 | — | — |
| Composite | 1.31 | 0.55 | 0.19 | 0.18 | 0.48 | 0.16 | 0.001 | 5.3 | 1.3 |
3. Results and discussion
3.1. Initial microstructure
Figure 1 is XRD image and the x-ray mapping of one area with agglomerated particles. The clear diffraction peaks could be seen in the figure 1(a), which confirmed the presence of ZrB2 and Al2O3 particles without other residual Al3Zr particles in composite. According to figures 1(b)–(d), it could be seen that the cluster consisted of the elements of Zr and O and the number of Zr was more than O. Meanwhile, the two particles were in the intermingled state. Therefore, it can be concluded that the ZrB2 and Al2O3 had been synthesized successfully from the Al-K2ZrF6-Na2B4O7 system.
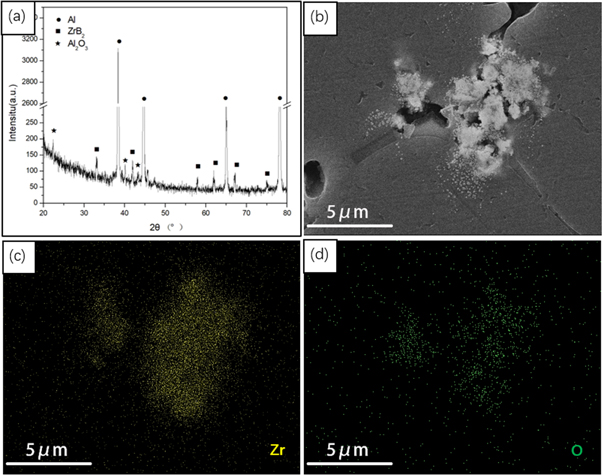
Figure 1. XRD and x-ray mapping of the in situ (ZrB2 + Al2O3)/AA6016 composite.
Download figure:
Standard image High-resolution imageFigure 2 is the image of the microstructure characteristic of the in situ (ZrB2 + Al2O3)/AA6016 composite. The OM image (figure 2(a)) exhibited the grain size and the particles distribution. Large number of particles were located on the grain boundary while the rest were dispersed inside the α-Al grains. Obviously, the grain size (50–60 μm) in the area where distributed aggregated particles was smaller than that in the area with less or none particles. The reason is that particles hinder the growth of the grains by pinning grain boundaries. Meanwhile, the reinforced particles can be used as heterogeneous nucleation points to improve the nucleation rate. These also contribute to the formation of fine equiaxed crystals. Figure 2(b) is the SEM image with the EDS picture. It was obvious that the interface between particles and matrix was clean and some particles were wrapped by the Al matrix. Moreover, the peaks of Zr, B, O elements in the EDS image preliminarily confirmed the generation of hexagonal ZrB2 and circular Al2O3 nanoparticles. As the figure 2(c) showed, the particle dispersion was uniform. As the figure 2(d) shown, the particle size range was mainly between 30 and 100 nm and most of them were 50–60 nm, which was approximately normal distribution.
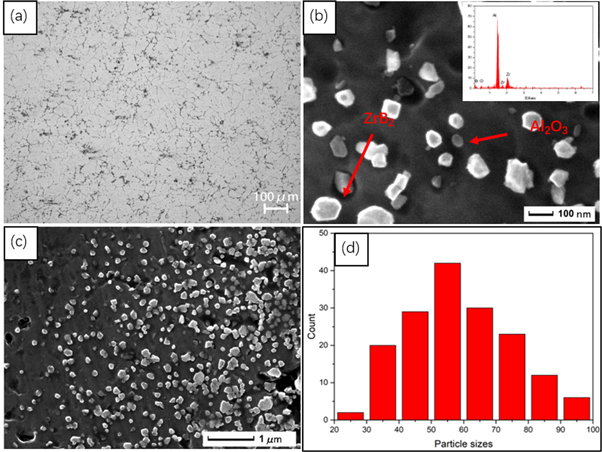
Figure 2. Microstructure characteristic of the in situ (ZrB2 + Al2O3)/AA6016 composite: (a) OM image; (b) high magnifications SEM image; (c) low magnifications SEM image; (d) particle size distribution map.
Download figure:
Standard image High-resolution image3.2. True stress-strain curves after deformed
Figure 3 shows the true stress-strain curves at different deformation parameters of the in situ (ZrB2 + Al2O3)/AA6016 composite obtained from isothermal compression deformation. It can be concluded from the curves of same strain rate that flow stress reduced as the deformation temperature increased. In addition, the flow stress rose while the strain rate increased. The faster dislocation generation rate caused by higher strain rate counteracts the effect of dynamic softening. Therefore, the composite proved to be positive stress sensitive material. Generally, the true stress-strain curve could be divided into two parts. During the initial deformation, the true stress grew rapidly in the short strain range because of the strain hardening. In this period, the dislocations increased with a high speed, which also made them intertwined with each other. After that, the curve reached dynamic equilibrium between strain hardening and dynamic softening mechanisms such as dynamic recovery (DRV) and dynamic recrystallization (DRX).

Figure 3. True stress-True strain curves of the in situ (ZrB2 + Al2O3)/AA6016 composite: (a) 300 °C; (b) 350 °C; (c) 400 °C; (d) 450 °C.
Download figure:
Standard image High-resolution imageIn some articles, the curves will reach stable strain after the peak stress because dynamic recovery offset strain hardening [18, 19]. For example, the flow stress of most alloys or micron-sized particle-reinforced composites tended to drop and finally reached stable. It is a typical dynamic soften characteristic. But it was special in the figure 2(a), the curves fluctuated a lot when the deformation temperature was 300 °C. In higher temperature, a small amount of deformation energy storage contributed to DRX. However, in lower temperature, DRX rarely happened. In other words, the existence of nanoparticle (ZrB2 + Al2O3) played a pinning role to increase dislocation and results in curve fluctuation. In addition, the curves of 300 °C/0.1 s−1 and 300 °C/0.01 s−1 increased sharply at the first step and then arrived gradually the peak. Afterward, it dropped with regular fluctuations, which may be attributed to flow softening (related to restoration mechanism) [20]. With the full view of the whole pictures, it can be observed that most curves have an upward trend, this kind of abnormal condition could be attributed to the strain hardening caused by particle strengthening. Nayak et al [21] found that the addition of the particles increased the dislocation density near to the interface of matrix-reinforcement.
3.3. Kinetic analysis and constitutive equations
In the study about the hot deformation behavior of the metal or metal matrix composites, Arrhenius constitutive model describes the relationship between flow stress(σ), strain rate(ε) and temperature(T) [15]. It is assured that equations (2)) are applied to lower stress (ασ < 0.8) and higher stress (ασ > 1.2) respectively. The equation (4) is a hyperbolic sine suitable for all values of stress levels.


Where  is the strain rate(s−1), and A, A1, A2(s−1) are the constant, n, n1 are the stress exponent, Q (KJ/mol) is the hot deformation activation energy, reflecting the degree of difficulty in hot deformation of materials, R (8.314 J mol−1 ·K−1) is the gas constant, α is the stress multiplier (Mpa−1). T (K) is the absolute temperature (K).
  is the flow stress.
Besides, the equation (5) also plays an important role in the study of hot deformation which shows temperature-compensated strain rate [22].

The combination of equations (4) and (5) as follows:

The equation (6) is relation the of Z and flow stress. Then, equations (7)–(9) is got by carrying out logarithmic transformation on both sides of the equations (2), (3), (6)


Through the analysis of the data, the 16 fixed and regular peak data of the 0.4 strain should be put into the equations (8) and (9). After linear fitting, the linear relation of lnε-lnσ and lnε-σ can be counted in the figures 4(a) and (b). As mentioned earlier, the values of n and β are not affected by deformation factors. As shown in figure 4(a), they are 9.9109 and 0.2148 respectively.
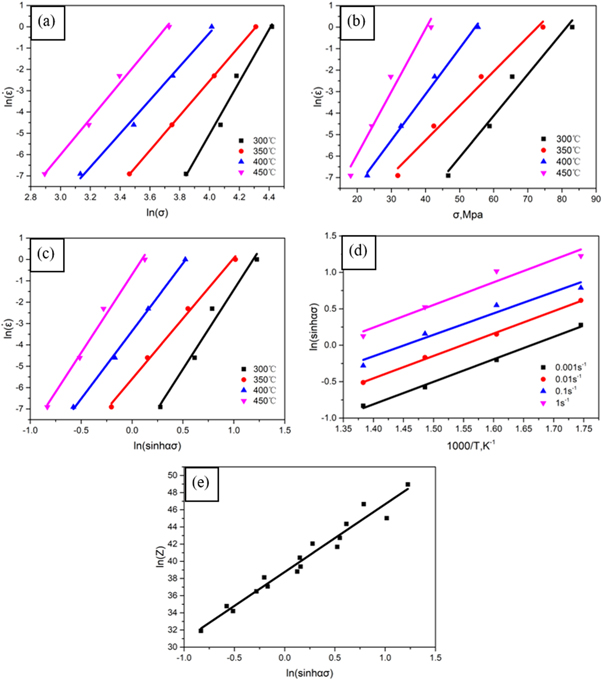
Figure 4. The linear relation of (a): ln  -lnσ; (b): ln
  -σ;(c): ln
  -ln(sinhασ) ;(d): ln(sinhασ)−1000/T (e): lnZ-ln(sinhασ).
Download figure:
Standard image High-resolution imageFinally,

For hot deformation activation energy Q, it can be figured out by the variant form of the equation (2), which is equation (11).

In figures 4(c) and (d), the slopes are obtained by linear fitting through the ln[sinh(αα)]-lnε and 1/T-ln[sinh(ασ)], which can be determined to be the value of n and s, respectively. Then, the value obtained will be generated into the formula to calculate the hot deformation activation energy Q. The Q of the in situ 3 vol.% (ZrB2 + Al2O3)/AA6016 composite is 233 KJ mol−1, while the self-diffusion activation energy is 144 kJ mol−1 [23]. The activation energy is larger than the lattice self-diffusion, indicating the possibility of the occurrence of DRX at high temperature [24]. There was also a phenomenon that Q greatly increased due to the addition of particles in the relevant literature. It can be explained that the dislocation migration was seriously hindered by reinforcement particles. The reinforced particles distributed on grain boundaries transfers force and played the pinning effect on the dislocation and grain boundary migration.
The coefficient of lnZ and ln[sinh(ασ)] is 0.993, which shows that the whole data is accurate and in accordance with the law. Finally, the constitutive equation is as follows:

3.4. Processing map
Utilizing the DMM, processing map was established at the values of 0.4 strain to look for reliable and reasonable means for hot processing. To avoid the harmful processing area, the instantaneous total power P and energy dissipation theory were lucubrated in depth. P, as the equation (13) shows, can be divided into two parts. While G is heat consumption, J expresses micro-mechanism transformation.

The strain rate sensitivity coefficient m can be obtained by the nuanced J and G of the above formula, as follows:

Where m reflects the distribution relationship between j and G, and can well describes the machinability. Since hot deformation can be regarded as energy consumption, a parameter, η, which represents specific energy consumption, is introduced into the computing process.

J as shown above. Due to the Jmax =  /2 (m = 1), η will be represented as equation (15)

Through formula deformation, it is obvious that η and m are positively correlated. The energy dissipate map is a contour map about the relationship between T(K) and ε(s−1).
After the calculation of 16 fixed values, m is fitted with cubic splines fitting following the equations (17) and (18). The equation (17) is the linear relation between σ and ε. After then, the strain rate sensitivity coefficient m can be calculated by equation (18).


The energy dissipation map is obtained by combining the formula equations (16)–(18). Ordinarily, the deformation area with high η value is most suitable for processing. However, high η value is possibly accompanied by flow instability, such as cavities and cracks. It is necessary to look for the area with high η value and flow stability at the same time to optimize process. Therefore, the determination of the region of instability is based on the dimensionless instability parameter, ξ, which follows equation (19) [25]:

when  the area is considered unstable. Otherwise, it is safe machinable area. By combining and superimposing energy dissipate map with instability map, the hot processing map, (η-T-ln
 ), is created to explain the change of microstructure and avoid instability area, which is for selection of specific research areas.
Figure 5 is the processing map at a strain of 0.4 of the in situ (ZrB2 + Al2O3)/AA6016 composite. From the map, energy dissipation efficiency η (%) was marked on the contours. Meanwhile, the gradient pointed out the special microstructural change area. The shadow part was the area that should be avoided. It is easy to discover two peak areas in the stable region.
- (1)Domain A: the range of temperature and strain rate is 300–360 °C and 0.08–0.01 s−1 respectively. Its peak η is about 24%.
- (2)Domain B: the range of temperature and strain rate is 410 °C–430 °C and 0.37–1 s−1 respectively, which is a smaller area than Domain A. However, its peak η is about 43%, much higher than Domain A.

Figure 5. Processing map of in situ (ZrB2 + Al2O3)/AA6016 composite.
Download figure:
Standard image High-resolution imageFrom the map, more dense contours can be observed in these regions (Domain A and B), especially in Domain B. In this composite, the change of flow behavior is mainly related to microstructural transformation and the load transferred by hard particles, which reflects these two unique domains. Meanwhile, the optimized process parameters are related to the location of the area with the highest energy consumption. In addition, the value of the activation energy reflects the hot working performance. Therefore, it is important to study the change of these two domains.
In medium and high temperature (380 °C–450 °C), the value of η increased with the raise of strain rate. But according to the contour profile of the peak of energy dissipation efficiency, η decreased when the strain rate exceeds 1 s−1. Generally, when the strain rate is exceeds 10 s−1, obvious rupture will occur in the material [13]. The shadow area in the upper left corner showed that irreversible damage has occurred in the material.
In medium and low temperature (300 °C–380 °C) and low strain rate (0.001–0.004 s−1), the lower value of η meant that the strain rate sensitivity coefficient(m) is lower. This is related to the existence of threshold stress [26]. The larger threshold stress below 450 °C will result in the lower value of m. Especially from 360 and 420 °C, the threshold stress will not decrease, which forms valley in 400 °C–420 °C. When the deformation temperature continues to rise by more than 450 °C, the threshold stress will disappear and atomic diffusion will be severer. So, the value of η gradually increase, which is consistent with the trend of the profile in the processing map.
3.5. Microstructural observation of deformed specimens
The microstructural transformation is caused by a complex process between reinforced particles and matrix. Figure 6 shows OM images of corresponding microstructure characteristic of the deformed composite specimens. The elongated grains with the average grain size of about 50 μm can be seen from the area of shadow instability in figure 6(a) (300 °C/1 s−1). Meanwhile, a lot of black phase distributed along grain boundaries, which can be determined as precipitated phase. It is due to the difficulty for the precipitated phase to remelt under the low temperature of deformation. Besides, the high strain rate (1 s−1) represents a very short deformation time so that the precipitated phase is too late to remelt [27]. Generally, microstructure, such as micropore, microcrack and particle cracking, can explain the causes of instability region. As shown in the SEM image (figure 6(a)), the microcracks were easily identified in predicted instability region. Meanwhile, it was hard to observe microcracks in the SEM images of stability regions (figures 6(b)–(d)). At low temperature and high strain rate, the plastic deformation with the matrix can't be matched up with that of reinforced particles, hindering the dislocation slip or climbing. Unoptimized deformation parameters are unable to consume dislocations through microstructural changes. At this time, when the excessive internal stress exceeds the interfacial bonding strength between the particles and the matrix, the particles will fall off from matrix and even lead to particle cracking, meanwhile there will also be microcracks. In addition, the uneven grain size obviously indicates inhomogeneous flow, which leads to instability region.
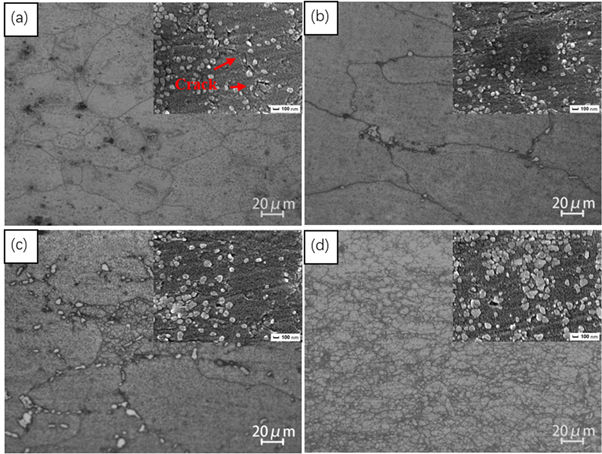
Figure 6. OM and SEM images of the set samples after deformed: (a)T = 300 °C,  = 1 s−1 and SEM image inserted in the upper right corner; (b) T = 350 °C,
  = 0.01 s−1; (c) T = 400 °C,
  = 1 s−1; (d) T = 450 °C,
  = 1 s−1.
Download figure:
Standard image High-resolution imageIn the Domain A(350 °C, 0.01 s−1), grains were extended perpendicular to extrusion direction, as shown in figure 6(b). Grain deformation and lengthening requires the absorption of a large amount of energy to provide generation of dislocations. This kind of microstructural change with high energy consumption is DRV structure. Figure 6(c) obviously revealed an area where fine grains are surrounded by elongated grains. This phenomenon can be regarded as a recrystallization zone, because it occurred in matrix and the grain size is very small.
In the Domain B(450 °C, 1 s−1), where the value of η was 43%, many fine equiaxed grains appeared with a size about 2–10 μm. From some studies, the value of η in the area of DRX is 30%–50% [28]. Owing to the high stacking fault energy of aluminum, microstructural changes and the energy dissipation, it can be determined that CDRX occurs in this area. DRX is a continuous process and an important softening mechanism. DRX not only provides stable flow behavior but also reshapes microstructure by eliminating dislocations and swallowing up subgrain boundaries. The defects in the Domain B were less than that in Domain A in figure 6(b). This also suggested clearly that the partial precipitation reduced with the increasing deformation temperature, which improves the stability of the microstructure. As shown in figure 6(d), it can be clearly seen that finer grains were concentrated near the particles. This phenomenon indicated that the particles had a positive effect on the recrystallized grains. This area is called particle forming zone(PDZ [29]) and is dominated by particle stimulated nucleation (PSN [29]). The migration and growth of the subgrain boundary at higher temperature promotes the emergence of DRX. So DRX nucleation first appears around the reinforced particles. However, the interfacial migration and interface formation are hindered by the pinning of particles, which means, the growth of recrystallization grains is hindered, which is consistent with the research [15, 30, 31] of Xu el. and the grain distribution shown in the figure 6(d). Combined with figures 6(c) and (d), the microstructure transformation of DRX can be better reflected under different hot deformation parameters. Therefore, domain B can be regarded as a processing window with good processing performance.
Temperature affects the recrystallization behavior by affecting the nucleation and growth of recrystallization grain. Figure 6 shows TEM images of samples deformed at different condition. Figure 6(a) showed microscopic morphology of ZrB2 and Al2O3. And the inserted EDS diagram reconfirmed the existence of the ZrB2 and Al2O3. Due to the great difference in thermal expansivity and modulus between the hard particles and Al matrix, many dislocations and deformed areas will be formed near the particles during deformation, as shown in figure 7(b). The large distortional strain energy will provide a great driving force for the nucleation and growth of DRX [32]. With the increase of temperature, the rearrangement and annihilation of dislocations are more likely to occur, and subgrains are more likely to form. Then the initial core of recrystallized grains will appear and grow. As shown in figure 7(c), the recrystallization grain boundary was clearly visible and the number of dislocations reduced. The equal thickness stripes at the grain boundary of Grain A revealed that the recrystallization had been completed. The recrystallized grain size was 2–4 μm, which quite corresponded to figure 6(d). Moreover, the Grain B in the image was the secondary recrystallization nucleation. The particles in the Grain A and at the grain boundary of Grain B proved that the particles promote the formation of recrystallized grains in 450 °C. So, the ZrB2 and Al2O3 particle cluster will promote the occurrence of recrystallization by increasing the dislocation density at high temperatures.
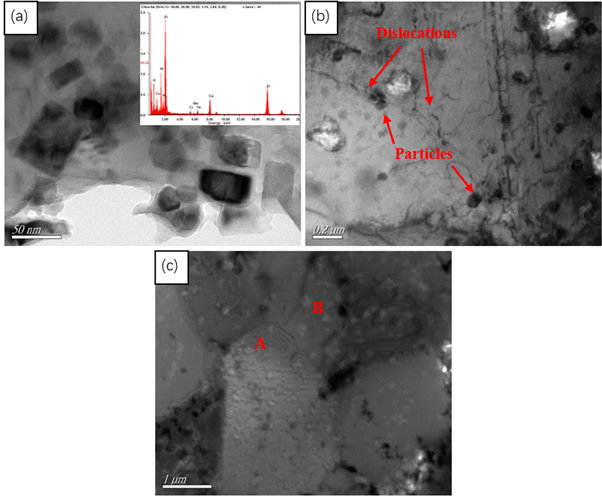
Figure 7. TEM images of composite samples of different deformation: (a) with TEM-EDS image inserted in the upper right corner; (b) T = 350 °C,  = 0.01 s−1; (c) T = 450 °C,
  = 1 s−1.
Download figure:
Standard image High-resolution image4. Conclusion
The hot deformation behavior of the in situ 3 vol% (ZrB2 + Al2O3)/AA6016 composite has been studied in this study. The compression samples with different hot deformation parameter s were analyzed in order to optimize the processing conditions and study the microstructure changes of the samples. The conclusions were as follows:
- 1.The in situ (ZrB2 + Al2O3)/AA6016 composite can be obtained by DMR with the system of K2ZrF6-Na2B4O7. The presence of reinforced particles was demonstrated by SEM, TEM and EDS.
- 2.The activation energy of composite was 233.24 KJ while the stress exponent was 9.1909. As a result, the constitutive equation was calculated by the stress value of 0.4 strain, which as follows:

- 3.It was easy to discover two peak areas in the stable region: Domain A (300 °C–360 °C, 0.08–0.01 s−1) showed the elongated grain, which can be determined to be DRV. Domain B (410 °C–430 °C, 0.37–1 s−1) showed fine equiaxed grain, which exhibited DRX microstructure. Combined with unstable region and high energy dissipation region, the hot working parameters were optimized and the appropriate hot working window was confirmed.
Acknowledgments
The authors would like to acknowledge the financial support of the Natural Science Foundation of China (Nos.U1664254, 51701085, 51801074), the Natural Science Foundation for Young of Jiangsu Province, China (BK20160516, BK20170543), the Six Talents Peak Project of Jiangsu Province (2018-XCL-202), the Jiangsu Province Key Laboratory of High-end Structural Materials (HSM1803).