

Abstract
In this research, we have attempted to accurately investigate the corresponding quantities of the structure, including the phase percent, the lattice constants, and the microstructure, including the size and shape of the crystallites, and the strain of the lattice corresponding to each layer of the multilayer structure. For this purpose, two well-known transparent oxide films i.e. TiO2 and ZnO have been grown on the glass substrate, respectively, and then annealed at temperatures between 400 and 550 °C. The structure and microstructure quantities of ZnO/TiO2 bilayers have been calculated using the x-ray diffraction analysis and Rietveld refinement method. The Rietveld results have demonstrated the presence of two distinct components of ZnO with the wurtzite structure and a component for TiO2 with the anatase structure. These results have indicated that annealing temperature plays an important role in controlling the percentage of phase, size and shape of crystallites, but does not have any essential influence on the variation of microstrain. Finally, the results obtained from Rietveld method have been compared with those obtained by scanning electron microscope images.
Export citation and abstract BibTeX RIS
1. Introduction
The transparent conductive oxide multilayers (TCOM) are the important branch of semiconductors with the intermediate and even different properties compared to the single layers. In TCOM films the electrical conductivity [1], optical transparency [2] as well as the gas sensor [3] and mechanical stability [4] are significantly improved and therefore, they have various applications in the research and development areas of the industries. It look likes that similar to the single layers, one of the effective parameter on the physical properties of TCOM is the particle size of each layer [5, 6].
Among the various methods which can evaluate the size and shape of crystallites or grains, the electron microscopy and x-ray diffraction analysis (XRD) are two well known approaches to estimate the structure as well as microstructure parameters of thin films [7, 8]. Contrary to XRD, the shape and size of grains can be directly observed and measured by transmission and scanning electron microscopy (TEM and SEM) [9, 10] and therefore, most of the researchers in the field of materials science have used the electron microscopy images in their scientific documents. Nevertheless, the SEM and TEM images have some restriction [11]. In most of the cases the SEM and ordinary bright TEM can only observe the grains instead of crystallites, therefore the distinction between the grains and crystallites is usually impossible [12]. Of course, the dark-TEM and High resolution TEM (HR-TEM) images more or less can observe the crystallites. But the quality and resolution of the dark TEM is frequently poor [13]. Also, the equipment of HR-TEM is more expensive and sensitive, and therefore, it is not possible for many research centers to buy it. Moreover, in the study of thin films, the preparation of samples for taking the TEM images is extremely time-consuming and frustrating.
Instead, the XRD is the powerful, suitable and non-destructive method to study the depth of a material, therefore it can successfully be applied to investigate the behavior of multilayer thin films. Various approaches have been proposed and developed to extract the behavior of crystallites from the x-ray diffraction patterns, including: modified Williamson-Hall and modified Warren-Averbach [14], fourth order restricted moment [15], whole powder pattern modeling [16], convolutional multiple whole profile (CMWP) [17] and Rietveld [18] methods. As the importance of phase fraction, between these methods, it seems the Rietveld is the best one to study the structure and microstructure of multilayers. However, the XRD methods also have some drawbacks. Although the powder samples can usually be simply analyzed by XRD, in the study of thin films, due to the low thickness of the layer, the intensity of most of the lines in the x-ray patterns such reduced that can not be distinguished from the background. In this situation, the only possible way is to increase the thickness of films. Of course, in single layer films this is possible, because the film thickness usually has less effect on the structure and microstructure of films [19, 20]. Therefore, most of the researchers have preferred to produce two series of films: the lower thickness for studying the physical properties and higher thickness to evaluate the extracted XRD parameters. But in the investigation of multilayer films another problem occurs: in most of the cases, with increase of the thickness in upper layer, the x-ray can not completely penetrate through the depth of lower layers and therefore, the x-ray peak intensity corresponding to the lower layers reduces. All of the above evidences strongly show that the study of multilayers is more complicated than the single layer films.
To the best of our knowledge no attempt had been made to evaluate the structure and microstructure parameters of multilayer films in details. The main goal of this work is to challenge the above parameters of TCOM systems. Therefore, two well known transparent metal oxides i.e. TiO2 and ZnO have been selected. Both of them are quite healthy with no toxic effects and have the unique physical properties. The TiO2 and ZnO nanopowders have been deposited on the glass slide substrates using the spray pyrolysis method and then annealed in air at temperature interval between 400 and 550 °C. The x-ray diffraction patterns of the films have been analyzed using the Rietveld refinement procedure. It was found that in addition to the TiO2 phase, our films have been composed of two distinc ZnO components with different morphology. The variation of output parameters i.e. the lattice constants, phase fractions, micro-strain, crystallite size and the shape of crystallites corresponding to both the ZnO as well as the TiO2 phases have been studied as a function of annealing temperature. Finally, the SEM images have been compared to the results of Rietveld method.
2. Materials and methods
The ZnO/TiO2 multilayer films have been deposited on the glass slide substrates in two separate experiment using the spray pyrolysis. Before any deposition the substrates have been cleaned in the ultrasonic bath with the acetone, 2-propanol and deionized water in a consecutive order and dried with nitrogen flow. The solutions of ZnO and TiO2 have been prepared by solving the 2.194 gr of zinc acetate dihydrate and 5 ml of titanium tetraisopropoxide in 12 ml deionized water and 10 ml ethanol, respectively. (The details have been described in [21, 22]). The mixtures have been separately stirred in room temperature until the homogenous and transparent solutions were obtained. In the next step the ZnO and TiO2 solutions have been sprayed on the cleaned substrates that kept onto the rotating hot plates. The parameters of spray deposition process are schematically illustrated in figure 1. In the spray process tow sets of bilayer films have been prepared. In first set, the ZnO has been sprayed on the glass substrate and after drying the ZnO layers, the TiO2 has been deposited on the glass/ZnO system. In the second set, the ZnO has been deposited on the glass/TiO2 films. Finally, each set has been annealed in air at the temperature between 400 and 550 °C, with the step temperature of 37.5 °C. The first set has been labeled as S1 to S5 and second set as S6 to S10. In order to investigate the structure as well as the microstructure parameters, the x-ray diffraction patterns of our films and LaB6 powder (to calculate the instrumental broadening) have been collected by an X'Pert Pro PMD diffractometer using the CuKα radiation (λ = 1.541 9 Å), in step scan mode for the angular range of 20–80 °2θ, the step size of 0.026 and the step time of 60 s.
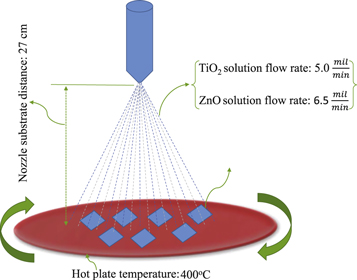
Figure 1. Schematic diagram of optimized spray parameters for deposition of glass/ZnO/TiO2 nanofilms.
Download figure:
Standard image High-resolution image3. Results and discussion
3.1. x-ray diffraction analysis
Figure 2 shows the x-ray patterns of samples S1 to S10. A simple comparison between these patterns and the JCPDS cards of TiO2 and ZnO crystals (No. 21-1272, 21-1276 and 16-0617 for anatase, rutile and brookite phases of TiO2 as well as the 36-1451 and 77-0191 for wurtzite and zinc blende phases of ZnO) indicates that among the above crystal structures only the anatase and wurtzite are found in the experimental x-ray patterns and with the increase of annealing temperature no transition phase occurs in the films.
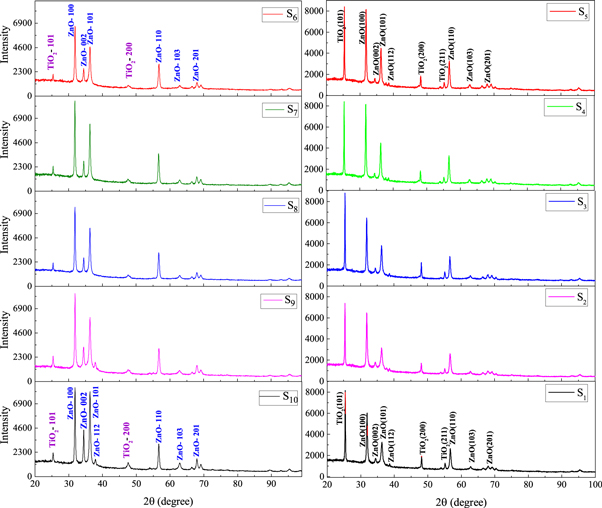
Figure 2. Comparison of the observed x-ray diffraction patterns for samples S1 to S10 with the JCPDS cards of zinc oxide and titanium dioxide.
Download figure:
Standard image High-resolution imageUp to now the various XRD methods have been proposed to estimate the crystallite size and lattice distortion of the polycrystalline materials, including: Scherrer formula [23], Williamson-Hall plot [24], Warren-Averbach's Fourier [25] and variance [26, 27] methods. Although the above approaches have been widely applied in the various scientific literatures, non of the above traditional methods can evaluate the anisotropic size and strain broadening of peak profiles. Also, the phase fractions of multilayers, multicomponents or compound materials can not be determined from these approaches. On the other hand, although other more modern methods like the whole powder pattern modeling and convolutional multiple whole profile (CMWP) can successfully extracted the linear and planar defects from the anisotropic strain broadening of x-ray diffraction profiles, the structure and microstructure parameters can not be simultaneously studied by the methods so far mentioned in this section. The alternative approach is the Rietveld refinement procedure.
Until now different Rietveld packages have been developed. One of the well known free software, is Fullprof suite developed based on the DBWS package 1997 [28]. In order to analyze the x-ray data of our ZnO/TiO2 bilayers, firstly the instrumental broadening effect has been evaluated by plotting the full width at half maximum as well as the Lorentzian parameter η of each Bragg reflection versus peak position, fitting the second order polynomial functions to the data and determining the Caglioti coefficients (U, V, W, X, Y and Z). These coefficients as well as the space group, atomic positions and the initial values of lattice constants for both the TiO2 and ZnO phases have been entered in the Fullprof and the x-ray diffraction patterns have been simulated (see the details in the Fullprof manual).
It should be noted that in the poly-crystalline materials with non-spherical crystallite shapes, the size contribution in peak broadening is not a regular function of diffraction vector. Also, in the study of nanocrystalline materials, the defects density is usually very high and therefore, the broadening of microstrain is not a monotonous function of d-spacing. The above two approaches can be well modeled in Fullprof software package to evaluate the anisotropic line broadening of peak profiles [29]. In first attempt the above process has been repeated for the x-ray data of samples S1 to S5 (glass/ZnO/TiO2 systems), the structure and microstructure parameters have been refined until the difference between the simulated and measured patterns is minimized. But except the S5 , results of other samples are not satisfactory. For a better observation the fitting results of samples S2 and S4 are shown in (figure 3). As is seen for both the ZnO and TiO2 structures, the peak positions are found, however unlike the TiO2, not the intensity nor the integral breadth of 100, 101 and 110 reflections corresponding to ZnO phase are well simulated. The initial hypothesis which comes to mind is that in addition to ZnO and TiO2, the non-fitted profiles in the observed x-ray patterns have been caused by the existence of combined phase corresponding to these two materials. Therefore, the line profiles of two new possible components i.e. Zn2TiO4 and ZnTiO3 have also been simulated by Fullprof software and compared to the measured patterns, but no progress has been made.

Figure 3. The measured and fitted diffraction patterns of samples (a) S2 and (b) S4 by assuming single ZnO component using the Rietveld refinement procedure (the small vertical lines show the Bragg reflection positions of each phase, blue: ZO1 and red: TO).
Download figure:
Standard image High-resolution imageIn another attempt to solve the problem, similar to the process of our previous work [30], the hypothesis existence of two ZnO components with wurtzite structure but different microstructure parameters has been proposed. The various structure and microstructure parameters of both the ZnO components in addition to the TiO2 phase have been refined. Fortunately, using this approach the favorable outcome has been achieved for all bilayer films (figure 4).
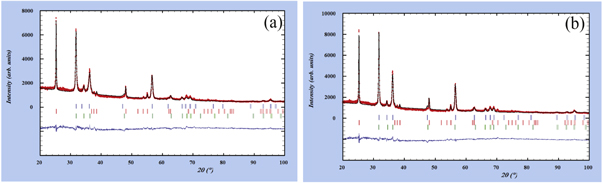
Figure 4. The measured and fitted diffraction patterns of samples (a) S2 and (b) S4 by assuming two ZnO components using the Rietveld refinement procedure (the small vertical lines show the Bragg reflection positions of each phase, blue: ZO1, red: TO and green: ZO2).
Download figure:
Standard image High-resolution imageThe output crystallite sizes of Fullprof software are summarized in tables 1 and 2. In these tables the TiO2 phase and two components of ZnO are briefly named as TO, ZO1 and ZO2, respectively. It is clear that in TO and ZO2 phases, the size of crystallites corresponding to various reflections more or less is constant and only fluctuates around the mean value of D, which indicates that the crystallites have approximately the spherical shape. It can also be observed that for both of the above phases (ZO2 and TO), in the annealing temperature interval between 400 to 475 °C, there is no significant effect on the size of crystallites. However, with the increasing of the annealing temperature from 475 to 550 °C, the average crystallite size of ZO2 and TO increases from 15.7(5) to 31.6(8) nm and 61.7(1) to 66.9(2) nm, respectively (figure 5). On the other hand, from the results of ZO1 phase, the crystallites of different hkl planes have not been uniformly grown and therefore, the shape of crystallites has not been perfectly spherical (table 2). In this phase the crystallite size, determined from 100 and 200 reflections, has grown more than others, which is in agreement with the theory proposed in 1982 by Langford and Louer [31]. The details have not been given here but fully described in our previous papers [32]. From this theory the correlation between the crystallites size of hkl miller indices (Dhkl) and the main characteristics of an ellipsoid crystallite i.e. height (H) and width (W) can be written as:

where φ is the angle from the normal of the highest Dhkl and other hkl reflections. The value of φ can be determined for hexagonal crystal system from the formula given in the appendix 3 (lattice geometry section) of [33]. Figure 6 shows the plots of  versus
  . The intercept and slope of fitted lines give the height and width of ZO1 phase (corresponding to sample S1 to S5). These values as well as the ratio of height to width are plotted versus annealing temperature in figure 7. From this plot, it can be seen that with the rise of annealing temperature, both of the height and width of crystallites increases, however the ratio of height to width significantly decreases which indicate that shape of crystallites changes from ellipsoidal to spherical.
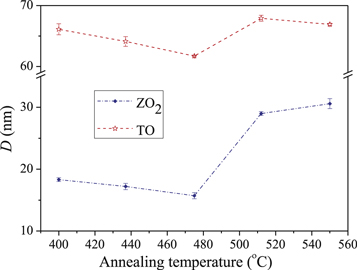
Figure 5. The variation of crystallite size versus annealing temperature for ZO2 and TO components of glass/ZnO/TiO2 bilayers.
Download figure:
Standard image High-resolution image
Figure 6. The plot of  versus
  for samples S1 to S5.
Download figure:
Standard image High-resolution image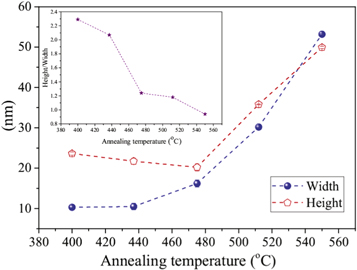
Figure 7. The variation of width, height and height/width versus annealing temperature for glass/ZnO/TiO2 bilayers.
Download figure:
Standard image High-resolution imageTable 1. The crystallite size (nm) of samples S1 − S5 at various hkl reflections for TiO2, calculated using the Rietveld refinement method.
| TO | ||||||||
|---|---|---|---|---|---|---|---|---|
| 2θ(°C) | h | k | l | S1 | S2 | S3 | S4 | S5 |
| 25.28 | 1 | 0 | 1 | 66.3 | 65.0 | 61.8 | 68.1 | 66.6 |
| 36.81 | 1 | 0 | 3 | 59.6 | 57.6 | 61.7 | 64.6 | 66.0 |
| 48.04 | 2 | 0 | 0 | 70.5 | 67.3 | 61.8 | 70.0 | 68.1 |
| 55.05 | 2 | 1 | 1 | 69.0 | 66.7 | 61.8 | 69.4 | 67.4 |
| 62.01 | 2 | 1 | 3 | 65.0 | 63.3 | 61.8 | 67.4 | 66.5 |
| 62.51 | 2 | 0 | 4 | 62.1 | 61.0 | 61.7 | 66.0 | 66.0 |
| 70.29 | 2 | 2 | 0 | 70.5 | 67.3 | 61.8 | 70.0 | 68.1 |
| 74.80 | 2 | 1 | 5 | 61.7 | 59.8 | 61.7 | 65.7 | 66.2 |
| 76.02 | 3 | 0 | 1 | 69.4 | 67.0 | 61.8 | 69.5 | 67.5 |
| 82.07 | 3 | 0 | 3 | 66.3 | 65.0 | 61.8 | 68.1 | 66.6 |
| 82.52 | 2 | 2 | 4 | 65.1 | 63.0 | 61.8 | 67.4 | 66.8 |
| 83.12 | 3 | 1 | 2 | 68.2 | 66.2 | 61.8 | 69.0 | 67.1 |
Table 2. The crystallite size (nm) of samples S1 − S5 at various hkl reflections for two ZnO components, calculated using the Rietveld refinement method.
| S1 | S2 | S3 | S4 | S5 | |||||||||
|---|---|---|---|---|---|---|---|---|---|---|---|---|---|
| h | k | l | φ | ZO1 | ZO2 | ZO1 | ZO2 | ZO1 | ZO2 | ZO1 | ZO2 | ZO1 | ZO2 |
| 1 | 0 | 0 | 0 | 27.1 | 16.8 | 26.1 | 14.1 | 26.8 | 12.5 | 43.5 | 27.1 | 56.5 | 34.7 |
| 1 | 0 | 1 | 28.22 | 9.8 | 18.9 | 9.7 | 18.2 | 11.0 | 16.8 | 21.5 | 29.7 | 31.7 | 31.7 |
| 1 | 0 | 2 | 47.02 | 7.8 | 19.3 | 7.6 | 19.3 | 9.7 | 18.0 | 19.3 | 30.2 | 29.3 | 28.4 |
| 1 | 0 | 3 | 58.15 | 7.6 | 19.0 | 7.4 | 18.6 | 10.2 | 17.2 | 20.2 | 30.0 | 30.8 | 26.8 |
| 2 | 0 | 0 | 0 | 27.1 | 16.8 | 26.1 | 14.1 | 26.8 | 12.5 | 43.5 | 27.1 | 56.5 | 34.7 |
| 1 | 1 | 2 | 42.59 | 10.2 | 18.0 | 11.1 | 16.4 | 13.2 | 14.8 | 19.3 | 28.7 | 38.1 | 31.1 |
| 2 | 0 | 1 | 15.02 | 13.8 | 18.0 | 10.8 | 16.4 | 14.4 | 14.8 | 27.1 | 28.7 | 38.5 | 33.7 |
| 2 | 0 | 2 | 28.22 | 9.8 | 18.9 | 9.7 | 18.2 | 11.0 | 16.8 | 21.5 | 29.7 | 31.7 | 31.7 |
| 1 | 0 | 4 | 65.02 | 7.8 | 18.7 | 7.5 | 17.8 | 11.1 | 16.3 | 21.7 | 29.4 | 33.0 | 26.0 |
| 2 | 0 | 3 | 38.83 | 8.3 | 19.3 | 8.2 | 19.2 | 9.9 | 17.8 | 19.7 | 30.2 | 29.5 | 29.8 |
| 1 | 1 | 4 | 57.05 | 8.4 | 18.1 | 8.9 | 16.6 | 12.4 | 15.1 | 18.2 | 28.8 | 37.0 | 27.8 |
The other important output of Rietveld procedure are summarized in table 3 and figure 8.

Figure 8. The plot of lattice constant as a function of annealing temperature for glass/ZnO/TiO2 bilayers.
Download figure:
Standard image High-resolution imageTable 3. The results of lattice constants and phase fractions using the Rietveld refinement procedure corresponding to samples S1 − S5.
| ZO1 | ZO2 | TO | |||||||
|---|---|---|---|---|---|---|---|---|---|
| a(nm) | c(nm) | Phase fraction(%) | a(nm) | c(nm) | Phase fraction(%) | a(nm) | c(nm) | Phase fraction(%) | |
| S1 | 0.324 87 | 0.534 68 | 16.8(3) | 0.324 88 | 0.521 71 | 24.4(6) | 0.378 46 | 0.957 42 | 58.8(8) |
| S2 | 0.324 78 | 0.532 25 | 26.9(6) | 0.324 57 | 0.521 73 | 15.9(8) | 0.378 51 | 0.956 95 | 57(1) |
| S3 | 0.324 76 | 0.531 39 | 26.6(3) | 0.324 42 | 0.521 56 | 16.0(5) | 0.378 49 | 0.956 35 | 57.4(8) |
| S4 | 0.325 22 | 0.522 79 | 41.8(9) | 0.325 97 | 0.518 95 | 10.6(9) | 0.378 57 | 0.955 39 | 47.5(9) |
| S5 | 0.325 35 | 0.522 07 | 49(1) | 0.327 08 | 0.512 17 | 4.8(7) | 0.378 64 | 0.954 78 | 46.2(6) |
From these plots, with the increase of annealing temperature all of the c parameters decrease, the value of a lattice parameter in TO phase linearly increase and no regular variation is observed in the a parameters of ZO1 and ZO2 components. It is also seen that in this temperature interval, the phase fractions of TO, ZO1 and ZO2 change from 58.8 (8) to 46.2 (8)%, 16.8 (3) to 49.0 (1)% and 24.4 (6) to 4.8 (7)%, respectively.
The another important parameter in the study of nanocrystalline martials is the mean square of microstrain ( ). The output results of Rietveld are given in tables 4 and 5. As is observed, for all the TO, ZO1 and ZO2 phases, the microstrain of each reflection only oscillates around its average value and no anisotropy strain broadening is observed in the phases of samples. It seems the main reason of this occurrence is that, in the deposition process the substrate temperature has been set to 400 °C. The high temperature has made it possible for the crystallites to growth with the least degree of lattice defects. The mean square of strain (
 ) is plotted versus annealing temperature in figure 9. From the plots it is seen that, only the microstrain of ZO2 phase increases as the increasing of annealing temperature, but the microstrain of ZO1 and TO doesn't significantly changed. the increase of microstrain of ZO2 well be justified by reducing the amount of phase fraction (see table 3).
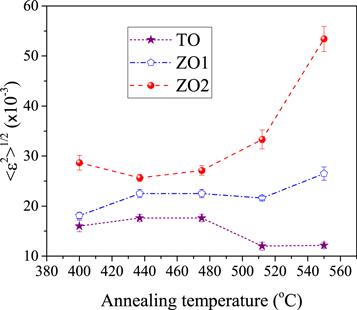
Figure 9. The variation of mean square strain versus annealing temperature for ZO1, ZO2 and TO components of glass/ZnO/TiO2 bilayers.
Download figure:
Standard image High-resolution imageTable 4. The microstrain (×10−3) of samples S1, S3 and S5 at various hkl reflections for TiO2, calculated using the Rietveld refinement method.
| h | k | l | S1 | S3 | S5 |
|---|---|---|---|---|---|
| 1 | 0 | 1 | 15.2 | 16.7 | 12.0 |
| 1 | 0 | 3 | 18.9 | 18.8 | 12.0 |
| 2 | 0 | 0 | 13.2 | 15.7 | 10.8 |
| 2 | 1 | 1 | 13.9 | 16.5 | 11.1 |
| 2 | 1 | 3 | 16.7 | 18.0 | 12.8 |
| 2 | 0 | 4 | 17.8 | 18.2 | 13.8 |
| 2 | 2 | 0 | 15.0 | 18.2 | 11.3 |
| 2 | 1 | 5 | 18.5 | 19.0 | 14.0 |
| 3 | 0 | 1 | 13.2 | 15.7 | 10.8 |
| 3 | 0 | 3 | 15.1 | 16.7 | 12.0 |
| 2 | 2 | 4 | 18.0 | 19.8 | 13.3 |
| 3 | 1 | 2 | 14.9 | 17.5 | 11.5 |
Table 5. The microstrain (×10−3) of samples S1, S3 and S5 at various hkl reflections for two ZnO components, calculated using the Rietveld refinement method.
| S1 | S3 | S5 | ||||||
|---|---|---|---|---|---|---|---|---|
| h | k | l | ZO1 | ZO2 | ZO1 | ZO2 | ZO1 | ZO2 |
| 1 | 0 | 0 | 17.6 | 23.3 | 22.1 | 22.5 | 22.1 | 22.5 |
| 1 | 0 | 1 | 17.6 | 27.2 | 22.1 | 24.4 | 22.1 | 25.2 |
| 1 | 0 | 2 | 17.6 | 32.3 | 22.1 | 27.2 | 22.1 | 28.9 |
| 1 | 0 | 3 | 17.6 | 34.2 | 22.1 | 28.3 | 22.1 | 30.4 |
| 2 | 0 | 0 | 17.6 | 23.3 | 22.1 | 22.5 | 22.1 | 22.5 |
| 1 | 1 | 2 | 20.6 | 29.8 | 24.5 | 25.8 | 24.5 | 29.8 |
| 2 | 0 | 1 | 17.6 | 24.0 | 22.1 | 22.8 | 22.1 | 22.9 |
| 2 | 0 | 2 | 17.6 | 27.2 | 22.1 | 24.4 | 22.1 | 25.2 |
| 1 | 0 | 4 | 17.6 | 35.1 | 22.1 | 28.8 | 22.1 | 31.0 |
| 2 | 0 | 3 | 17.6 | 20.3 | 22.1 | 26.1 | 22.1 | 27.4 |
| 1 | 1 | 4 | 20.4 | 34.0 | 24.4 | 28.1 | 24.4 | 30.5 |
At first sight, it seems that there is no meaningful correlation between the results of ZO1 and ZO2 components, however the regular behavior can be found with a closer look at the output results. Therefore, similar to the electron microscopy images the phase fractions as well as the size and shape of the crystallites were schematically simulated for both the ZnO phase (see figure 10). In these figures the particles of ZO1 and ZO2 are shown in red and yellow colors, respectively. The total fractions of both components are also approximately normalized to the summation of ZO1 and ZO2 particles which considered as 30. From the figure 10(a), it reveals that in sample S1 the particles of ZO1 and ZO2 have the dumbbell and spherical shapes, respectively. By increasing the annealing temperature, not the crystallite size of both ZnO components only increases, but the phase fractions of ZO1 also increases and shape of particles becomes to the sphere. Especially in samples S4 and S5, the crystallite size of ZO1 and ZO2 strongly increases and in sample S5 both of them lead to an identical component (figure 10(e)). An exactly, similar treatment can also be observed in the variation of c lattice parameter (figure 8(a)). In this plot, with the increase of annealing temperature the c lattice parameters of two ZnO components tend to get close together.

Figure 10. The Schematic illustration for the fluctuation of crystallite shape and size of ZnO phase in glass/ZnO/TiO2 films for samples (a) S1 (b) S2 (c) S3 (d) S4 (e) S5.
Download figure:
Standard image High-resolution imageIn the next step, we have attempted to investigate the layer sequence effect on the microstructure and structure properties of our TiO2/ZnO films. As is seen in Naseri et al [34] and Khan et al [35] works changing of the layer sequence in TiO2/ZnO bilayers, strongly changes the physical properties of films. However, to the best of our knowledge, so far no systematic study has been performed on the correlation between the layer sequence and size as well as the shape of crystallites. Therefore, XRD of samples S6 to S10 (glass/TiO2/ZnO systems) have been analyzed using the Rietveld refinement.
The results are arranged in tables 6–8. Similar to samples S1 to S5, the new set is composed of two ZnO component with spherical and ellipsoidal shapes. However, the phase fraction of TiO2 corresponding to S6 to S10 is significantly less than S1 to S5. As discussed in the introduction section, the reason for the above difference is that in multilayer films during the x-ray irradiation a large percentage of x-ray is often observed in the upper layer and can not completely penetrate in the inner layers. Consequently, the intensity of diffraction peaks corresponding to the inner layers is significantly decreased and we can not compare the phase fraction of two multilayer films with different layer sequences by XRD. In all glass/TiO2/ZnO films, as the less TiO2 phase fraction, the microstructure parameters of TiO2 phase cannot be carefully refined by Fullprof and doesn't be reported here. The microstructure parameters of both the ZO1 and ZO2 components are shown in figures 11 and 12. Comparing all of the above outcomes it is found that the change of layers sequence has not any significant effect on the behavior of size and shape of crystallites in both of the glass/TiO2/ZnO and glass/ZnO/TiO2 systems.
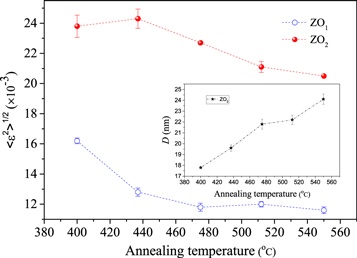
Figure 11. The variation of mean square strain versus annealing temperature for ZO1 and ZO2 components of glass/TiO2/ZnO bilayers, the behavior of crystallite size of ZO2 are shown in the sub-plot.
Download figure:
Standard image High-resolution image
Figure 12. The variation of width, height and height/width versus annealing temperature for glass/TiO2/ZnO bilayers.
Download figure:
Standard image High-resolution imageTable 6. The results of lattice constants and phase fractions using the Rietveld refinement procedure corresponding to samples S6 − S10.
| ZO1 | ZO2 | TO | |||||||
|---|---|---|---|---|---|---|---|---|---|
| a(nm) | c(nm) | Phase fraction(%) | a(nm) | c(nm) | Phase fraction(%) | a(nm) | c(nm) | Phase fraction(%) | |
| S6 | 0.325 34 | 0.525 60 | 22.9(9) | 0.325 09 | 0.521 43 | 70.2(9) | 0.378 57 | 0.959 15 | 6.9(6) |
| S7 | 0.325 11 | 0.526 66 | 30.2(8) | 0.324 94 | 0.521 58 | 62.6(8) | 0.376 01 | 0.987 63 | 7.1(2) |
| S8 | 0.324 87 | 0.527 62 | 34.5(9) | 0.324 79 | 0.521 74 | 58.1(9) | 0.376 16 | 1.016 12 | 7.4(5) |
| S9 | 0.324 88 | 0.531 33 | 80.1(9) | 0.324 73 | 0.522 08 | 12.5(4) | 0.379 02 | 0.951 48 | 7.4(5) |
| S10 | 0.325 20 | 0.532 40 | 82.6(8) | 0.325 20 | 0.521 75 | 11.1(3) | 0.378 98 | 0.952 30 | 6.3(2) |
Table 7. The crystallite size (nm) of samples S6 to S10 at various hkl reflections for two ZnO components of glass/TiO2/ZnO bilayers, calculated using the Rietveld refinement method.
| S6 | S7 | S8 | S9 | S10 | |||||||||
|---|---|---|---|---|---|---|---|---|---|---|---|---|---|
| h | k | l | φ | ZO1 | ZO2 | ZO1 | ZO2 | ZO1 | ZO2 | ZO1 | ZO2 | ZO1 | ZO2 |
| 1 | 0 | 0 | 0 | 28.0 | 18.2 | 34.3 | 21.3 | 42.2 | 25.1 | 43.8 | 26.3 | 70.0 | 28.4 |
| 1 | 0 | 1 | 28.22 | 11.9 | 17.6 | 13.5 | 19.6 | 15.5 | 22.0 | 16.1 | 22.9 | 28.4 | 24.6 |
| 1 | 0 | 2 | 47.02 | 10.7 | 17.5 | 11.7 | 18.7 | 12.9 | 20.3 | 13.4 | 20.9 | 20.1 | 22.1 |
| 1 | 0 | 3 | 58.15 | 10.4 | 17.6 | 11.6 | 18.5 | 13.2 | 19.7 | 13.7 | 20.0 | 18.0 | 21.0 |
| 2 | 0 | 0 | 0 | 28.0 | 18.2 | 34.3 | 21.3 | 42.2 | 25.1 | 43.8 | 26.3 | 70.0 | 28.4 |
| 1 | 1 | 2 | 42.59 | 15.3 | 17.8 | 17.2 | 19.4 | 19.6 | 21.5 | 20.3 | 25.5 | 30.7 | 24.0 |
| 2 | 0 | 1 | 15.02 | 15.5 | 17.9 | 18.1 | 20.6 | 21.3 | 23.9 | 22.1 | 24.8 | 41.1 | 26.7 |
| 2 | 0 | 2 | 28.22 | 11.9 | 17.6 | 13.5 | 19.6 | 15.5 | 22.0 | 16.1 | 22.9 | 28.4 | 24.6 |
| 1 | 0 | 4 | 65.02 | 10.4 | 17.7 | 13.7 | 18.5 | 17.9 | 19.6 | 18.5 | 19.8 | 37.4 | 20.6 |
| 2 | 0 | 3 | 38.83 | 10.9 | 17.5 | 12.1 | 19.1 | 13.6 | 21.1 | 14.1 | 17.3 | 22.7 | 23.1 |
| 1 | 1 | 4 | 57.05 | 14.6 | 17.8 | 15.7 | 18.6 | 17.1 | 19.6 | 17.7 | 17.8 | 21.7 | 21.2 |
Table 8. The microstrain (×10−3) of samples S6, S8 and S10 at various hkl reflections for two ZnO components, calculated using the Rietveld refinement method.
| S6 | S8 | S10 | ||||||
|---|---|---|---|---|---|---|---|---|
| h | k | l | ZO1 | ZO2 | ZO1 | ZO2 | ZO1 | ZO2 |
| 1 | 0 | 0 | 15.9 | 20.2 | 11.4 | 23.0 | 11.3 | 20.5 |
| 1 | 0 | 1 | 15.9 | 24.0 | 11.4 | 22.8 | 11.3 | 20.5 |
| 1 | 0 | 2 | 15.9 | 29.0 | 11.4 | 22.6 | 11.3 | 20.6 |
| 1 | 0 | 3 | 15.9 | 30.9 | 11.4 | 22.5 | 11.3 | 20.6 |
| 2 | 0 | 0 | 15.9 | 20.2 | 11.4 | 23.0 | 11.3 | 20.5 |
| 1 | 1 | 2 | 17.6 | 24.9 | 13.9 | 22.7 | 13.5 | 20.5 |
| 2 | 0 | 1 | 15.9 | 20.8 | 11.4 | 23.0 | 11.3 | 20.5 |
| 2 | 0 | 2 | 15.9 | 24.0 | 11.4 | 22.8 | 11.3 | 20.5 |
| 1 | 0 | 4 | 15.9 | 31.7 | 11.4 | 22.0 | 11.3 | 20.6 |
| 2 | 0 | 3 | 15.9 | 27.0 | 11.4 | 22.7 | 11.3 | 20.6 |
| 1 | 1 | 4 | 17.5 | 29.3 | 13.2 | 22.5 | 12.7 | 20.6 |
Finally, the Rietveld analysis outcomes have been compared to those of SEM images. Because of the limitation of SEM devices to study the depth of multilayers, for better investigation four series of SEM images were prepared as: the images of TiO2 and ZnO single layer films which are shown in figures 13(a) to (d) and also the bilayers of glass/ZnO/TiO2 as well as the glass/TiO2/ZnO systems which are given in figures 14(a)–(d), respectively. A preliminary comparison between the images of figures 14(a) and (b) indicates that the presence of ZnO under the TiO2 layer has a great influence on the crystal arrangement, in the way that for TiO2 single layer the grains irregularly exist together with the island groups (see figures 13(a) and (b)). However, in both of the bilayer films (annealed at 400 and 550 °C) the distribution of grains is uniform. The similar behavior can also be observed in figures 13(c), (d), 14(c) and (d). From the surface morphology not the quality of deposition in glass/TiO2/ZnO system only is significantly higher than the ZnO single layer, but the grains of bilayer is also more uniformly distributed than single layer ones.
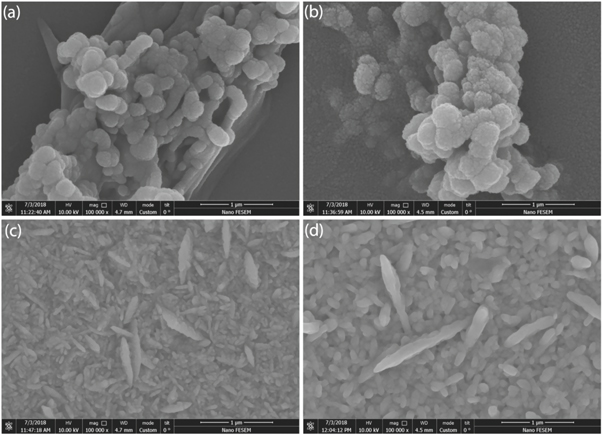
Figure 13. The SEM images of samples: (a) pure TiO2 annealed at 400 °C, (b) pure TiO2 annealed at 550 °C, (c) pure ZnO annealed at 400 °C and (d) pure ZnO annealed at 550 °C.
Download figure:
Standard image High-resolution image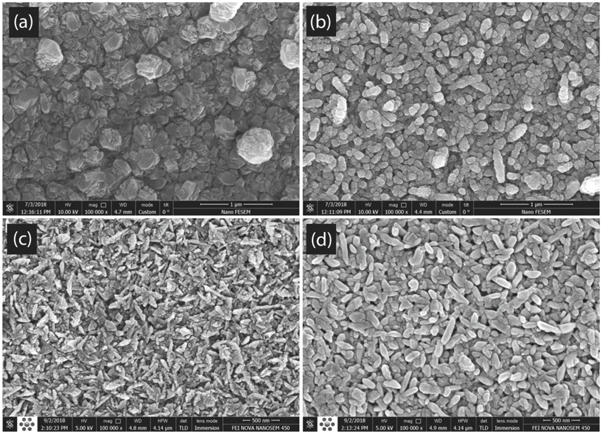
Figure 14. The SEM images of samples: (a) glass/ZnO/TiO2 annealed at 400 °C, (b) glass/ZnO/TiO2 annealed at 550 °C, (c) glass/TiO2/ZnO annealed at 400 °C and (d) glass/TiO2/ZnO annealed at 550 °C.
Download figure:
Standard image High-resolution image
Improving the order of grains in both series of ZnO/TiO2 films can occur due to the exchange interaction effects and roughness in the interface of two different layers. The similar behavior have been reported in the study of optical, electrical and magnetic properties of TCO/metal/TCO [36] , Sb-SnO2(ATO)/Ag [37] and [Co/Pt]n/Pt/Co [38] films . It can also be seen from the SEM micrographs that for both the ZnO and TiO2 phases, as the increase of heat treatment, the average size of grains grows which is in agreement with the behavior of crystallite size extracted by XRD. Furthermore, similar to the XRD outcomes, the particle of TiO2 phase are nearly spherical and as the increase of temperature the shape of grains remains spherical. The only significant difference between the results of XRD and SEM is that from the SEM micrographs the shape of ZnO grains is exactly cylindrical and the heat treatment has not any significant effect on the shape transformation of particles. However, according to the XRD results the annealing temperature changes the ZnO crystallite shape from the ellipsoid to sphere. The reason of the above disagreement is due to the difference between the meaning of crystallite and grains, extracted by XRD and SEM, respectively. From the simulated schematic results of XRD (figures 10) and SEM micrographs (figures 13 and 14), it is obviously observed that in both of the ZnO and TiO2 phases the obtained SEM grains have bigger size, which means that each grains is formed from the several subgrains or crystallites.
4. Conclusions
In this work the benefits and disadvantages of the x-ray diffraction analysis as well as the scanning electron microscopy methods have been investigated in the studying the crystallite size and crystallite shape of each layer in multilayer films. Therefore, the ZnO/TiO2 bilayer samples have been prepared by spray-pyrolysis technique and then annealed at temperature between 400 to 550 °C. The x-ray diffraction patterns of films have been analyzed using the Rietveld refinement method. The scanning electron microscopy micrographs of TiO2 and ZnO single layers in addition to the ZnO/TiO2 bilayers have also been studied. In conclusion it has been found that :
- (1)The ZnO layers are composed of two different crystallite shape, the ellipsoidal and spherical.
- (2)Not with the increase of annealing temperature the size of crystallites in both ZnO component only increases, but the ellipsoidal crystallines also reshape to spherical and therefore, in sample annealed at 550°, both the components are quietly closed to each other.
- (3)In TiO2 layer the size of spherical crystallites increases from 63(4) nm to 66.9(2) nm, with the increase of annealing temperature from 400 to 550 °C, indicating that the annealing temperature improve the crystal quality of films.
- (4)The annealing temperature doesn't have any significant effect on the variation of microstrain.
- (5)The influence of layer sequence was studied by comparing the Rietveld output parameter of glass/TiO2/ZnO and glass/ZnO/TiO2 films, which indicate that expect the phase fraction, other results more or less remain constant.
- (6)The scanning electron microscopy micrographs show that in glass/ZnO/TiO2 and glass/TiO2/ZnO samples the grains are more uniformly distributed than the TiO2 and ZnO single layers, the grain size of both the ZnO and TiO2 layers increases as the rise of annealing temperature in accordance to the x-ray diffraction analysis results.