

Abstract
The ability of rare-earth-doped ferroelectric oxides to achieve outstanding upconversion (UC) performances under NIR irradiation despite possessing intrinsic electric properties drives researchers all over the globe to work in this field. The structural and spectroscopic characteristics of the Bi4Ti3O12 phosphor integrated with Er3+, Yb3+, and Al3+ have been thoroughly investigated in this study. The considerable increase in UC emission ∼three times caused by the addition of Al3+ ions has been observed and discussed. The processes connected with the UC emission related to the pump power variation have been realized using the rate law equation. Aside from having high sensitivity of 0.011 K−1 at room temperature, the prepared phosphor possesses excellent thermal stability, i.e., it retains ∼73% of its initial intensity with the addition of Al3+ ions.
Export citation and abstract BibTeX RIS
1. Introduction
In the century of science and technology, the passion for scientific breakthroughs has undoubtedly been pushed by brilliant ideas. Besides discovering new materials, existing materials are indeed drawing interest owing to their additional breathtaking properties different from the current ones. Upconversion luminescence-based lanthanide-doped materials have received widespread attention in recent years due to their potential and practical applications in sensing, anti-counterfeiting, bioimaging, lighting, DSSCs, etc, owing to the inherent optical properties of REs such as low biotoxicity, low photobleaching, long lifetime, high photostability, significant anti-Stokes shifts, etc, [1–6]. In the perspective of generating efficient UC materials for diverse applications, modification in the luminous characteristics of phosphors has been achieved through various synthesis techniques, and compositional has been implemented. One such approach is tri-doping with non-lanthanide ions to improve the UC emission intensity. Yin et al reported a significant enhancement in the green and red region after doping Mo3+ ions in NaYF4: Er-Yb nanocrystals [7]. A two-times increment in the UC emission has been witnessed from the ZnWO4: Tm-Yb phosphor due to the incorporation of Mg2+ ions reported by Yadav et al [8]. Alternatively, ferroelectric oxides, especially Bismuth titanate (BTO), gathered attention owing to the multidirectional applications in ferroelectric, capacitors, non-volatile memories, optoelectronics, luminescence, etc, [9–11]. Even after ignoring the inherent electric and other properties of ferroelectric oxides in favor of projecting the rare earth (RE) doped BTO as a purely optical material, the BTO as a luminous host has been used in several studies due to its low phonon energy (800 cm−1), high chemical and thermal stability [11, 12]. On the other hand, being a distinct class of optical materials, UC phosphors may also be utilized in temperature detection. Though the conventionally used infrared cameras or thermocouples made justice to meet the expectation up to a certain extent, specific requirements could not be fulfilled by these probes since the traditional IR camera requires good calibration and the thermocouple lags in terms of instant detection. In this context, optical temperature sensors based on the fluorescence intensity ratio (FIR) approach outperform conventional approaches due to their insensitivity to electromagnetic interference, noninvasive, noncontact, accurate, and quick detecting capabilities [12–14]. Lanthanide ions like Tm3+, Er3+, Ho3+, and Dy3+ are commonly favored for optical thermometry owing to the existence of a pair of thermally coupled levels. However, Er3+ ions are the most preferred ones in UC luminescence and optical thermometry owing to the availability of a large number of energy levels [15]. Likewise, oxide hosts are generally selected for optical thermometry over other materials because of their higher thermal stability and broader temperature detection range [16]. Zhang et al investigated the thermal properties of Er3+–Yb3+: NaYF4 phosphors using the FIR technique and obtained the maximum relative sensitivity ∼1.68% K−1 at 258 K [17]. Recently, Chen et al reported a maximum relative sensitivity up to 1.152% K−1 at 303 K of novel Y4GeO8:Er3+, Yb3+ phosphors [18].
The Bi4Ti3O12 phosphor co-doped with Er3+, Yb3+, and Al3+ ions have been synthesized, adopting the solid-state reaction technique in this study. All UC emission processes supported by rate law equations have been discussed, in addition to other spectroscopic findings. The increase in the UC emission owing to the inclusion of Al3+ ions has been noted and discussed. It has been studied in various works that the enhancement in the UC emission intensity due to the Li+ ions doping is broadly understood with the charge compensation effect and the crystal field modification around the Er3+ ions, whereas in case of Al3+ ion doping it is due to the local crystal field modifications around the Er3+ ions. Zhao and co-workers stated the reduction of local crystal field symmetry around Er3+ ions as the reason for the enrichment in red UC emission intensity of Er3+–Yb3+: GdF3 due to Li+ co-doping [19]. A Similar reason has been cited by Singh et al while studying the UC emission phenomena in Er3+–Yb3+–Li+: Y2Ti2O7 phosphors [20]. Pattnaik and Rai have obtained an efficient UC emission in Er3+–Yb3+–Li+: CaTiO3 phosphor considering the charge compensation effect [21]. However, in the current work Al3+ doping not only improves the UC emission intensity but also enhances the maximum temperature sensing range from 473K to 573 K of Er3+–Yb3+: Bi4Ti3O12 phosphors with better thermal stability.
1.1. Synthesis procedure
The Er3+, Yb3+ and Al3+ co-doped Bi4Ti3O12 phosphors with varied concentrations have been synthesized through standard solid state reaction technique. The chemicals like Bi2O3, TiO2, Er2O3, Yb2O3, and Al2O3 have been employed as the starting ingredients. Stoichiometric quantities of the respective chemicals have been weighed and mixed constantly around 2 h in an agate mortar and pestle using acetone. To eliminate impurities and produce desired materials, the ground phosphors have been calcined at 1000 °C for 3 h at a heating rate of 5 °C min−1 in a high temperature muffle furnace. The synthesized samples were crushed for a few minutes to get homogeneous and fine powders, which were then utilized for further characterization.
1.2. Material characterization
An x-ray diffractometer utilizing Cu-K radiation has been used for phase identification, lattice parameter calculation, and average crystallite size estimation. The x-ray diffraction (XRD) spectra have been collected across a broad range of Bragg's angles, from 10° to 80° (2θ), with 0.02-degree step size. Diffuse reflectance spectra have been monitored by Lambda 950 UV–vis-NIR spectrophotometer (Perkin Elmer) to compute the optical bandgap of the prepared phosphors. Surface morphology has been studied using FESEM. The UC emission spectra have been collected using a triple turret grating monochromator (Princeton) in conjunction with a photomultiplier tube (PMT). 980 nm continuous wave (CW) laser diode has been used to stimulate the prepared samples. A small handmade heater connected with a thermocouple positioned near (2 mm) to the laser point has been utilized to evaluate the thermometric parameters associated with frequency UC emission. To control the temperature, a Variac has been employed.
2. Results and discussion
2.1. Structural characterization
The structural information and development of the crystalline phase of the synthesized phosphors have been characterized by XRD. Figure 1(a) shows the x-ray diffraction pattern of the synthesized Bi4Ti3O12, Er3+: Bi4Ti3O12, Er3+-Yb3+: Bi4Ti3O12, and Er3+-Yb3+-Al3+: Bi4Ti3O12 phosphors, scanned in the range from 10° to 80° (2θ). All the intense diffraction peaks of the prepared phosphors converge to the standard diffraction reference pattern ICSD 98-015-9929 with no extra diffraction peaks, which further confirms the formation of a single phase of the phosphors. The prepared phosphors are thus to have an orthorhombic phase with the Aba2 space group. The maximum diffraction peak associated with all the phosphors is assigned to the (171) hkl plane.
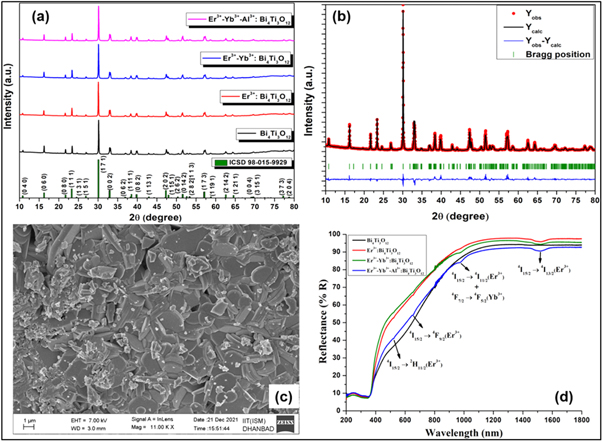
Figure 1. X-ray Diffraction patterns of (a) Bi4Ti3O12, Er3+: Bi4Ti3O12, Er3+–Yb3+: Bi4Ti3O12, and Er3+–Yb3+–Al3+: Bi4Ti3O12 phosphors, (b) Rietveld refinement pattern of Er3+–Yb3+–Al3+: Bi4Ti3O12 phosphor, (c) FESEM image of Er3+–Yb3+–Al3+: Bi4Ti3O12 phosphor, (d) Diffuse reflectance spectra of Bi4Ti3O12, Er3+: Bi4Ti3O12, Er3+–Yb3+: Bi4Ti3O12, and Er3+–Yb3+–Al3+: Bi4Ti3O12 phosphors.
Download figure:
Standard image High-resolution imageThe lattice constants of the prepared phosphors have been obtained through the Rietveld refinement technique using FULLPROF software and are listed in table 1. The Rietveld refined XRD pattern of Er3+–Yb3+–Al3+: Bi4Ti3O12 phosphors have been depicted in figure 1(b), and all other refined patterns are given in {SI figure 1(a)–(c) (available online at stacks.iop.org/MAF/10/034002/mmedia)}. The average crystallite sizes of the phosphors have been evaluated with Scherrer's equation and are found to lie between ∼56 nm to 59 nm [22, 23]. It is interesting to note that no impurity peaks are obtained despite doping Er3+, Yb3+, Al3+ ions in Bi4Ti3O12 phosphors. This may be ascribed to the low concentration of doping ions or the successful substitution of dopant ions in the lattice sites of Bi4Ti3O12 phosphors. Based on the R D Shannon's ionic radii database, the effective ionic radii corresponding to the six-coordinated Bi3+, Ti4+, Er3+, Yb3+, and Al3+ are 1.03 Å, 0.605 Å, 0.89 Å, 0.868 Å, and 0.535 Å, respectively [24].
Table 1. Rietveld refinement parameters of all the prepared phosphors.
| Samples | Rp | Rwp | Rexp | χ2 | Cell parameters (Å) | Cell volume (Å3 ) |
|---|---|---|---|---|---|---|
| Bi4Ti3O12 | 20.0 | 15.9 | 11.48 | 1.92 | a = 5.4093(1) | 967.14(3) |
| b = 32.8426(6) | ||||||
| c = 5.4438(1) | ||||||
| α=β=γ=90° | ||||||
| Er3+: Bi4Ti3O12 | 18.3 | 14.9 | 10.49 | 2.02 | a = 5.40763(9) | 966.39(2) |
| b = 32.8418(5) | ||||||
| c = 5.44148(8) | ||||||
| α=β=γ=90° | ||||||
| Er3+-Yb3+: Bi4Ti3O12 | 17.6 | 14.6 | 10.3 | 2.02 | a = 5.4071(1) | 966.14(5) |
| b = 32.834 (1) | ||||||
| c = 5.4418(1) | ||||||
| α=β=γ=90° | ||||||
| Er3+-Yb3+-Al3+: Bi4Ti3O12 | 19.8 | 19.3 | 13.05 | 2.19 | a = 5.4057(1) | 965.39(3) |
| b = 32.8290(7) | ||||||
| c = 5.4398(1) | ||||||
| α=β=γ=90° |
Various researches suggest that all the trivalent ions must replace the Bi3+ site due to the similar charge, whereas from the ionic radius point of view, Al3+ has more chance of replacing the Ti4+ site. But several investigations suggest that although the smaller ionic radii of Al3+ ions than Bi3+, the solution energy to replace Bi3+ is smaller than Ti4+. Hence, the Al3+ ions also can replace the Bi3+ site [25]. Thus, it should be evident that the substitution of smaller ionic radii in the Bi3+ site may result in lattice shrinkage, i.e., Er3+ doping causes less lattice shrinkage followed by Yb3+ and Al3+, which can be verified from SI figure 1(d) [26].
The FESEM images of Bi4Ti3O12 phosphors synthesized at 1000 °C for 3h co-doped with Er3+, Yb3+, and Al3+ have been portrayed in figure 1(c). The morphology of the prepared phosphor exhibits plate-like structures [27, 28]. Since the particles shown in the image are indistinct, individual sizes of the particles are very difficult to determine. For the compression purpose, FESEM images of undoped and co-doped with Er3+ and Er3+-Yb3+ Bi4Ti3O12 phosphors are also depicted in SI figures 2(a)–(c).
The Raman spectra for the undoped Bi4Ti3O12 phosphor have been recorded in the frequency range from 100–1000 cm−1. As shown in SI figure 2(d), various sharp characteristic peaks along with a few broad and weak peaks have also been monitored around 116, 225, 267, 329, 360, 404, 443, 537, 574, 657, 769, and 846 cm−1 that is in good agreement with the previously reported works [29–31]. According to the Raman selection rules, there are 24 Raman active modes possible for the orthorhombic Bi4Ti3O12 with a combination of different symmetries (6Ag+2B1g+8B2g+8B3g). Generally, the higher wavenumber phonon modes are assigned to the vibrations corresponding to Ti–O atoms and lower phonon modes are designated to the Bi–O atoms [31]. The 118 cm−1 Raman modes in the Bi4Ti3O12 phosphor denote the appearance of the Bi atom in the A-site of the pseudo-perovskite layer [29]. The phonon modes corresponding to 225, 267, 329, 537, and 846 cm−1 have been assigned to the internal vibrational modes of TiO6 octahedrons [32], in which 225 cm−1 and 267 cm−1 appear due to the distortion in the TiO6 octahedrons [31]. The modes at 360, 404, 443, and 846 cm−1 arise from the combination of stretching or bending vibrations of Ti-O. In contrast, the 537 cm−1 and 574 cm−1 modes result from the opposite displacement of the apical oxygen atom of TiO6 octahedral [30]. The mode at 657 cm−1 has been ascribed to the symmetric stretching vibrations of Ti-O, while the 769 cm−1 denotes the vibration associated with oxygen defects [33].
2.2. Optical characterization
The UV–vis-NIR spectra of the prepared phosphors have been recorded in the diffuse reflectance mode at room temperature. Data has been collected for the undoped and co-doped Bi4Ti3O12 phosphors in the range from 200–1800 nm keeping the step size 0.5 nm (figure 1(d)). The BaSO4 powder has been used as the reference for baseline correction. The broad peak that arises from 200–400 nm has been attributed to the host lattice, whereas the sharp band beyond the 400 nm range is due to the f-f transitions from the rare-earth ions. The peaks around 523 nm, 654 nm, and 1515 nm arise explicitly due to the Er3+ activator ions, and the transitions responsible for the above peaks are 4I15/2 → 2H11/2, 4I15/2 → 4F9/2, and 4I15/2 → 4I13/2, respectively. The 978 nm peak can be simultaneously allocated to the 4I15/2 → 4I11/2 and 2F7/2 → 2F5/2 transitions of the Er3+ and Yb3+ ions, respectively [34]. Besides identifying the peaks, the DRS spectra help find the optical bandgap of the prepared phosphors. For evaluating the optical bandgap of the phosphor, the DRS spectra have been converted to F(R) spectra to obey the following Kubelka-Munk expression [35, 36]:


where, F(R∞) is the Kubelka-Munk function, R∞ is the phosphor's diffuse reflectance, K and S are the absorption and scattering coefficients, respectively, hν is the incident photon energy, Eg is the optical band gap (eV), and the n value indicates the kind of optical transition, with n = 1 indicating direct allowed transitions, 2 indicating non-metallic materials, 3 indicating direct prohibited transitions, 4 indicating indirect allowed transitions, and 6 indicating indirect forbidden transitions [37]. Here, the best fit resulted for n = 1. From the Tauc plot analysis of all synthesized phosphors, and the optical bandgaps are obtained to be 3.23 eV, 3.25 eV, 3.29 eV, and 3.21 eV for Bi4Ti3O12, Er3+: Bi4Ti3O12, Er3+–Yb3+: Bi4Ti3O12, and Er3+–Yb3+–Al3+: Bi4Ti3O12 phosphors respectively. Here, the doping contents in the phosphors are significantly less, so the slight variation in the optical bandgap could be attributed to the fitting and measurement errors. The refractive index (r) corresponding to the direct optical bandgap (Eg) may also be calculated using the equation below [38].

For doped and co-doped Bi4Ti3O12, the refractive index obtained by solving the preceding equation is lying between 1.98 to 2. Because the optical bandgaps of the prepared phosphors are relatively low and they have a high refractive index, they might be potential contenders in light catalytic fields [39, 40].
2.3. Photoluminescence studies
The upconversion luminescence phenomena of the prepared phosphors have been observed under the 980 nm laser excitation. Figure 2(a) shows the optimized upconversion emission spectra for the 0.5 mol% Er3+: Bi4Ti3O12, 0.5 mol% Er3+−0.75 mol% Yb3+: Bi4Ti3O12 and 0.5 mol% Er3+−0.75 mol% Yb3+−0.5 mol% Al3+: Bi4Ti3O12 phosphors in the range from 450–750 nm at room temperature. The three intense peaks detected ∼525 nm, ∼550 nm, and ∼657 nm can be summarized as the 2H11/2 → 4I15/2, 4S3/2 → 4I15/2, and 4F9/2 → 4I15/2 electronic transitions of Er3+ ions, respectively. Various research suggests that the Yb3+ ion is ideal for sensitizer under 980 nm excitation [41, 42]. Because of the large absorption cross-section of the Yb3+ ion around 980 nm, an enhancement of 9.38 times in the green region and 15.47 times in the red region has been observed in Er3+–Yb3+ co-doped phosphors compared to Er3+: Bi4Ti3O12 phosphors. Moreover, co-doping Al3+ ions in Er3+–Yb3+: Bi4Ti3O12 phosphors increases green and red emissions by 3.15 and 2.96 times, respectively. The significant increase in UC emission triggered by Al3+ ion doping in the prepared phosphor could be ascribed to crystal field modifications and an increase in asymmetry around the Er3+ ions caused by lattice shrinkage owing to the significant differences in ionic radii between Bi3+ and Al3+ ions [43–45].
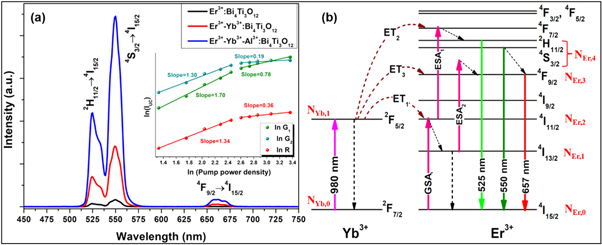
Figure 2. (a) Upconversion emission spectra of Er3+: Bi4Ti3O12, Er3+–Yb3+: Bi4Ti3O12, and Er3+–Yb3+–Al3+: Bi4Ti3O12 phosphors under 980 nm excitation, (inset: Double logarithmic plot of upconversion emission of Er3+–Yb3+–Al3+: Bi4Ti3O12 phosphor for different emissions); (b) Energy level diagram of Er3+–Yb3+ system and upconversion mechanisms under 980 nm excitation.
Download figure:
Standard image High-resolution imageThe energy level diagram (ELD) for the Er3+-Yb3+ system has been introduced to better understand the absorption and emission transition mechanisms of the prepared phosphors. Figure 2(b) depicts the energy level diagram for the 980 nm laser-excited system, including all possible phosphor mechanisms. In the case of singly doped Er3+ phosphor, the 980 nm excitation is absorbed via the ground state absorption (GSA) process to the 4I11/2 level, followed by the sequential absorption of another photon via the excited state absorption (ESA1) process to the 4F7/2 level. Again, few of the excited ions in the 4I11/2 levels relax non-radiatively to the low lying 4I13/2 levels, from which the ESA2 process to 4F9/2 levels occurs. The 4F7/2 level relaxes further to the thermally coupled levels 2H11/2 and 4S3/2, after which emission is observed at 525 nm and 550 nm in the green region due to the radiative transitions from the 2H11/2 and 4S3/2 thermally coupled levels, respectively. Likewise, the red emission ∼657 nm is attributed to a radiative transition from 4F9/2 levels. However, by doping the phosphors with Yb3+ ions, the green and red emission improved dramatically, associated with the following energy transfer (ET) processes [46, 47].
Moreover, the depopulation rates from various metastable states with different pump power density range in the Er3+–Yb3+ co-doped systems can be theoretically predicted with the help of steady-state rate equations as,
where, NEr, k (k = 0, 1, 2, 3, 4) signifies the population densities for Er3+ ions at the 4I15/2, 4I13/2, 4I11/2, 4F9/2 and (4S3/2, 2H11/2) levels, respectively, while NYb,0 and NYb,1 signify the population densities for Yb3+ ions at the 2F7/2 and 2F5/2 levels. W1, W2, and W4 reflect the non-radiative decay rates of 4I13/2, 4I11/2, and (2H11/2/4S3/2) levels, respectively. The radiative decay rates of the 4F9/2, 4S3/2, and 2H11/2 states are Wʹ3, Wʹ4 and Wʹ41, respectively. W'Yb represents the radiative decay rate of the Yb3+ ion's excited state 2F5/2. Under 980 nm excitation, K1, K2, and K3 reflect the energy transfer rates of ET1, ET2, and ET3, respectively. σij denotes the absorption cross-section between Er3+ ions at the ith and jth levels, whereas σYb denotes the absorption cross-section between Yb3+ ions at levels 2F7/2 and 2F5/2. The pump power density corresponding to the excitation wavelength of 980 nm is ρp. Since the absorption cross-section of the Er3+ ions is comparatively low from Yb3+ ions, it can be assumed that the processes like GSA and ESA took little part in populating the metastable states and hence can be neglected.
At low pump power density, the non-radiative decays from the 4I11/2 and 4I13/2 levels are dominant over ET2 and ET3 from Yb3+ ions to Er3+ ions. Thus, the energy transfers can be neglected from equations (4) and (5). Equation (8) can be reduced to,
Considering the above criteria, the equations (4) and (5) can be re-written as,


The modified equations (7) using equations (10) can be written as,
Equations (14) and (13) represent the population corresponding to the green and red emissions, respectively. As it can be observed that the populations in the respective levels are quadratic in nature, which signifies two photons are required to populate 2H11/2, 4S3/2 and 4F9/2 levels.
As the pump power density increases gradually, it can be assumed that the ET processes must overcome the non-radiative losses at the 4I11/2 and 4I13/2 levels. Hence, equations (4) and (5) can be reduced by omitting the terms -W1NEr,1 and -W2NEr,2 as,


Further, the equations (7) and (8) can be modified to,

Equation (16) defines the population corresponding to the green emission, which turns out to be a single-photon absorption. At the same time, equation (17) represents the red emission, in which the first term is independent of the pump photon, and the second term implies a single-photon absorption. The above result suggests that at high pump power density ET2 becomes efficient, and non-radiative processes increase rapidly, which eventually causes the saturation effect.
The UC emission has been measured using various laser pump power density ranges (980 nm) to validate the above theoretical assumptions. Earlier studies indicate that the relationship between the UC emission intensity (IUC) and the input pump power density (p) is not linear, with IUC∝ pn [48, 49]. The value of 'n' here determines the number of infrared (IR) pump photons necessary to populate certain levels to obtain UC emission. The plot between ln P and ln (IUC ) is shown in the inset of figure 2(a), with 'n' computed from the slope values. As stated before, the slope value approaches 2 at relatively low pump power density ranges; however, the saturation effect has been detected at higher pump power density ranges.
Chromaticity is defined by the Commission Internationale de l'Eclairage (CIE) as the distribution of colour produced by an object as a function of wavelength (λ) as experienced by human brains. Using the Go CIE software, the CIE colour coordinates of the Er3+: Bi4Ti3O12, Er3+–Yb3+: Bi4Ti3O12, and Er3+–Yb3+–Al3+: Bi4Ti3O12 phosphors have been determined to be (0.27, 0.71), (0.27, 0.72), and (0.27, 0.72), respectively. Since the doped/co-doped phosphors display dominating green emission, colour purity of the synthesized phosphors under 980 nm excitation has been measured as follows [21],
where, (XS, YS) symbolizes the sample point, (Xi, Yi) represents the illumination point and (Xd, Yd) is the dominating point of the CIE co-ordinates. The specifics of the colour coordinates and purity of the phosphors have been reported in SI tables 1 and 2. As demonstrated in SI figure 3(a), essentially negligible change in the chromaticity between Er3+: Bi4Ti3O12, Er3+–Yb3+: Bi4Ti3O12, and Er3+–Yb3+–Al3+: Bi4Ti3O12 phosphors has been detected. A modest shift in the colour coordinates towards the green area has been recorded when the pump power density rises in the Er3+ –Yb3+ –Al3+: Bi4Ti3O12 phosphor {SI figure 3(b)}.
2.4. Thermometric studies
The thermally coupled levels (TCLs)-based fluorescence intensity ratio (FIR) approach is one of the most generally acknowledged techniques for temperature sensing applications in which the FIRs fluctuate with temperature. The thermally coupled levels of Er3+ ions have been identified as the peak at 525 and 550 nm for 2H11/2 and 4S3/2 levels of Er3+ ions in this study. The difference in energy between the 2H11/2 and 4S3/2 levels is computed as ∼865 cm−1. Owing to the small energy gap (ΔE) between the TCLs, it is believed that the 2H11/2 levels could be easily populated from 4S3/2 as temperature increases gradually. The UC emission spectra of Er3+–Yb3+: Bi4Ti3O12 and Er3+–Yb3+–Al3+: Bi4Ti3O12 phosphors in the range of 505–575 nm have been recorded to explore the temperature sensing behavior of the synthesized phosphors. Because of the low emission intensity, the temperature sensing behavior of Er3+: Bi4Ti3O12 phosphor has not been investigated.
Mathematically, the FIR between the thermally coupled levels can be represented as [50],

where IH and IS indicate the emission intensities for the G1 and G2 levels, respectively. The population density for the 2H11/2 and 4S3/2 levels is represented by N(H) and N(S), respectively. The fitting energy separation between two thermally connected levels is denoted by ∆E, the Boltzmann's constant is denoted by k, the absolute temperature is denoted by T, and A is a pre-exponential constant. At first, the thermal behaviour of the Er3+–Yb3+: Bi4Ti3O12 phosphor has been witnessed in the temperature range from 300–473 K at ∼5.78 W cm−2. Beyond 423 K, the UC emission spectra return noisy data. On varying the temperature, the peak positions of 2H11/2 and 4S3/2 levels didn't alter as the FIR value varies from 0.588 to 1.895. SI figure 4(a) depicts the fitting parameters of FIR vs temperature considering the equation (19). The energy gap (∆E) between the TCLs is found to be 630.46 cm−1. Here, the calculated energy gap differs marginally from the observed energy gap of the UC emission data. Thus, it has been speculated that the decrease in the fitted ∆E value can be attributed to laser-induced heating. Generally, when the laser power increases, the laser itself produces heat around the irradiation spot which the external temperature probe cannot detect that costs difference in the actual and measured ∆E value [51]. Therefore, low laser power is recommended for precise temperature sensing measurement.
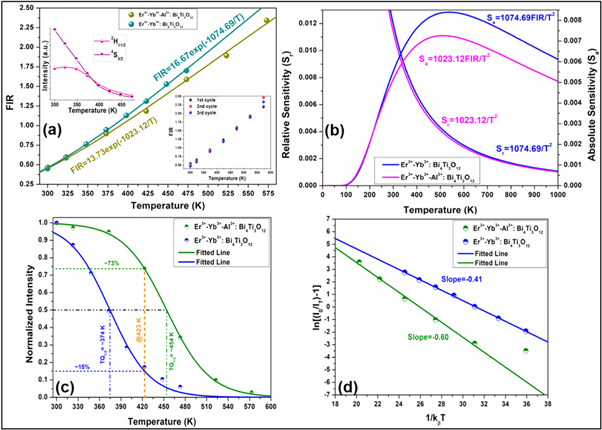
Further, to reduce the laser induced heating, the thermometric behaviour of Er3+–Yb3+: Bi4Ti3O12 phosphor has been monitored at 3.77 W cm−2. Figure 3(a) displays the variation of FIR as a function of elevating temperature. Starting from 0.45 at ambient temperature, the FIR value raises maximum up to 1.70 at 473 K and thereafter the spectra got noisy. Further, the upper inset of the figure 3(a) reflects the intensity variation of individual states as a function of temperature, which obeys the Boltzmann distribution law [52, 53]. It is no surprise that the ∆E value for the phosphor enhances to 746.91 cm−1 owing to a relatively low thermal effect at low pump power density [51]. Relative and absolute sensitivities, Sr and Sa , has been considered as the two major parameters in temperature sensors which quantity the sensor performance, thus can be stated as [53],


Figure 3. (a) Variation of FIR as a function of the absolute temperature for Er3+–Yb3+: Bi4Ti3O12 and Er3+–Yb3+–Al3+: Bi4Ti3O12 phosphor (upper inset: Modification in intensity of 2H11/2 and 4S3/2 levels as a function of temperature; lower inset: Repeatability of FIR from 300 K to 573 K), (b) Plot of absolute and relative sensitivity as a function of temperature of Er3+–Yb3+: Bi4Ti3O12 and Er3+–Yb3+–Al3+: Bi4Ti3O12 phosphor, A comparative study on the (c) Boltzmann fitting for the temperature dependent emission spectra, (d) Arrhenius fitting of thermal quenching of upconversion emission intensity of Er3+–Yb3+: Bi4Ti3O12 and Er3+–Yb3+–Al3+: Bi4Ti3O12 phosphor under 980 nm excitation.
Download figure:
Standard image High-resolution image
Further, the equation (21) can be used to evaluate the optimum absolute sensitivity and the corresponding temperature by taking dSa /dT = 0 as [54],


Figure 3(b) shows the fitted curve of both relative and absolute sensitivity with increasing temperature. The fitted curve suggests that the value of Sr at ambient temperature is 0.0119 K−1, however, Sa increases gradually with temperature to reach its maximum value ∼0.0084 K−1 at 537 K which is comparable to the experimentally observed value of ∼0.0081 K−1 at 473 K. Temperature resolution (uncertainty; δT), the minimum temperature variation detected by the optical thermometer for a slight change in the FIR can be calculated using the following formula [55, 56],

In the present case the temperature resolution of the Er3+–Yb3+: Bi4Ti3O12 phosphor at room temperature has been obtained as 0.4 K. Despite having good temperature sensing properties, the Er3+–Yb3+: Bi4Ti3O12 phosphor could not hold the UC emission shape beyond 473 K even at very low pump power density. Keeping the high UC emission intensity of Er3+–Yb3+–Al3+: Bi4Ti3O12 phosphor in mind, the temperature sensing ability of the phosphor has been examined in the same spectroscopic region under similar laser excitation power. In contrast to the Er3+–Yb3+: Bi4Ti3O12 phosphor, the UC emission spectra in a broader temperature range from 300–573 K for the Er3+–Yb3+–Al3+: Bi4Ti3O12 phosphor has made it possible. The ∆E/k value as shown in figure 3(a) between FIR vs temperature is found to be 1023.12 as the FIR varies from 0.47 to 2.34 with good repeatability as displayed in the inset. The repeatability (R) of the FIR has been calculated as [57],

where 
 represent the mean value of FIR and FIR value in 3 consecutive irradiation cycles, respectively. The calculated R values at 300 K is found to be ∼93% whereas at 573 K it is found to be ∼94%. Although the relative sensitivity has not changed much from the Er3+–Yb3+: Bi4Ti3O12 phosphor due to similar ∆E/k values, the maximum absolute sensitivity changes slightly owing to a relatively small pre-exponential factor (figure 3(b)). The temperature uncertainty for the Er3+–Yb3+–Al3+: Bi4Ti3O12 phosphor has been calculated to be 0.5 K at ambient temperature. All the important sensing parameters for the prepared phosphors have been calculated and listed in table 2 with other reported phosphors for comparison.
Table 2. Luminescent materials doped with rare-earth ions: a comparison of thermometric properties.
| Materials | Temperature range | Sr | Sa max (K−1) | References |
|---|---|---|---|---|
| Er3+–Yb3+: Bi4Ti3O12 phosphor | 300–473 K | 1074.69/T2 | 0.0084 at 537 K | Present Work |
| Er3+–Yb3+–Al3+: Bi4Ti3O12 phosphor | 300–573 K | 1023.12/T2 | 0.0072 at 511 K | Present Work |
| Yb3+–Er3+: Bi4Ti3O12 microcrystals | 313–563 K | 947.46/T2 | 0.0046 at 483 K | [12] |
| Yb3+–Er3+: NaYF4 | 298–693 K | 1117.4/T2 | — | [52] |
| Er3+–Yb3+: LiZnPO4 | 300–440 K | 11.63.26/T2 | 0.008 at 581 K | [51] |
| Er3+–Yb3+: GdVO4 | 300–453 K | 1107.19/T2 | 0.0125 at 453 K | [55] |
| Yb3+–Er3+: NaYTiO4 phosphors | 300–510 K | 1079/T2 | 0.0045 at 510 K | [54] |
Practically, the light output and colour rendering properties of the phosphor-converted light-emitting diodes (pc-LEDs) are greatly influenced by the thermal properties of the phosphor, thus the phosphor used in pc-LEDs should bear high thermal stability. To examine the thermal quenching of the prepared phosphors, the intensity variation as function of the increasing temperature has been monitored in the green region. As the temperature increases monotonically, a gradual dip in the total UC emission has been observed which follows the Boltzmann sigmoidal function [58],

Here y(x) is the normalized emission intensity value at a certain temperature (x), A1 and A2 represents the initial and final values of asymptotes respectively. x0 (x0 = TQ1/2) is the center of the sigmoid that represents the temperature at which the intensity is reduced to 50% of its initial value. Since the Boltzmann fitting is normalized, A1 and A2 values are chosen as 1 and 0 respectively.
Figure 3(c) depicts the Boltzmann sigmoidal fitting curve for Er3+-Yb3+: Bi4Ti3O12 and Er3+-Yb3+-Al3+: Bi4Ti3O12 phosphor. Previous reports suggest that the operating temperature for the pc-LEDs could reach up to ∼423 K at higher pump photon excitation. Hence under such operating conditions, the phosphors relax most of their energy through heat causing thermal quenching, which can affect the performance of LEDs. Therefore, it is essential to develop phosphors possessing low thermal quenching so that the phosphor can emit efficiently even at ∼423 K. It is evident that the UC emission intensity for the Er3+-Yb3+: Bi4Ti3O12 phosphor dies out quickly and retained only ∼15% at 423 K. However, with the co-doping of Al3+ ion, the phosphor persisted ∼73% of the initial UC emission intensity at 423 K, suggesting the excellent thermal stability of the developed phosphors like the previously reported works [59, 60]. Also, the TQ1/2 values for the Er3+-Yb3+: Bi4Ti3O12 and Er3+-Yb3+-Al3+: Bi4Ti3O12 phosphor has been attained to be ∼374 K and ∼454 K respectively. Additionally, the information about the thermal stability can also be realized by solving the Arrhenius equation [61],

where, I0
and IT
represents the intensities at initial and testing temperature, B is the quenching frequency factor, which is usually referred to the ratio between non-radiative and radiative rates and Ea
is the activation energy for the developed phosphors. In the plot between ln(I0
/IT
–1) and 1/kT, the slope value refers to the activation energy of the phosphor. From figure 3(d), the Ea
value for the Er3+–Yb3+: Bi4Ti3O12 and Er3+–Yb3+–Al3+: Bi4Ti3O12 phosphor have found to be 0.41 eV and ∼0.6 eV respectively. Furthermore, the probability of non-radiative transition per unit time (α) and the activation energy ( ) are related as [62],

where, s represents the frequency factor (s−1) and all parameters have their usual meanings. From equation (28) it can be visualized that the lower the activation energy, the higher will be the probability of the nonradiative transitions. Thus, co-doping of Al3+ ion in the Er3+–Yb3+: Bi4Ti3O12 phosphor provides greater thermal stability by reducing the nonradiative transitions. Again, the TQ1/2 value can also be achieved using Ea as [63]

All parameters have their usual meanings. The TQ1/2 values obtained for Er3+–Yb3+: Bi4Ti3O12 and Er3+–Yb3+–Al3+: Bi4Ti3O12 phosphor are ∼372 and ∼447 K respectively taking Ea into account. The similar results obtained from both Boltzmann fitting and Arrhenius equation suggest that both approaches are useful for examining the thermal stability behaviour of the prepared phosphors.
Besides having very good thermal stability at low pump power density, the Er3+-Yb3+-Al3+: Bi4Ti3O12 phosphors can convert a part of the absorbed NIR excitation to heat apart from generating UC emission at higher pump power. It can be noticed from SI figure 4(b) that the FIR increases linearly with the pump power (P) resulting in the following equation [53],

Comparing the equation (30) to the equation (19), we obtained the temperature as,

The equation (31) indicates that corresponding to each pump photon there exists a specific temperature which is generated from the non-radiative relaxation from the upper energy levels. Earlier findings indicate that applications such as photothermal treatment needed temperature between 315 and 318 K to kill cancer cells [53, 64]. Thus, it can be said that by adjusting the laser pump power between 103 mW to 112 mW, the requirements can be fulfilled. However, until the successful implementation of the synthesized phosphor for the in-vivo use, the aforementioned can't be asserted.
3. Conclusion
To sum up, the RE doped Bi4Ti3O12 phosphors synthesized using the solid-state reaction approach are found to be good at UC emission and display excellent thermal characteristics. The crystal field modification surrounding the Er3+ ions has been linked to an increase in the red and green regions of the Er3+-Yb3+-Al3+: Bi4Ti3O12 phosphor. The high relative sensitivity ∼0.0114 K−1 at the ambient temperature motivates the proposed phosphor to be beneficial for sensing applications. However, the Er3+-Yb3+-Al3+: Bi4Ti3O12 phosphor may be employed in green light LED applications as it keeps up to 73% of UC emission intensity at 150 °C compared to the ambient temperature. Furthermore, when the pump power rises, the synthesized phosphor may operate as a possible optical heater for in-vivo applications.
Acknowledgments
The authors would like to express their gratitude to the Council of Scientific and Industrial Research (CSIR), New Delhi, India, for financial support in the form of research project 03(1354)/16/EMR-II. Sasank Pattnaik, one of the authors, is grateful to IIT (ISM) Dhanbad, India, for providing the Junior Research Fellowship.
Data availability statement
All data that support the findings of this study are included within the article (and any supplementary files).
Conflict of interests
There is no conflict of interest.
Contribution to authors
Sasank Pattnaik: Conceptualization, Data collection, Formal analysis, Investigation, Methodology, Software, Validation, Visualization, Writing—original draft. Vineet Kumar Rai: Conceptualization, Investigation, Project administration, Resources, Supervision, Validation, Visualization, Writing—review & editing.