
Abstract
Plasmonic nanostructures, of which gold nanoparticles are the most elementary example, owe their unique properties to localized surface plasmons (LSP), the modes of free electron oscillation. LSP alter significantly electromagnetic field in the nanostructure neighborhood (i.e., near-field), which can modify the electric dipole transition rates in organic emitters. This study aims at investigating the influence of Au@SiO2 core–shell nanoparticles on the photophysics of porphyrins covalently attached to the nanoparticles surface. Guided by theoretical predictions, three sets of gold nanoparticles of different sizes were coated with a silica layer of similar thickness. The outer silica surface was functionalized with either free-base meso-tetraphenylporphyrin or its zinc complex. Absorption and emission bands of porphyrin overlap in energy with a gold nanoparticle LSP resonance that provides the field enhancement. Silica separates the emitters from the gold surface, while the gold core size tunes the energy of the LSP resonance. The signatures of weak-coupling regime have been observed. Apart from modified emission profiles and shortened S1 lifetimes, Q band part intensity of the excitation spectra significantly increased with respect to the Soret band. The results were explained using classical transfer matrix simulations and electronic states kinetics, taking into account the photophysical properties of each chromophore. The calculations could reasonably well predict and explain the experimental outcomes. The discrepancies between the two were discussed.
Export citation and abstract BibTeX RIS

Original content from this work may be used under the terms of the Creative Commons Attribution 4.0 licence. Any further distribution of this work must maintain attribution to the author(s) and the title of the work, journal citation and DOI.
1. Introduction
The possibility of altering spectral and photophysical properties of a luminophore in a predictable and controllable way has been a subject of intense research. Among various approaches used in this respect, an attractive option is to place a chromophore in a plasmonic environment [1–7]. This may affect both radiative and nonradiative properties. In addition, photostability can also be improved [8], as well as singlet oxygen generation rate [9]. Since the final effect may depend on many parameters, it is desirable that the modification of radiative properties be predicted prior to the experiments using appropriate theoretical modeling.
One of various plasmonic architectures used to enhance the emissive properties is based on systems composed of a plasmonic core and a dielectric shell [9–14]. In our previous work, we carried out simulations for systems consisting of porphyrin attached to gold-silica core–shell nanoparticles [15]. The calculations suggested that varying the size of the gold core and the thickness of the silica layer may not only change the emission quantum yield and decay kinetics, but it can also lead to changes in the spectral profiles. The latter may be useful, e.g., in the applications that require selecting a particular spectral region or increasing the energy gap between absorption and emission.
In the present work, we check the utility of theoretical modeling by comparing the simulated absorption and emission characteristics with the experimental data (figure 1). The investigated systems include free-base and zinc porphyrins attached to gold-silica core–shell nanoparticles of different sizes. We find a good agreement between theory and experiments. In some cases discrepancies are noted, attributed to partial aggregation of nanoparticles.
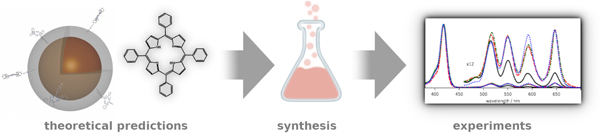
Figure 1. The methodology used in our studies: first, simulations are carried out to predict the optimal size values for gold core and silica shell. The nanoparticles of these parameters are then synthesized and used in experiments.
Download figure:
Standard image High-resolution image2. Materials and methods
2.1. Numerical simulations
The basics of the simulation method have already been described in our previous work [15]. This time, however, the simulations were developed according to [16] in Python 3 and included additional corrections: electron surface scattering [17–19] with electron mean-free path from [20] and longitudinal modes treated as in [16], but with the metal hydrodynamic constant and the longitudinal wave vector taken from [21]. The inclusion of higher order modes into the total rate enhancement of energy extraction from the dipole was made using the approach from [22] with electrostatic approximation [23]. The scripts are available from the authors upon request.
Briefly, a system consisting of an infinite medium and a multi-layer nanoparticle is assumed. The spherical symmetry allows for the electromagnetic (e-m) field for both incoming radiation (plane wave) and emission from an excited molecule (dipole) to be decomposed into Stratton multipoles and as such, using transfer matrix method, the e-m field is calculated in the whole system. The absorbed power is obtained by Poynting vector integration of incoming field over the nanoparticle surface. Similarly, the power scattered into the far field is calculated by Poynting vector integration of the outgoing field over the whole system in the infinite distance.
The absorption and scattering coefficients are calculated in terms of power absorbed by the nanoparticles and power radiated into the far-field, respectively, normalized to plane-wave power incident on the geometrical cross-section of the nanoparticle. The extinction is the sum of the two.
For the chromophore in the proximity of the nanoparticle, the excitation enhancement is the ratio of the electric field at the chromophore position averaged over the full solid angle to the mean field in a medium without the nanoparticle.
Upon excitation, the rate of the emission from the chromophore changes with the presence of the nanoparticle, because the density of the e-m field states that could be populated by the emitted photon changes upon introduction of the nanoparticle. The relation is described by the Fermi's golden rule. Fortunately, the calculation of the enhancement of the emission rate can be performed with classic electrodynamics thanks to the correspondence principle that relates the chromophore emitting photon to the dipole oscillating along the transition dipole moment direction. In such a case, the enhancement of the radiative emission rate is the ratio of total power radiated by the oscillating dipole into the far-field with and without the nanoparticle in the system. The total enhancement of the decay rate is calculated in an analogous manner, but using the total power emitted by the dipole instead. The non-radiative counterpart of the total decay rate enhancement, corresponding to the absorption of the energy by the system, is the difference between the total and radiative decay rate.
The enhancements of both, excitation and radiative decay rates, are wavelength-dependent and contribute to the changes in the appearance of the respective spectra. The radiative decay rate enhancement and addition of the non-radiative part of total decay enhancement to other non-radiative processes modify the effective quantum yield. The total enhancement of the radiative decay rate, added to the non-radiative decay rate already present in the molecule will shorten the excited state lifetime of the chromophore. Excitation and radiative decay rates enhancements as well as the shortening of the excited stare lifetime will modify the apparent brightness of the molecule emission. The details of calculations of the changes in photophysical properties can be found in section 2 of Supplementary information (SI) available online at stacks.iop.org/MAF/9/045003/mmedia. Such an approach, using a kinetic equation for the occupations of chromophore electronic levels was also described, e.g., in [24].
The distance from the chromophore center to the nanoparticle surface is assumed to be 2 nm, as estimated from the length of the attaching linker. The step for batch computations for different gold radii and silica shell thicknesses was 1 nm for both. The values of the dielectric functions were taken from the literature: gold [25], silica [26], DMF [27]. The expansion of the e-m field into multipoles was performed up to angular momentum order of 20. Additional terms up to 500th order calculated in the electrostatic approximation were taken into account in the calculation of the total decay rate enhancement.
2.2. Materials
Free-base meso-tetraphenylporphyrin, Zn(II)-meso-tetraphenylporphyrin and porphyrin-functionalized Au@SiO2 nanoparticles were synthesized. Silica nanospheres of 140 nm diameter (TEM confirmed), used as a substrate for reference nanoparticles without gold core, were purchased from Sigma-Aldrich. In all photophysical studies N,N-Dimethylmethanamide (DMF), Merck, spectral grade, was used as a solvent.
2.3. Synthesis
Silica-coated gold nanoparticles were chosen as a platform for probing the influence of a plasmonic nanoparticle on photophysics. Among many synthetic protocols, the one delivered by Liz-Marzán [28] is suitable for the synthesis of well-defined core–shell nanoparticles. The gold-core diameters, as well as silica shell thicknesses achievable by the protocol are of sizes suitable for probing nanoparticle-chromophore interactions. The obtained shell thicknesses are higher than 20 nm for gold cores of diameter higher than 60 nm. According to the protocol, the crucial silica-coating step is carried out with constant gold atoms concentration [Au0] and with constant concentration of the silica precursor. One may note that at a constant [Au0] in the solution, the larger the gold nanoparticles diameter, the lower the total surface area of the nanoparticles, which is the reason for the formation of thicker silica shells for the larger gold cores. Our attempts of controlling silica thickness were relying on the silica thickness balance. First, core–shell nanoparticles were synthesized according to the protocol, and the shell thickness was measured. Then we calculated the [Au0] concentration that could result in formation of silica shell with desired thickness. However, this approach did not result in the formation of structures of targeted shell dimensions. In fact, it allowed us to synthesize shells thinner than 20 nm, but still thicker then targeted. Attempts to further increase [Au0] resulted in the material aggregation. Finally, we decided to increase the [Au0] to 1–1.5 mM, which allowed us to obtain core–shell structure of less than 20 nm shell thickness. More details are given in the SI.
As a chromophore, we decided to apply a derivative of meso-tetraphenylporphyrin. The details of its synthesis are provided in the SI. The amino group, as a peripheral substituent of the porphyrin, plays a role of a co-linker in the process of the attachment to the silica shell surface. According to the applied protocol, the amino group reacts with 3-(triethoxysilyl)propyl isocyanate, giving the conjugate terminated with triethoxysilyl group. This group is responsible for bonding to the silica shell by the reaction of surface OH groups and Si(OEt)3. The strategy of combining chemistry of amino, isocyanate, and triethoxysilyl group is widely used for functionalization of nanostructures. The proof that the porphyrin functionalized the nanoparticles is not direct and is based on the functionalized nanoparticles, otherwise non-fluorescent, exhibiting emission spectrum of porphyrins.
2.4. Characterization
2.4.1. Morphology
Both bare Au and Au@SiO2 nanoparticles were characterized using FEI NovaNano 450 scanning electron microscope. A drop of DMF colloidal solution of the nanoparticles was deposited on the surface of tin-doped indium oxide (ITO) coated glass; the sample was studied after solvent evaporation. The outer diameter of 200–300 nanoparticles was measured for each sample using ImageJ software. The core radii rAu are the mean sizes of the bare Au nanoparticles. Silica shell thickness was determined by subtraction of the mean radius of Au nanoparticles from the corresponding AuSiO2 mean radius. As a measure of nanoparticle and shell sizes spread, standard error was used. Selected SEM images of the nanoparticles are presented in figures S16–S18.
2.4.2. Extinction
Extinction measurements of the nanoparticles suspensions were performed using Shimadzu UV-2700 spectrophotometer. A DMF suspension of the nanoparticles was transferred to a 1 cm quartz cuvette. Pure DMF was used as a reference. The maximum extinction of the solution was kept below 0.1 in order to minimize distortion of the red part of the spectrum by the scattering of the nanoparticles. The spectra are presented in figure 4.
2.4.3. Emission and emission decay measurements
Stationary emission and excitation spectra, corrected for the spectral sensitivity of the instrument, were obtained using Horiba Jobin Yvon FL3-22 Fluorolog-3 spectrofluorometer. The low extinction of the solution ensured negligible impact of the reabsorption and inner filer effect on the recorded spectra. For emission measurements, the porphyrins were excited at the Soret band (ca. 420 nm). The excitation at the Soret band was chosen, as it is the strongest porphyrin transitions in their UV-Vis absorption spectra and, moreover, it allowed us to minimize the effects of Raman scattering and silica defects luminescence [29–33] on the registered emission spectra.
The excitation spectra were obtained by observing the emission intensity at 725 nm and 650 nm for TPP and ZnTPP, respectively. To block the scattered excitation from entering the emission path, a GG-14 glass filter was used. The corresponding spectra of pure solvent were subtracted from the spectra of porphyrins to account for the dark noise of the detector and to eliminate Raman scattering bands.
To check for possible alterations of photophysical properties of porphyrins upon attaching to the nanoparticles, the quantum yields of H2TPP, ZnTPP, H2TPP-SiO2 and ZnTPP-SiO2 were measured with respect to H2TPP in benzene. The quantum yield of TPP in benzene (Φ = 9.7%) was determined using a solution of porphycene in n-hexane (Φ = 44% [34]). The measurements were performed for at least two excitation wavelengths in the Q-band area and the mean was taken as a final result. The uncertainties of quantum yield values were estimated as less than 20%. The scattering of silica was taken into account when determining the porphyrin absorption.
The excited state lifetime of porphyrins was measured using a home-built TC-SPC setup that consisted of a Picoquant LDH pulsed laser (379 nm, 100 ps pulse at 10 MHz repetition rate), Spectral Products Digikröm CM110 monochromator or Spectral Products Digikröm CM112 monochromator working in the subtractive mode, Becker&Hickl PMC 100-4 photomultiplier, and a PicoQuantTimeHarp 100 PC card with time resolution of approx. 38 ps per channel. The emission was collected at 605 nm and 650 nm for ZnTPP and H2TPP, respectively. The GG7 glass filter was used to block the scattered excitation at the monochromator entrance. The instrument response function was measured at the excitation wavelength using silica colloidal solution; the full width at half-maximum was around 0.4 ns. The fluorescence lifetimes were obtained through reconvolution of the decay histogram with the instrument response function using Fluofit 3.3 software (Picoquant) with the Levenberg-Marquardt algorithm, selecting a time window of about 20 ns and 80 ns for ZnTPP and H2TPP derivatives, respectively. The uncertainty of the measured lifetimes is approximately 0.1 ns. The fluorescence decay curves and the detailed reconvolution results are shown in figure S22 and tables S1 and S2 (supplementary information).
3. Results and discussion
3.1. Photophysics of H2TPP and ZnTPP attached to SiO2 nanoparticles
Photophysical studies of H2TPP and ZnTPP attached to SiO2 nanoparticles were carried out in order to check for possible changes in their photophysics. The emission spectrum and quantum yield value serve as input for the simulations, therefore it is important that they describe the simulated system as close as possible.
Comparative extinction and emission spectra are shown in figures S19–S20. The differences are rather small. Transitions in both chromophores shift to the red by a few nanometers upon attaching to SiO2 nanoparticles. Furthermore, for the bound ZnTPP the Q(0-0)/Q(1-0) absorption intensity ratio increased, which is also the case for the respective transitions visible in the emission spectra. In the case of bound H2TPP, the Qy (0-0)/Qx (1-0) is also somewhat higher. A minor increase in Qx (0-0)/Qx (1-0) peaks ratio in absorption and emission can be noticed as well. Table 1 summarizes the photophysical properties of the studied molecules in terms of their quantum yields and S1 lifetimes. Both quantities seem to be preserved upon introduction of the linker and binding the chromophores to the silica surface, as the obtained values are the same within the experimental uncertainty range.
Table 1. Summary of the photophysical properties of H2TPP and ZnTPP before and after attachment to SiO2 nanoparticles.
| Φ | τ / ns | Φ | τ / ns | ||
|---|---|---|---|---|---|
| TPP | 0.10 | 10.5 | ZnTPP | 0.036 | 1.9 |
| SiO2-TPP | 0.11 | 10.4 | SiO2-ZnTPP | 0.043 | 1.9 |
3.2. Numerical simulations
The results of the Mie theory simulations for Au@SiO2 nanoparticles as a function of gold radius and silica shell thickness and H2TPP/ZnTPP as chromophores are shown in figures S2–S12 (supplementary information).
Figures S2 and S3 present excitation enhancement. As can be inferred from the figures, the highest excitation enhancement operates only very close to gold surface. It aligns well with simple intuitive expectation where excited oscillating plasmons and the electric field generated by them do not extend very far beyond the nanoparticle surface.
Moreover, the longer is the chosen excitation wavelength, the bigger must the gold core be in order to provide the optimal enhancement. At the same time, due to the optical properties of gold, the maximum available enhancement for excitation at the Soret band (ca. 420 nm) is rather weak (ca. 2.4) compared to enhancement in the region of Q-bands (12–16). This stems from the Soret band energy lying outside the energy region of surface plasmon resonance in gold.
The radiative decay rate enhancement as a function of the nanoparticle parameters and the emission wavelength changes in a similar manner (figures not shown). Nonetheless, we present in figure S4 radiative decay rate enhancement for both chromophores averaged over their respective emission spectra. The radiative decay rate enhancement here can be viewed as a part of the total energy extracted by the nanoparticle from the excited chromophore that is radiated into the far-field. Not surprisingly, the emission from ZnTPP is best enhanced by smaller gold nanoparticles than in the case of H2TPP (46 nm and 52 nm, respectively) due to the former emitting at shorter wavelengths.
The shortening of the S1 state lifetime caused by the total energy transfer from the molecule to the nanoparticle is shown in figure S5. The total energy here means the energy that is both absorbed by the nanoparticle and radiated into the far-field. The fastest transfer of the energy from the excited chromophore to the nanoparticle, expressed as the highest shortening of the excited state lifetime, takes place for the molecule attached directly to the gold nanoparticle surface. The shortening of the excited state lifetime depends not only on the plasmonic nanostructure, distance, and chromophore emission energy, but also on the intrinsic nonradiative processes of the excited chromophore. Specifically, the more the nonradiative decay dominates over the radiative (low quantum yield), the lower will be the influence of the plasmonic structure on the excited state lifetime. This is because the electromagnetic field modifications of the chromophore surroundings introduced by the plasmonic structure alter only (at least at this level of considerations) transitions that involve the e-m field—here this is the electric dipole transition of emission. It explains the generally lower shortening of S1 lifetime for ZnTPP (with S1 lifetime of 1.9 ns) compared to H2TPP (with lifetime of 10.5 ns)—even though, considering exclusively the larger ZnTPP emission overlap with surface plasmon resonance of gold, the effect should be opposite.
Quantum efficiency enhancement (figure S6) reflects, on the other hand, the ratio of the enhancement of the radiative decay rate to the enhancement of the S1 decay rate (described above as shortening of the S1 state lifetime). As one can see, the simulation predicts that for the chromophores and transitions considered there exist sizes of gold core and silica shell that re-radiate into the far-field more energy than the gold core absorbs. The values providing the highest QY enhancement are rAu = 55 nm and dSiO2 = 9 nm for H2TPP and rAu = 49 nm and dSiO2 = 7 nm for ZnTPP.
Whether aiming at enhancing chromophore brightness or singlet oxygen production, an important parameter to consider is the S1 state population enhancement, which is depicted for H2TPP and ZnTPP in figures S7–S9. The S1 state population enhancement is dependent on excitation enhancement and S1 state lifetime reduction. By examining figures S8 and S9 it is apparent that for some combinations of gold and silica sizes the excitation enhancement exceeds the S1 state lifetime reduction. What is more interesting, considering peaks on maps in figures S8–S9, for a given excitation wavelength from the Q-band region there exist certain nanoparticles best for S1 population enhancement, and therefore for the enhancement of triplet formation rate. For instance, at 600 nm excitation, the highest enhancement of the S1 state is predicted to be 4.3 for the nanoparticles of rAu = 42 nm and dSiO2 = 8 nm for H2TPP and 5.3 for the nanoparticles of rAu = 43 nm and dSiO2 = 7 nm for ZnTPP.
The parameter that we consider the most important in this study, as we used it as a key indicator for choosing the parameters of the nanoparticles to be synthesized, is the enhancement of the molecule brightness (figure 2 and S10–S12). It can be viewed, interchangeably, either as the product of excitation enhancement and quantum efficiency enhancement or as the product of S1 state population enhancement and radiative decay rate enhancement. The optimal gold core and silica shell sizes depend on the excitation wavelength. While for the Soret band excitation the maximum available enhancement is rather moderate, for the Q-band excitation the brightness enhancement can be as large as 43 for rAu = 45 nm and dSiO2 = 5 nm in the case of ZnTPP.
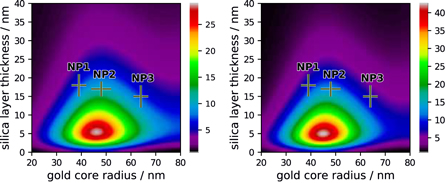
Figure 2. Simulated enhancement of the apparent brightness of the S1 state emission for H2TPP (left) and ZnTPP (right) excited at 600 nm attached to Au@SiO2 nanoparticles of different core radii and silica shell thicknesses.
Download figure:
Standard image High-resolution imageAs can be seen in figures S6 and S8–S12, the maximum values for the quantum efficiency enhancement, the S1 state population enhancement, and the enhancement of total brightness occur at a few nanometers distance from the gold nanoparticle surface. The reason for this are the different properties and distance-dependent distribution of the gold nanoparticle surface plasmon modes. The higher order modes, of which quadrupolar is the strongest, have a shorter range than the dipolar mode, which, contrary to the former, readily interacts with light and can radiate the energy into the far-field (or interact with the incoming radiation). Therefore, the closer to the surface, the more energy is (additionally to losses of the dipolar mode) absorbed by the higher order modes.
3.3. Characterization of AuSiO2 nanoparticles
The choice of the nanoparticles to be synthesized was made based on the results of the simulations. The selected gold core radii were between 30 and 70 nm, as the radii of these sizes should provide highest enhancement of emission brightness for the investigated excitation wavelengths. With the placement of chromophores close to the gold nanoparticle surface, two possibilities were analyzed: either using the linker or a coating shell. It has been demonstrated how placing porphyrin on gold surface changes its photophysics [35–39]. Emission intensity is significantly lowered and fluorescence lifetime shortens. Considering the above, the linker would have to be of appropriate length (approx. 5 nm) and would need to be rigid enough so that the porphyrin emission is not quenched by gold too strongly to be observable. Moreover, the distance from 0 to approx. 5 nm from the gold nanoparticle surface is the zone of the highest changes of enhancement factors with distance, where small deviations (e.g., resulting from conformational changes in the linker) in the separation length could lead to large changes in the measured values. Therefore, we decided to try the coating shell approach with silica as a safer option.
The synthesized nanoparticles were characterized using electron microscopy. The selected images are presented in figures S16–S18. The sizes measured on the basis of SEM images are shown in figure 3.
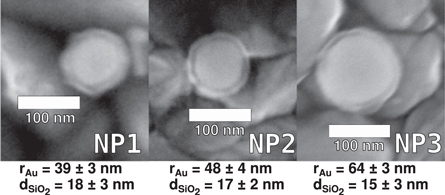
Figure 3. SEM images of Au@SiO2 nanoparticles. At the bottom, for each nanoparticle type, its gold radius and silica shell thickness are presented.
Download figure:
Standard image High-resolution imageWe were not able to obtain the optimal calculated chromophore-gold distances of approx. 5 nm, as for the gold core sizes investigated the minimum silica shell thickness to obtain colloidally stable nanoparticles is about 10 nm. However, we think we are reasonably close with distances ranging from 15 to 18 nm. At these distances, the predicted influence of gold on the photophysics of chromophores is still significant. The similar values of silica shell thickness allow analyzing the experimental results as a function of gold core size.
The experimental and calculated extinction spectra of the colloidal DMF solutions of the nanoparticles synthesized and functionalized with H2TPP are shown in figure 4. Due to low number of porphyrins on the nanoparticles surface, their absorption bands are not visible in the extinction spectra.
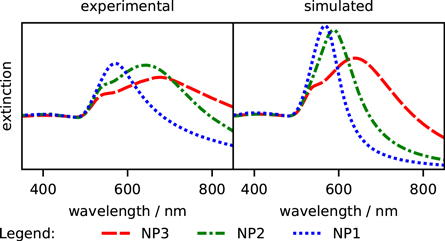
Figure 4. Experimental and simulated (Mie theory) extinction spectra of the Au@SiO2 nanoparticles.
Download figure:
Standard image High-resolution imageHowever, the spectra still provide many useful information about the Au@SiO2 nanoparticles. Further information can be extracted by comparison of the experimental spectra with the simulated ones, which for gold, within the used level of theory, are expected to model the experimental data very accurately [40, 41].
The spectra show that the general, gold-size dependent features are preserved. Namely, the bigger the gold nanoparticle, the more red-shifted is the dipolar band of localized surface plasmon resonance (LSPR). The LSPR extinction band manifests the interaction of a gold nanoparticle with light and its strength, shape, and position can serve as a first estimate of the relative wavelength-dependent excitation and emission enhancements. However, it is important to point out that the energy of maximum electromagnetic field enhancement in such systems is typically red-shifted with respect to the extinction peak position of LSPR, which has been investigated theoretically (e.g.: [42]) and observed in experiments (e.g.: [43]).
The experimental LSPR bands in figure 4 are broadened and red-shifted compared to the simulations. The broadening is accompanied by lowering of their maximum values with respect to the extinction at 450 nm which depends on Au0 concentration and not on the nanoparticle size or shape [44]. Therefore, one can expect lower enhancements with maxima more red-shifted than modeled by simulating an ideal system.
The extent of the deviations of experimental extinction spectra from theoretical ones, larger than could supposedly be created by the sample inhomogeneity, seems to indicate the slight aggregation of the nanoparticles, especially NP2 and NP1. The comparison of the Au@SiO2 nanoparticles extinction spectra monitored after each step of the synthesis suggests that the aggregation took place during the post-silica coating step work-up. It has to be noted that no broadening was observed upon functionalization with porphyrin nor upon storing the functionalized nanoparticles in DMF solution during the course of this research.
3.4. Near-field effects in the excitation spectra of porphyrins
Excitation spectra reflect the interaction of the chromophore with the incoming radiation. As can be seen in figure 5, the presence of a metallic nanoparticle modifies the excitation rate of porphyrins depending on the wavelength. With the current experimental conditions and optical properties of solutions hardly exhibiting porphyrin contribution in the extinction spectra (figure 4), we cannot extract the absolute values of the excitation enhancement/reduction, thus the presented extinction spectra are normalized to the intensity of the strongest transition, i.e., the Soret band (approx. 420 nm) where, additionally, enhancement values are expected be close to 1 and almost equal (figure S13, left).
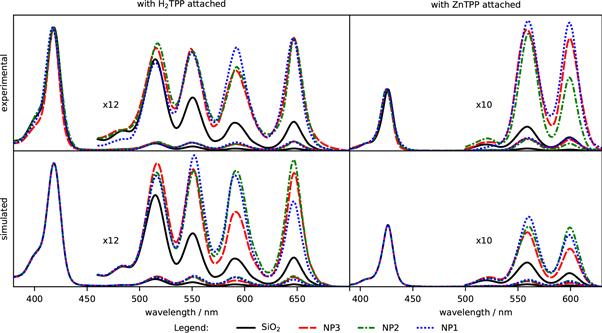
Figure 5. Excitation spectra, normalized to the Soret band intensity.
Download figure:
Standard image High-resolution imageThe excitation spectra of porphyrins attached to Au@SiO2 nanoparticles (top row in figure 5) exhibit an increased excitation rate in the Q-band region compared to porphyrins attached to SiO2 nanoparticles without the gold core. These wavelengths (ca 500–650 nm) overlap with plasmonic resonance of Au nanoparticles responsible for the enhancement. The plasmons excited at their resonance frequencies create strong electromagnetic field near the surface of the nanoparticles which is felt by the chromophore as the increased light intensity. A very demonstrative, but at the same time correct term to explain the phenomenon is the antenna effect.
Mie theory and other classical simulations of the electromagnetic field around the nanoparticle with the use of kinetic equations for the chromophore electronic states populations have been already numerous times proven to be effective and reliable [1, 45–47]. The simulated excitation spectra for both H2TPP and ZnTPP attached to Au@SiO2 nanoparticles are presented in the bottom row in figure 5. The simulations explain the general trend of Q-band excitation rates being more enhanced than the Soret band excitation rates. However, the simulation differs somewhat from the experiment at around 570–670 nm for both chromophores.
In particular, by analyzing the experimental spectra for both H2TPP and ZnTPP, it is apparent that the excitation enhancement for NP1 is slightly higher than predicted for the whole concerned region and the enhancement for NP2 nanoparticles is lower at around 600 nm.
With the 500–570 nm region being rather in line with simulations and larger discrepancies appearing for longer wavelengths, we hypothesize that it is the NP1 and NP2 samples partial aggregation that causes the effect.
For NP1, sample aggregation would, i.a., strongly boost the scattering part of its extinction spectrum and hence the excitation enhancement in the red (>570 nm) in comparison to the green and blue. Furthermore, NP2 aggregation would decrease the intensity and red-shift its plasmon resonance band that is located at around 600 nm. Finally, NP1 and NP2 sample aggregation can be inferred from their respective extinction spectra shown in figure 4, where their surface plasmon resonance bands are broadened and red-shifted compared to the simulation.
Our calculations do not take into account the effect of the sample aggregation (which is beyond our computational methodology), nevertheless it is tempting to hypotesize about the possible excitation enhancement curves given the differences between theoretical and experimental LSPR peak breadths and positions in the extinction spectra in figure 4. The theoretical enhancement curves for aggregated samples should have the maxima red-shifted with respect to what is shown in figure S13 (left) with the enhancements below approx. 550 nm not much affected (similarly to the tendency with increasing gold core radii in figure S13, left). This would lower the Q-bands enhancement (with respect to the Soret band) for all Au@SiO2 types.
Since the maximum enhancement for NP3 samples is already outside the Q-band region, there should be no significant changes in the relative Q-band intensities, which in fact can be observed in figure 5 for both H2TPP and ZnTPP. The red-shift of the excitation enhancement in the aggregated NP2 sample will result in the 650 nm band being more enhanced and the 600 nm band being less enhanced to what simulation predicts, what is also noticeable in the experimental spectra. NP1 does not seem to have the extinction LSPR maximum shifted, however the red part of the spectrum above the 650 nm is elevated. It can be assumed from the calculated enhancement curve with the peak at about 600 nm that the region to the red will be generally more enhanced than in the calculation. This can be the reason for NP1-H2TPP and NP1-ZnTPP approx. 650 nm bands being higher than calculated.
For zinc porphyrin, the simulations correctly predict the enhancement of Q band absorption, but underestimate the effect: the experimental values are about two times stronger than the predicted ones.
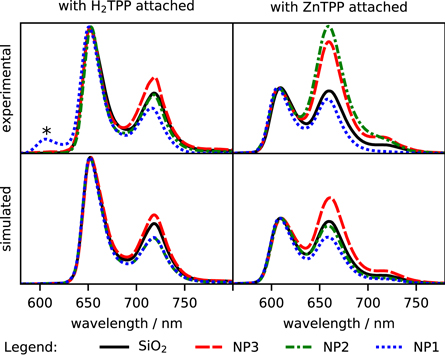
3.5. Changes in the porphyrins S1 state properties
Changes in the porphyrin fluorescence lifetime (table 2) and the modified emission spectra (figure 6) manifest the changes in the radiative decay of the S1 state of the chromophores. All of the lifetimes determined for porphyrins attached to Au@SiO2 are shorter than those where nanoparticle does not contain gold. Visible changes are also observed for the relative intensities of emission vibronic bands.
Figure 6. Emission spectra, normalized. The band marked with '*' at about 602 nm on NP1-H2TPP emission spectrum most probably originates from protonated porphyrin aggregates [48–50].
Download figure:
Standard image High-resolution image
Table 2. Experimental and calculated excited state lifetime reduction factors for porphyrins on Au@SiO2 nanoparticles.
| H2TPPexp | H2TPPsim | ZnTPPexp | ZnTPPsim | |
|---|---|---|---|---|
| SiO2 | 1 | 1 | 1 | 1 |
| NP1 | 0.79 | 0.85 | 0.86 | 0.91 |
| NP2 | 0.78 | 0.78 | 0.85 | 0.88 |
| NP3 | 0.76 | 0.76 | 0.75 | 0.89 |
As discussed before, in terms of classical electrodynamics the interaction of an excited molecule with a plasmonic nanoparticle can be explained by the antenna effect. This time, however, the excited molecule, whose emission frequencies are close to the LSPR of gold nanoparticles, as in the case of H2TPP i ZnTPP, is the source of radiation and the general energy flow is outward, into the far field. The rates of energy transfer from the molecule to the nanoparticle and from the nanoparticle to the far-field are wavelength-dependent, which leads to the changes in the emission spectra shape.
Moreover, a gold nanoparticle is a lossy resonator and therefore some of the dipole emission is absorbed. The total effect of increased energy extraction from the dipole manifests itself in the shortening of fluorescence decay times. The quantum explanation of the reduced lifetimes is via Purcell effect. Specifically, the presence of the nanoparticle alters the electromagnetic surrounding of the chromophore by providing increased density of final states for the emitted photon.
Again, there are some differences between the shapes of the experimental and simulated emission spectra. The largest deviations were observed for NP2 nanoparticles, where the red-side emission band is higher than predicted by simulations in both (H2TPP and ZnTPP) cases. The differences can be explained by NP2 aggregation—leading to broadening and shifting the surface plasmon resonance peak from ca 600 nm to the red, which we believe is responsible for the especially considerable discrepancy between the 600 nm and 650 nm band in ZnTPP.
Likewise in the case of excitation spectra, the most probable changes in the theoretical emission enhancement curve in figure S13 (right) due to nanoparticles aggregation can explain the changes observed experimentally. The further shift of emission enhancement from NP3 into the red would further increase the enhancements for long wavelengths compared to shorter wavelengths. Such an increase, although not very significant, can be seen in the experimental emission spectra (figure 6, upper row). Similar effects should take place for NP2 sample, however, here the aggregation would shift the narrower peak in the emission enhancement curve (figure S13, right) from about 600 nm to longer wavelengths, thus notably increasing relative enhancement at longer wavelengths with respect to ca 600 nm. This could explain the apparently large differences in the approx. 650 nm to approx. 600 nm for Au@SiO2-ZnTPP. For NP1 samples, besides the increase for the region above 600 nm, no considerable relative differences in the enhancement curves could be expected, judging from the extinction spectra (figure 4) and simulated emission enhancement (figure S13, right). Not surprisingly, the experimental spectra for Au@SiO2-H2TPP match quite well the simulated ones and for Au@SiO2-ZnTPP a minor difference in enhancement being higher for approx. 650 nm than for approx. 600 nm can be observed.
The shortening of excited state lifetimes, although not being perfectly in line with the simulation, exhibits relatively small (<15%) deviations from the calculated values. The measured excited state lifetime is less prone to suffer from slight aggregation of the nanoparticles, as this parameter reflects the extraction of energy from the excited chromophore in the whole range of its emission spectrum.
4. Summary and conclusions
The presented research concerns the photophysical properties of H2TPP and ZnTPP attached to Au@SiO2 nanoparticles of three different gold core sizes. We have shown that in the close vicinity (17–20 nm) of a nanoparticle, the porphyrins S1 lifetimes shorten and their excitation and emission spectra change—the Q bands in the green-red region are enhanced with respect to the Soret band in the blue. The observations are different for each set of nanoparticles with gold core radii of 39, 49, and 64 nm, indicating a gold core size dependence on the results.
The experimental findings can be explained almost quantitatively with a classical electromagnetic simulations, where the e-m field is calculated on the basis of Mie theory with transfer matrix method and the chromophore in the excited state is represented as an oscillating dipole. In this model, the excitation enhancement comes from the increased e-m field of the incoming radiation. The calculations correctly predict highest excitation enhancement around the Q bands wavelengths, which also coincide spectrally with the surface plasmon resonance of gold that creates the e-m field enhancement near the surface of gold. A similar effect can be noted for emission, although here the effect is caused by the increased energy transfer from the oscillating dipole to the nanoparticle. This leads to shortened S1 lifetimes that have likewise been observed experimentally. The transferred energy can be either absorbed by the nanoparticles or emitted into the far-field. The process is wavelength-dependent and explains the altered shape of the emission spectra in the investigated porphyrins.
The electromagnetic properties of plasmonic nanoparticles are very sensitive to aggregation. Even though our three sets of gold nanoparticles have shells of 15–18 nm, slight aggregation was still observed in the extinction spectra, as deduced from the comparison with simulations that are widely considered as reliable. The aggregation seems to contribute to the discrepancies between all of the predicted and measured values and, in particular, the tendency of red parts of the spectra being more enhanced than anticipated.
The approach used in this study, starting from simulations followed by experimental verification of theoretical predictions can readily be extended to other chromophoric systems. We believe it can be generally applied for a rational design of new chromophoric systems with desired and tunable spectral and photophysical properties.
Acknowledgments
We thank Anna Żelichowska for her help with the nanoparticles synthesis and characterization. A.K. acknowledges the support of the National Science Centre, Poland, within the grant Preludium 10 no 2015/19/N/ST4/03827. The work of A.S.-I. was performed under the Maria de Maeztu Units of Excellence Programme—Grant No. MDM-2017-0720 Ministry of Science, Innovation and Universities. The authors have declared that no competing interests exist.
Data availability statement
The data that support the findings of this study are available upon reasonable request from the authors.