


ABSTRACT
We report Hubble Space Telescope images of Jupiter during the aftermath of an impact by an unknown object in 2009 July. The 2009 impact-created debris field evolved more slowly than those created in 1994 by the collision of the tidally disrupted comet D/Shoemaker-Levy 9 (SL9). The slower evolution, in conjunction with the isolated nature of this single impact, permits a more detailed assessment of the altitudes and meridional motion of the debris than was possible with SL9. The color of the 2009 debris was markedly similar to that seen in 1994, thus this dark debris is likely to be Jovian material that is highly thermally processed. The 2009 impact site differed from the 1994 SL9 sites in UV morphology and contrast lifetime; both are suggestive of the impacting body being asteroidal rather than cometary. Transport of the 2009 Jovian debris as imaged by Hubble shared similarities with transport of volcanic aerosols in Earth's atmosphere after major eruptions.
Export citation and abstract BibTeX RIS
1. INTRODUCTION
On 2009 July 19, a body of unknown provenance collided with the planet Jupiter (Sánchez-Lavega et al. 2010). The collision itself was not recorded, but within hours an amateur astronomer had spotted an anomalous feature, and infrared observations soon thereafter confirmed the feature was exogenic. On the day following the 2009 impact, we requested—and were awarded—five orbits of Hubble Space Telescope Director's Discretionary Time to observe the aftermath of the impact. The observations faced serious constraints because the telescope was in the middle of the Servicing Mission Observatory Verification following Servicing Mission 4; in fact, these Hubble observations were the first science data taken with the new Wide Field Camera 3 (Wong et al. 2010).
This 2009 event occurred exactly 15 years after the fragments of the tidally disrupted comet D/Shoemaker-Levy 9 (SL9) collided with Jupiter during the week of 1994 July 16–23, an event observed by hundreds of telescopes, including the Hubble Space Telescope (Hammel et al. 1995; West et al. 1995; Clarke et al. 1995; Noll et al. 1995). (Historical footnote: Hubble images of SL9 itself were among the first images taken after the 1993 Hubble Servicing Mission 1, using the newly installed Wide Field Planetary Camera 2.) A comprehensive overview of the 1994 event was presented in Harrington et al. (2004) and references therein. By directly comparing these data with the prior Hubble impact observations, we can separate those characteristics general to Jovian impacts from those unique to the specific impacting body.
2. OBSERVATIONS AND PHOTOMETRY
The 2009 observations, consisting of visible and ultraviolet imaging, were mainly acquired between July 23 and August 8. The full set of Hubble observations is summarized in Table 1. In the first four orbits, images were obtained with the Wide Field Camera 3. A fifth orbit obtained 51 days after the impact consisted of UV images taken with the Solar Blind Channel of the Advanced Camera for Surveys.
Table 1. Hubble Observing Log
| Instrument/Filtera | Exposure | λb | δλb | 2009 UT Date | ||||
|---|---|---|---|---|---|---|---|---|
| Name | (s) | (Å) | (Å) | Jul 23 | Jul 23 | Aug 3 | Aug 8 | Sep 8 |
| ACS/F125LP | 2000 | 1250 | Longpass | 02:18:02 | ||||
| WFC3/F225W | 100 | 2341.0 | 547.3 | 18:12:25 | 13:06:22 | |||
| WFC3/F275W | 30 | 2715.3 | 480.8 | 19:44:38 | 22:31:13 | |||
| WFC3/FQ378N | 12 | 3790.9 | 89.2 | 18:19:20 | 19:50:20 | 13:13:12 | 22:36:50 | |
| WFC3/FQ437N | 15 | 4370.6 | 24.6 | 18:23:42 | 19:54:42 | 13:17:04 | 22:40:42 | |
| WFC3/FQ508N | 2 | 5089.7 | 117.9 | 18:31:13 | 20:02:13 | 13:25:12 | 22:48:50 | |
| WFC3/FQ634N | 4 | 6347.5 | 66.2 | 18:35:48 | 20:16:33 | 13:28:25 | 22:52:03 | |
| WFC3/FQ727N | 8 | 7274.7 | 64.8 | 18:56:49 | 20:27:49 | 13:06:22 | 23:12:58 | |
| WFC3/FQ889N | 40 | 8891.8 | 93.7 | 18:27:12 | 19:58:12 | 13:20:34 | 22:44:12 | |
| WFC3/FQ906N | 15 | 9056.7 | 94.0 | 18:39:01 | 20:19:46 | 13:33:08 | 23:04:56 | |
| WFC3/FQ924N | 12 | 9246.3 | 89.2 | 18:53:11 | 20:24:11 | 13:47:25 | 23:08:26 | |
Notes. aACS = Advanced Camera for Surveys; WFC3 = Wide Field Camera 3. bλ is the effective wavelength and δλ is the bandpass, based on integrated system throughputs measured during the Servicing Mission Observatory Verification. Filter characteristics are from Table 6.2 of the WFC3 Instrument Handbook (Wong et al. 2010) except for those of the longpass filter F125LP, which came from Figure 10.109 of the ACS Instrument Handbook (Maybhate et al. 2010).
Download table as: ASCIITypeset image
The impact occurred near planetographic latitude 58.5°S (planetocentric 55°S) and System III west longitude 305°. In our first visible-wavelength Hubble images taken 4 days after impact, the expanding impact site already subtended 2800 km in latitude and 6000 km in longitude. Jovian winds had spread the material into an extended source (Figure 1); meridional (i.e., north–south) transport by vortex motion accelerated this process, as discussed further below.

Figure 1. Hubble images showing temporal evolution of the 2009 impact site. (a) Each column in this 3 × 3 panel shows a different representative wavelength: blue (378 nm), orange (634 nm), and the near infrared (889 nm); full observational log presented in Table 1. The feature appears bright in the 889 nm images because strong methane absorption at that wavelength severely darkens the planet (Figure 2). In the top row (2009 July 23), the characteristic ejecta fan lies to the Jovian northwest (above and to the left of the dark site). In the middle and bottom rows showing August 3 and 8, respectively, Jovian winds acting on the main impact-generated debris clouds disperse the evolving clumps as discussed in the text.
Download figure:
Standard image High-resolution imageIn the July 23 images (Figure 1, top row), a faint ballistic ejecta field—a "crescent" in the terminology of Harrington et al. 2004—was still detectable to the Jovian northwest (upper left) of the main dark feature (termed a "streak" by Harrington et al. 2004). The fact that the crescent was seen at all provides a constraint on the impactor size, assuming the terminal velocity of this impactor was similar to that of SL9 fragments. The size and morphology of this 2009 crescent resembled SL9 impact sites E or R as seen by Hubble, i.e., initial site size between 4000 and 8000 km (Hammel 1996). For SL9, ejecta field sizes correlated with impactor size based on post-impact models of the impact light curves seen by the Galileo spacecraft: fragments E and R were probably 500–700 m in diameter (Crawford 1997). We thus estimated a similar size for the 2009 pre-impact body, consistent with Sánchez-Lavega et al. (2010). Lack of impact light curves for the 2009 event likely precludes a more refined estimate of the impactor size.
Photometry of the 2009 impact-generated material showed it to be exceedingly dark and neutral in color (Figure 2), similar to the color seen for the SL9 debris. For SL9, detailed analysis of the optical properties of the dark material suggested the bulk of the debris was of Jovian origin (West et al. 1995). The similarity of the color indicates that the bulk of the 2009 debris was likewise highly thermally processed Jovian material. Studies of clouds associated with lightning strikes on Saturn reveal unusually dark clouds throughout the visual and near-infrared spectral region, which have been interpreted as lightning-induced chemical reactions (Baines et al. 2009); the high temperatures experienced in the Jovian impacts may drive analogous pyrolytic processes. Similar material may darken exoplanet atmospheres heated by proximity to their central stars (Zahnle et al. 2010); high-altitude hazes have been inferred for the atmosphere of HD 189733b (Pont et al. 2008).
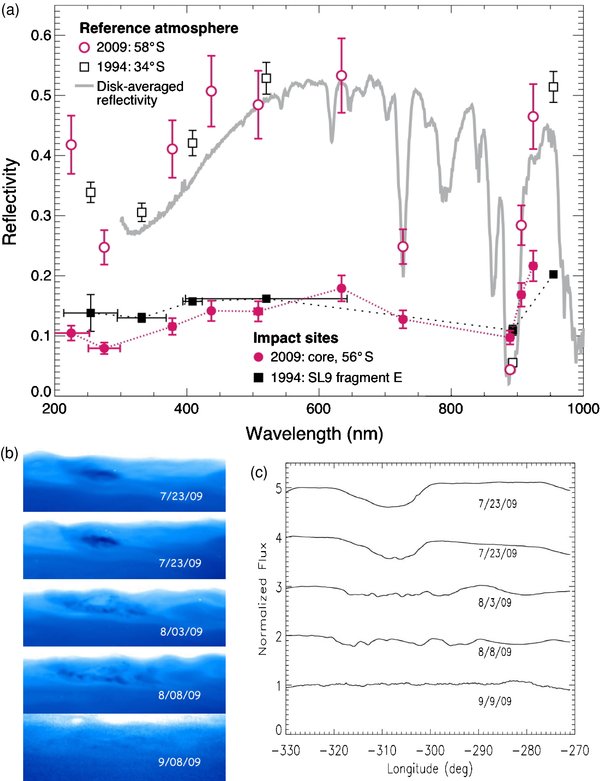
Figure 2. Hubble colors and UV data. (a) Hubble images yielded reflectivity spectra for both the 2009 impact site (filled circles) and SL9 fragment E from the 1994 impacts (filled squares). For reference, we show also the undisturbed Jovian atmosphere in 2009 (open circles) and 1994 (open squares), as well as Jupiter's disk-averaged albedo spectrum in gray (Karkoschka 1994). Horizontal error bars show filter spectral widths. The ejecta spectrum is very dark and very flat; the site appears bright at 889 nm only because the atmosphere there is extremely dark due to methane absorption. (b) In 2009, Hubble ultraviolet images showed an initial appearance and evolution that appear qualitatively similar to those seen in the visible and near infrared, unlike ultraviolet images of SL9 sites: in 1994 the Hubble ultraviolet images showed broad halos surrounding the impact sites (Clarke et al. 1995); such haloes were not seen in visible images (Hammel et al. 1995). (c) The UV contrast in Hubble ultraviolet images faded rapidly, again unlike what was seen for SL9 sites where contrast remained high for weeks after impact (Clarke et al. 1995).
Download figure:
Standard image High-resolution image3. IMPACT-GENERATED DEBRIS ALTITUDES
We used the Hubble data to estimate the vertical distribution of the impact-generated debris with two different methods. The wavelength-dependent contrast of the debris relative to the planet, especially at wavelengths sensitive to absorption by methane, provided a crude constraint on altitude. From the relative reflectance of the debris field compared with the unperturbed atmosphere in the 889 nm methane-band filter, we estimated the material must be above the few-hundred-mbar pressure level.
Alternatively, Hubble's high spatial resolution permitted extraction of detailed motions of the material, and by coupling that motion with the known local wind speeds and a model of vertical wind shear, we quantitatively assessed the debris altitude. Figure 3(a) shows an image with wind vectors, along with a comparison in Figure 3(b) between these winds and several Jovian zonal wind profiles. (The Jovian zonal wind profile varies with time; see, e.g., García-Melendo & Sánchez-Lavega 2001 or Simon 1999.) The Hubble velocities are consistent with those determined from ground-based data with lower spatial resolution taken over timescales of days to weeks (A. Sánchez-Lavega et al. 2010b, in preparation).

Figure 3. Hubble measurements of the debris motion and altitudes after the 2009 impact. (a) Wind vectors indicate the direction and magnitude of motions measured for specific debris clumps between August 3 (shown here) and 8 (see the bottom row of Figure 1). The initial impact site is marked with a blue circle. The inset shows the length for 10 m s−1; uncertainties, shown on the datum at latitude 60.5°S, are identical for each measurement. (b) Zonal velocities for the debris wind vectors in (a) are plotted as a function of planetographic latitude along with two different measurements of the local zonal winds: the dashed line is unpublished Hubble data from 2007 (A. Sánchez-Lavega et al. 2010a, in preparation); the solid line is Cassini spacecraft data (Porco et al. 2003). The location of the initial impact site is shown with a star. (c) For each debris measurement, we extrapolated the Cassini Jovian zonal wind profile at that planetographic latitude (solid line in (b)) to higher altitudes using the thermal wind equation, and identified the altitude (expressed here as pressure in mbar) where the extrapolated wind velocity matched the observed debris velocity shown in (b). The point at latitude 61°S was the "edge" of a feature rather than a discrete clump, which perhaps accounts for its anomalous altitude.
Download figure:
Standard image High-resolution imageWe used the thermal wind equation to extrapolate upward from the Jovian cloud-top zonal wind profile as measured by the Cassini spacecraft (Porco et al. 2003; we used the Cassini profile because of its higher spatial fidelity); zonal mean pressure–temperature profiles for the 40°S–70°S latitude range were determined from thermal imaging of Jupiter on July 24 (Orton et al. 2010). We then identified the altitudes at which the measured debris velocity matched the extrapolated thermal wind velocity. The debris altitudes thus identified (Figure 3(c))—ranging from 300 mbar near the impact site to tens of mbars for the more extended debris—were consistent with altitudes for the impact debris derived independently from near-infrared and thermal measurements (Orton et al. 2010; de Pater et al. 2010).
4. RADIATIVE TRANSFER MODELING
We performed radiative transfer modeling to derive characteristics of the particulates and derive an initial self-consistent aerosol model for the dark material. The model, following Barrado-Izagirre et al. (2009), includes scattering and absorption by gas (H2, He, and CH4) and has three layers: a stratospheric haze with spherical particles for which we vary optical thickness, a tropospheric haze, and a deeper physically thin cloud with isotropic scattering.
The following parameters describe the stratospheric haze: pressures P1 (top) and P2 (bottom); real and imaginary refractive indices, mr1 and mi1, for spherical particles; a size distribution described by a1 and b1; and optical thickness τ1. Similar parameters describe the tropospheric haze (P3, P4, mr2, mi2, a2, b2, τ2). The lowest cloud is physically thin and has isotropic scattering, with total aerosol optical thickness τ3. We determined the best-fitting atmospheric parameters for the "reference atmosphere" (i.e., at the impact latitude but at longitudes away from the impact site) and the "impact core" (i.e., the impact location as seen on July 23), for the absolute reflectivity as well as the observed center-to-limb variations.
Figure 4 shows the model results: the debris reflectivities in the Hubble images were best fit with a wavelength-dependent decrease of the aerosol optical thickness of a thin layer in the stratosphere, as well as wavelength-dependent changes in the single-scattering albedos and imaginary indices of the absorbing particles. The work does not represent an exhaustive analysis of free parameter space, but rather a preliminary search for a self-consistent vertical cloud structure model. Detailed comparison with ground-based data at longer wavelengths will further constrain such models, but to first order these trends were in agreement with similar parameters determined for the SL9 events (West et al. 1995).

Figure 4. Results from radiative-transfer models of Hubble images of the 2009 impact site. The wavelength dependence of the parameters in the figure (optical depth τ, imaginary index mi, and single-scattering albedo ϖo) represents best-fit models to the reflectivity and center-to-limb variations of the dark impact site for each Hubble filter on 2009 July 23.
Download figure:
Standard image High-resolution image
5. DIFFERENCES FROM SL9
Notable differences between the 2009 impact and the SL9 event emerged, however, in Hubble ultraviolet observations. Such images (Figure 2(b)) have the highest sensitivity to weakly absorbing particles; in addition, the shortest UV wavelengths sense particles higher in the atmosphere. Spatially extended UV-dark halos were seen around SL9 impact sites lasting for at least 11 days (Clarke et al. 1995). In 2009, the initial imaging data show more slightly extended UV absorption relative to longer wavelengths, but no UV halo was visible in later images. The SL9 impactors were known to have comae, and impacting coma material may have directly caused the extended UV absorption at the SL9 impact sites. The lack of similar extended UV absorption in 2009 is thus consistent with a coma-free impactor.
SL9 impact sites showed a northern expansion in the days following the impact (Clarke et al. 1995) possibly due to enhanced eddy diffusion or winds driven by auroral heating (Friedson et al. 1999). Such northern expansion did not appear in the 2009 impact images (Figure 2(b)). Furthermore, the UV contrast diminished much more quickly than was seen for similar-sized SL9 impact sites (Figure 2(c)), e.g., that of the E fragment (Clarke et al. 1995).
The lack of northward drift of the debris field and its rapid loss of UV contrast could indicate a difference in individual particle masses between the SL9 and 2009 events: both phenomena are consistent with particles precipitating more rapidly than occurred for the SL9 impacts of comparable size. Heavier particles might be consistent with material that is more asteroidal than cometary in origin (see also Orton et al. 2010). Yet the bulk of the detected SL9 debris was thought to be of Jovian origin (West et al. 1995), and the similarity of 2009 spectral data to that of SL9 argues likewise for the recent impact. It would thus be unexpected for the debris itself to be heavier in 2009. Alternatively (or additionally), weaker vertical mixing by turbulent diffusion at the 2009 impact site relative to conditions at the SL9 impact latitude could have contributed to the faster fall-out with respect to the SL9 impact events. A detailed study with coupled chemical, dynamical, and microphysical models will help distinguish between these possibilities.
The high spatial resolution of these Hubble Jupiter impact images can reveal the influence of dynamical processes common to the atmospheres of both Jupiter and Earth. The transport of impact-generated debris from this transient Jovian event bore interesting similarities to the transport of material in Earth's stratosphere following the eruption of Mt. Pinatubo in 1991. In that event, stratospheric aerosols were created from SO2 gas emitted by the volcano. The NOAA/11 satellite resolved clumps in the aerosol layer with scales of 100–2000 km several weeks after the eruption, and these inhomogeneities did not mix longitudinally despite being transported around the equator (Stowe et al. 1992). Clumps of the Jovian debris similarly measured 150–1000 km and remained coherent over timescales of weeks (Figure 1).
Meridional transport of Mt. Pinatubo's aerosols was controlled by planetary waves and anticyclonic vortices (Trepte et al. 1993) and by absorption of long-wave radiation from below (Young et al. 1994). In Jupiter's case, stratospheric eddies may also have controlled aerosol transport, although heating was caused by the impact rather than by sustained absorption of thermal radiation. The Jovian eddies, whether pre-existing or generated by the impact energy impulse, confined the debris and slowed its dissipation.
Assuming these Jovian eddies were approximately geostrophic, rather than cyclostrophic like dust devils, their internal velocities are limited by the constraint that the Rossby number Ro be less than 1 (see Kundu 1990), i.e., Ro = v/(L f) < 1, where v is the characteristic flow velocity, L is the length scale of the vortices (150–1000 km), and f is the Coriolis parameter (3.0 × 10⁻⁴ s−1 at the latitude of the impact site). For these conditions, geostrophic velocities would be significantly less than 45–300 m s−1.
Although the spatial resolution precluded our ability to measure velocities within the clumps, the primary limitation on using the clumps themselves to trace stratospheric winds was that the 2009 impact occurred during Hubble's Observatory Verification period, thus we could not optimally schedule the observational cadence. If Jovian impacts are more frequent than had been assumed (Sánchez-Lavega et al. 2010), and quick-response observations can be obtained with adequate spatial resolution as shown in this Letter, then Jupiter can serve as an independent laboratory for stratospheric atmospheric phenomena occurring on both Jupiter and Earth.
This Letter is based on observations made with the NASA/ESA Hubble Space Telescope, obtained at the Space Telescope Science Institute (STScI), which is operated by the Association of Universities for Research in Astronomy Inc. under NASA contract NAS 5-26555. Analyses of these data from programs GO-12003 and GO-12045 were supported by STScI under the associated research grants. We commend and thank the STSCI staff and management for their fortitude during these unusually challenging observations. L.N.F. was supported by an appointment to the NASA Postdoctoral Program at the Jet Propulsion Laboratory (California Institute of Technology, Pasadena, CA).