
Abstract
Engineered myogenic microtissues derived from human skeletal myoblasts offer unique opportunities for varying skeletal muscle tissue engineering applications, such as in vitro drug-testing and disease modelling. However, more complex models require the incorporation of vascular structures, which remains to be challenging. In this study, myogenic spheroids were generated using a high-throughput, non-adhesive micropatterned surface. Since monoculture spheroids containing human skeletal myoblasts were unable to remain their integrity, co-culture spheroids combining human skeletal myoblasts and human adipose-derived stem cells were created. When using the optimal ratio, uniform and viable spheroids with enhanced myogenic properties were achieved. Applying a pre-vascularization strategy, through addition of endothelial cells, resulted in the formation of spheroids containing capillary-like networks, lumina and collagen in the extracellular matrix, whilst retaining myogenicity. Moreover, sprouting of endothelial cells from the spheroids when encapsulated in fibrin was allowed. The possibility of spheroids, from different maturation stages, to assemble into a more large construct was proven by doublet fusion experiments. The relevance of using three-dimensional microtissues with tissue-specific microarchitecture and increased complexity, together with the high-throughput generation approach, makes the generated spheroids a suitable tool for in vitro drug-testing and human disease modeling.
Export citation and abstract BibTeX RIS

Original content from this work may be used under the terms of the Creative Commons Attribution 4.0 license. Any further distribution of this work must maintain attribution to the author(s) and the title of the work, journal citation and DOI.
1. Introduction
Skeletal muscle tissue represents approximately 45% of the total body weight of the human body. It is involved in a variety of processes and has several functions, such as facilitating skeletal support, maintaining stability and operating contractile events [1]. The contractile functions of skeletal muscle tissue are made possible by its distinctive microscopic morphology, with cylindrical and aligned multinucleated myofibers serving as the tissue's functional units. During embryogenesis, myofibers are established when mononucleated myogenic progenitor cells fuse into immature multinucleated myotubes. Postnatally, these cells exhibit important roles in homeostasis and repair of skeletal muscle tissue as well as in myofiber growth. They are resident between the basement membrane and sarcolemma in a quiescent state and can be activated, upon injury, damage or disease, by macrophages [2, 3]. Leaving their quiescent state, satellite cells start dividing to provide proliferating myoblasts or to repopulate the satellite cell pool [4]. Thus, skeletal muscle tissue repair in vivo is a highly orchestrated process that in cases of volumetric tissue loss seems to be insufficient. To bypass the shortcomings of currently used treatment strategies, such as the occurrence of donor site morbidity in muscle flap transplantation surgery, other possibilities are being explored [5, 6]. Skeletal muscle tissue engineering (SMTE) approaches aim at generating skeletal muscle tissue constructs in vitro [7]. Functional skeletal muscle tissue can be useful for regenerative medicine purposes, as well as for the development of in vitro disease models and drug-testing.
For most SMTE approaches, scaffold materials are used to provide a temporary supportive structure for cells. However, an ideal biomaterial has not yet been found as there are many requirements for degradation properties, mechanical properties, porosity, cell adhesion, cell signaling, etc [8–11]. A more recent scaffold-free approach is inspired by developmental biology and is based on the generation of small modular tissues, which can be combined in multiple units [11, 12]. The unique self-assembling property of cells to form multicellular microtissue units is driven by surface tension and intercellular adhesion. According to the differential adhesion hypothesis, microtissues strive to maximize intercellular adhesion and minimize free energy, resulting in a spherical shape [13, 14]. To achieve spherical microtissues, so-called spheroids, many methods have been described, such as the hanging-drop method, spinner flask cultures, pellet cultures or the use of non-adhesive micropatterned surfaces [9, 15–17]. With each its advantages and disadvantages, the use of non-adhesive micropatterned surfaces, i.e. microchips, is often preferred. This technique, which relies on promoting cell-cell interactions, not only facilitates the generation of spheroids with a more precisely controlled geometry, but also enables their high-throughput production, a crucial requirement for extensive in vitro research. Using microchips, spheroids of different sizes can be generated by varying the total number of seeded single cells, the pore diameter and number of pores present in the microchip [18]. The use of spheroids instead of single cells as a cellular source is beneficial for biofabrication of tissues. In spheroid cultures, tissue-specific microarchitectural characteristics develop, which are not reflected in 2D cell cultures [10]. The high cell density in the spheroid not only mimics native tissue development, but also protects cells from damage during tissue handling [19, 20]. Moreover, due to the formation of endogenous extracellular matrix (ECM) and the increased expression of cadherins and integrins, aggregated cells are subjected to protection from external triggers, resulting in better cell viability rates and improved proliferation [21]. Next to that, spheroid cultures promote the expression of tissue-specific markers leading to a facilitated and accelerated differentiation and maturation process of the in vitro tissue [19, 21–23]. Also, spheroids possess the ability to fuse, which is essential to create larger tissues [24–28]. Both random and directed assembly techniques have been described to generate more complex constructs [29]. By random assembly, mostly an enlarged spheroid shaped construct arises [30, 31]. Directed assembly, e.g. via three-dimensional (3D) bioprinting, allows for more spatial control [19, 29, 32].
Tissue-specific spheroids are generated using primary adult cells, cell lines, progenitor cells, cancerous cells and/or different types of stem cells. In prior work, primary articular chondrocytes were used as an adult cell source to generate monoculture chondrogenic spheroids [19], valvular interstitial cells were cultured for the generation of valvular spheroids in the context of studying valvular pathology [33] and hepatocytes were used for generating hepatocellular spheroids [34]. Several types of stem cells are used in tissue engineering based on their specific properties, such as proliferation and differentiation capacity and secretory properties modulating processes involving immune response and angiogenesis [21]. Specifically, mesenchymal stem cells have been used in several studies for the generation of adipogenic [20], osteogenic [35, 36] and chondrogenic spheroids [26]. Also in cancer research, spheroids constituted of cancerous cells, with or without stem cells, have been studied [37–40].
Unfortunately, some cell types are not able to spontaneously form spheroids via matrix-free techniques solely dependent on cell-cell interactions. To induce cell aggregation and increase spheroid integrity, adding varying cell types or using an ECM is sometimes necessary. A biomaterial may be necessary to provide sufficient epitopes for cell adhesion [41–44]. Various synthetic as well as natural polymers in several forms such as nanofibers, microbeads and hydrogels are being used to mimic the natural ECM [45–47]. Nonetheless, the development of in vitro microtissues that closely mimic the native environment, even with ECM addition, still proves to be difficult for several tissues. Therefore, stem cells are frequently used as an additive cell type for the generation of co-culture spheroids. Endothelial cells have been combined with gingiva-derived stem cells to develop a co-culture spheroid model [48]. Tri-culture spheroids consisting of endothelial cells, fibroblasts and adipose-derived stem cells have also been described [18]. To date, muscle tissue engineering applications considering the generation of myogenic spheroids are rather limited. Cardiac muscle spheroids consisting of cardiomyocytes and supporting cell types have been successfully generated [49, 50]. Also, the engineering of smooth muscle spheroids has been explored for applications in bladder tissue engineering [51]. Nonetheless, the generation of skeletal muscle spheroids seems to be mainly restricted to the use of porcine primary cells and murine C2C12 cell line [52–54]. Only one study explored the ability of human skeletal myogenic cells to form spheroids [55]. The generation of spheroids consisting of human skeletal myoblasts for SMTE applications has not been reported.
The generation of thick 3D skeletal muscle tissue constructs remains very challenging due to, among other things, limited diffusion of nutrients and oxygen from the cell culture medium into the tissue (100–200 μm). When implanted in vivo, this leads to poor cell survival rates of cells in the core of the macro construct [4, 18, 56]. To overcome this issue, a hierarchic vascular network needs to be present including macro-, intermediate and microvasculature. After implantation, anastomosis of the engineered vascular network with the host blood vessels should be achieved. Since the microvasculature is the main interface between skeletal muscle tissue and the blood circulation, it can strongly affect muscular health in vivo and in vitro indicating its importance in SMTE [57, 58]. The incorporation of (micro)vasculature can be obtained through applying pre-vascularization strategies [59–62]. Several cell types play an important role in pre- and revascularization of engineered tissue. Not only endothelial cells are involved, but also mesenchymal stem cells, smooth muscle cells and pericytes amongst others [63]. Fortunately, generating spheroids allows the implementation of such pre-vascularization in newly engineered microtissues. In a previous study, non-myogenic vascular spheroids consisting of human umbilical vein endothelial cells (HUVECs), fibroblasts and human adipose-derived stem cells (human ASCs) were generated. The formation of capillary-like structures and lumen in the spheroids was reported [18]. When vascular spheroids were allowed to fuse into a bigger macro construct, vascular network formation extended. The same approach could be implemented for the generation of vascularized tissue-specific spheroids.
To date, the formation of human skeletal myogenic spheroids, which can serve as in vitro drug-testing or disease models, as well as, building blocks for skeletal muscle construct engineering, has not been reported yet. The first aim of this study was to generate monoculture spheroids consisting of human skeletal myoblasts in a high-throughput manner using a microchip environment. The effect of ascorbic acid addition to the culture medium was studied, aiming to retain maximum myogenic capacity whilst maintaining spheroid integrity during the culture period. Second, di-culture spheroids containing human ASCs and human skeletal myoblasts were generated, not only to better mimic the native environment, but also to benefit from the many advantages of incorporating mesenchymal stem cells. By applying several cell ratios, the myogenic capacity as well as spheroid integrity and ECM production were studied. Lastly, a pre-vascularization strategy was applied to aim for the generation of vascularized myogenic spheroids. These tri-culture spheroids, consisting of HUVECs, human ASCs and human skeletal myoblasts, were fabricated in two different ratios. With the unique combination of these three cell types, the aim was to generate spheroids with sufficient myogenic capacity and incorporated capillary-like networks.
2. Materials and methods
2.1. Cell culture
For this study, human skeletal myoblasts were isolated from fresh donor tissue obtained through the body donation program (KU Leuven, campus KULAK, Belgium) as described previously [64, 65]. Prior to implementation, this procedure received approval from the ethical committee under reference NH019-2 April 2020, and written consent for educational and research purposes was obtained from the donor. Subsequently, a cell sorting procedure for CD56+ was performed to retain a more pure cell population, following the published protocol [66]. Human ASCs (StemPro®, Invitrogen) and HUVECs (Lonza) were commercially obtained.
Human myoblasts were cultured in myoblast expansion medium (MEM) consisting of DMEM:glutamax supplemented with 10% fetal bovine serum, 1% Ultroser solution (Pall Corporation) and 50 μg ml−1 Gentamicin (ThermoFisher Scientific). Human ASCs were cultured in MesenPRO basal medium supplemented with MesenPRO growth supplement (Invitrogen) and 2 mM L-glutamine (ThermoFisher Scientific). HUVECs were cultured in basal endothelial growth medium (EBM-2, Lonza®) supplemented with the EGM-2 SingleQuot bulletkit (Lonza®) composing together the EGM-2. To stimulate fusion of myoblasts and the formation of multinucleated myotubes, skeletal myoblast fusion medium (SkFM) composed of DMEM high glucose containing 10 ng ml−1 hEGF, 10 μg ml−1 human insulin, 50 μg ml−1 BSA and 50 μg ml−1 gentamicin was applied in a 3D culture environment [65]. All cell types were cultured in a humidified atmosphere (5% CO2, 37 °C) with a maximum of seven passages. Cell medium was refreshed every other day.
2.2. Creation of agarose microchips
An in-house developed microchip culture system was created as previously described [18, 34]. Briefly, ultrapure agarose powder (Invitrogen) was dissolved in sterile phosphate buffered saline (PBS) (3 w/v%). The solution was heated (up to 100 °C) and pipetted on top of a negative polydimethylsiloxane customized mold (NaMiFab, Ghent University). The molds consisted of 1585 pores of 400 μm diameter and 220 μm depth. After solidification at room temperature (RT), the microchips were separated from the molds and the size was adapted to the 12-well format using a punching device (Turnus). Subsequently, the agarose microchips were stored in 12-well plates covered with sterile PBS at 4 °C until further use.
2.3. Generating mono- and co-culture spheroids
Prior to using human skeletal myoblasts in the 3D culture set-up, flow cytometry analysis for the expression of CD56 was performed to assess the purity of the myoblast population as described in [66]. Additional cell population analysis was conducted using immunofluorescent staining for desmin and tropomyosin as referred to in (section 2.7.).
Microchips were prepared by adding cell culture medium (0.5 ml) before incubation (37 °C, 5% CO2). Cells were harvested and the cell suspension (1 × 10⁶ cells, 0.5 ml) was seeded onto the microchip, resulting in approximately 630 cells per pore. After 3 h of incubation, more cell culture medium (2 ml) was gently added and microchips were placed in a humidified incubator (37 °C, 5% CO2) for spheroid culturing.
For the generation of monoculture spheroids, the cell suspension only contained human myoblasts. Spheroids were cultured in MEM for 4 d, before switching to SkFM for the remaining culture period time (section 2.1.). The enrichment of SkFM with either no, a low concentration [125 μM] or a high concentration [250 μM] ascorbic acid was studied. For the generation of co-culture spheroids, different cell types were mixed prior to seeding. Di-culture spheroids, consisting of human ASCs and human myoblasts, as well as tri-culture spheroids, consisting of HUVECs, human ASCs and human myoblasts were generated. Several ratios (a/b/c) for generating co-culture spheroids were used and compared, with a HUVECs, b human ASCs and c human myoblasts. Following cell ratios were included in the present study: 0/5/5; 0/2/8; 0/1/9, 1/4.5/4.5; 1/1.8/7.2. Three hours after seeding, the cells lowered into the pores of the microchip due to gravitational forces and spheroids were formed. Spheroids containing HUVECs were cultured in EGM-2 medium for 4 d followed by SkFM. Spheroids without HUVECs were cultured in MEM for 4 d before switching to SkFM. Cell medium was refreshed every other day and spheroids were cultured in a humidified incubator (37 °C, 5% CO2) for up to 12 (co-culture) or 14 (monoculture) days. Analysis of monoculture spheroids was performed after 7 and 14 d of culture. Co-culture spheroids were analyzed after 1, 4, 8 and/or 12 d of culture for quantitative and/or qualitative analysis.
2.4. Self-assembling behavior
The self-assembling behavior of single cells into spheroids was studied with live imaging techniques using the CELLCYTE X Live Imager (Cytena). For this, monoculture (human myoblasts), di-culture (human ASCs/human myoblasts) and tri-culture (HUVECs/human ASCs/human myoblasts) spheroids were generated by seeding 1 × 10⁶ single cells into an agarose microchip. Live imaging started 3 h after initial cell seeding at the moment of medium complementation (start imaging: '0 h'). The aggregating single cells were imaged for a time span of 48 h to observe different stages in the spheroid formation process. Relative spheroid area (%; pertaining to total image) was analyzed using the CELLCYTE Studio software. Analysis was based on images of ⩾30 spheroids, derived from separate microchips, taken every 10 min for the first 12 h and every 20 min for the remaining time of the experiment.
2.5. Fusion of spheroid doublets
Monoculture (human myoblasts) and tri-culture (HUVECs/human ASCs/human myoblasts) spheroids were obtained through seeding of 1 × 10⁶ single cells into an agarose microchip. Spheroids were cultured in MEM and EGM-2 complete medium respectively. To evaluate the effect of spheroid maturation stage for spheroid fusion purposes, two spheroids were co-localized in the same chip pore after either 1, 3 or 10 d in culture by manipulation through pipetting. After co-localization, the cell culture medium was switched to SkFM for the remaining culture period. Spheroid doublets were imaged every 2 h for 12 h and at 24 and 48 h with microscopy (Zeiss Axiovert A1). The doublet diameter and contact angle were quantified using ImageJ built-in particle analyzer tool (Fiji). Analysis is based on images of ⩾8 doublets derived from separate microchips.
2.6. Encapsulation and sprouting of spheroids
Tri-culture spheroids consisting of GFP-labeled HUVECs, human ASCs and human myoblasts (1/1.8/7.2) were cultured for 1 d in EGM-2 before encapsulation. For encapsulation, spheroids collected from three agarose microwell chips (± 4755 spheroids) were carefully resuspended in 125 μl fibrinogen solution (2 mg ml−1 in DPBS). Subsequently, 125 μl thrombin solution (4 U ml−1 in DPBS) was pipetted into a 48-well. The thrombin-fibrinogen spheroid solution was mixed whilst pipetting up and down for 5 s to induce fibrin formation. The fibrin gels were incubated for 10 min at RT, followed by 1 h incubation in the humidified incubator (37 °C, 5% CO2). After incubation, 1 ml of EGM-2 was added. The fibrin-spheroid constructs were cultured for 10 d in the incubator and medium was refreshed every 2 d. After 4 d in culture, EGM-2 was switched to SkFM. The constructs were imaged using brightfield and fluorescence microscopy (Zeiss Axiovert A1) on days 0, 1, 2, 4, 8 and 10. Quantification of endothelial sprout formation was performed using ImageJ (Fiji).
2.7. (Immuno) histochemical analysis
The overall morphology of spheroids was assessed on paraffin sections using hematoxylin/eosin (HE) and Martius Scarlet Blue (MSB) staining. First, spheroids were fixed with 4% formaldehyde overnight (4 °C). Subsequently, dehydration was performed using graded alcohol concentrations. Then, spheroids were embedded in paraffin and sections (5 μm) were cut prior to deparaffinization and rehydration. HE staining was performed by submerging sections consecutively in hematoxylin (10 min), running tap water (15 min), demineralized water (Aqdest; 2 min) and eosin (10 s). MSB staining was performed by submerging sections consecutively in Bouin's fluid (65 °C, 1 h), 95% ethanol (5 min), Martius yellow (2 min), Crystal scarlet (10 min), phosphotungstic acid (5 min), methyl blue (10 min) and 1% aqueous acetic acid (30 s). Thorough rinsing with distilled water was performed in between every step.
The presence and distribution of HUVECs was analyzed using a CD31 antibody staining on paraffin sections. Sections were submerged in citrate buffer (pH 6.0, 20 min, 95 °C) for heat-induced antigen retrieval. Next, endogenous peroxidase activity was blocked using H2O2 (10 min) followed by 30 min incubation with a blocking solution consisting of 1% BSA (Sigma), 5% normal rabbit serum (Invitrogen) and 0.2% Tween 20 in PBS. Then, sections were incubated with a mouse monoclonal PECAM-I antibody for 2 h at RT (1:500, Santa Cruz) followed by a biotinylated rabbit anti-mouse antibody for 30 min (1:200, Dako) as a secondary antibody. All antibodies were diluted in PBS containing 10% blocking solution. After washing (2 × 5 min) with PBS, streptavidin-horseradish peroxidase (1:200, 30 min, ThermoFisher Scientific) was used to treat sections. Lastly, 3,3-diaminobenzidine tetrahydrochloride (Sigma) was added to visualize the region of interest.
Supplementary to the flow cytometry analysis, the cell population was characterized by performing immunofluorescent staining for the muscle-specific marker desmin (in proliferative state) and fusion marker tropomyosin (in differentiation state). To allow cell fusion, 50.000 cells/24-well were seeded and cultured in MEM for 3 d until 100% confluency was reached. Thereafter, cells were cultured for 4 more days in SkFM before analysis was performed. For analysis of the myogenic capacity of spheroids, a tropomyosin antibody staining was performed. First, cells/spheroids were washed with PBS and fixed with a 4% formaldehyde solution for 10 min/1 h at RT. Additionally, cells/spheroids were fixed using methanol (tropomyosin staining) or methanol:acetone (desmin staining) (−20 °C) for 10 min/20 min. Fixed cells/spheroids were blocked and permeabilized in a blocking buffer consisting of PBS, 1% BSA and 0.2% Triton X-100 (Sigma). Next, cells/spheroids were incubated with a mouse monoclonal tropomyosin antibody (1:100) or desmin primary antibody (1:200) overnight at 4 °C (Sigma; in blocking buffer). Samples were washed with PBS (3 × 5 min) and, subsequently, incubated for 30 min/3 h in the dark with a polyclonal goat anti-mouse antibody (Alexa Fluor 488, Invitrogen; 1:200 in blocking buffer) at RT. As a last step, samples were incubated for 1 h in the dark with 4',6-diamidino-2-phenylindole (0.1 μg ml−1 in PBS) at RT upon visualization. Imaging was performed using confocal laser scanning microscopy (Zeiss LSM710) with PlanApochromat 25x/0.8, WD 0.57 mm objective. Tropomyosin staining could be quantified by calculating the percentage of nuclei within a tropomyosin positive stained area (%NT). The %NT parameter is equivalent to the ratio of nuclei within a tropomyosin positive stained area over the total amount of nuclei present in the spheroids and is indicative of the myogenic capacity of the tissue. %NT was calculated based on images from pooled spheroids derived from three separate chips.
For the evaluation of semi-thin sections (0.5 μm), spheroids were fixed in glutaraldehyde (2.5%, overnight at 4 °C) prior to washing in cacodylate buffer (0.1 M) and post-fixing in 1% osmium tetroxide. Samples were embedded in epoxy resin, cut with a Leica EM UC6 microtome and dewaxed before toluidin blue staining was performed. Representative images were taken with a Nikon Eclipse ci microscope equipped with a DS-Fi3 camera.
2.8. Live/dead analysis
To evaluate the tissue viability, spheroids were washed with PBS and incubated with calcein-AM (2 μg ml−1, Anaspec) and propidium iodide (2 μg ml−1, Sigma) for 10 min at RT. After incubation, spheroid viability could be evaluated using fluorescence microscopy. Imaging was performed with a Zeiss Axiovert 10 microscope mounted with an AxioCam ICc 1 camera using the Zeiss Zen (blue) software.
2.9. Morphometric analysis
Based on phase-contrast imaging of mono- and co-culture spheroids, spheroid diameter, roundness and circularity were analyzed using analyze particles as a build-in tool from ImageJ (Fiji). Analysis is based on images of spheroids derived from separate chips. Circularity and roundness were calculated using following formulas:
2.10. Transmission electron microscopy (TEM)
Samples for TEM were prepared as previously described [67]. Prepped and stained samples were cut in ultrathin sections (40–70 nm) with a UCT ultramicrotome (Leica). Images were acquired with the JEOL-1400 flash equipped with a Xarosa camera (EMSIS).
2.11. Real-time quantitative PCR (RT-qPCR)
To assess gene expression, RT-qPCR was performed as previously described [5]. Spheroids were analyzed on day 1 and day 12. A single cell population, respectively single cell myoblasts for the myogenic markers and single cell HUVECs for the endogenic markers, was used as a control. qPCR was performed on a selection of conditions. Gene expression for Myf5, MyoD, MHC1, MHC8, PECAM, COL4 and COL8 was measured and is displayed as fold change. RPL13 A, GADPH and HSP90AB1 were used as reference genes. Primer sequences are reported in (S.table 1).
2.12. Statistical analysis
All analysis represent data from independent microchip experiments unless mentioned differently in figure legends. Data was analyzed using the GraphPad Prism 9.0 software. Normality of the variables was tested with a Kolmogorov–Smirnov normality test. For qPCR data analysis, a Shapiro–Wilk normality test was performed. The homogeneity of variances was checked using a Bartlett's test. A Welch ANOVA and Dunnett's T3 post-hoc was used for analysis of %NT monoculture. A Kruskal–Wallis and Dunn's post-hoc was used for %NT di-culture, %NT tri-culture, HUVECs sprout length, MyoD, MHC8, PECAM, COL4 and COL8 gene expression. HUVEC sprouts per spheroid, Myf5 and MHC1 expression were analyzed using a one-way ANOVA with Tukey post-hoc. Diameter, roundness and circularity, as well as average doublet diameter, doublet angle and %CD31+ area were analyzed with a two-way ANOVA with Tukey post-hoc.
3. Results
3.1. Generation of monoculture myogenic spheroids
Prior to the use of human skeletal myoblasts for the generation of myogenic spheroids, cells were characterized. Flow cytometric analysis revealed a pure cell population of 99.08% CD56+ cells (S.figure 1(A)). Additional analysis (mean ± SD) for desmin revealed a myoblast purity of 98.09 ± 1.91%. The fusion capacity was assessed with tropomyosin staining revealing 65.89 ± 6.78% myoblast fusion (S.figure 1(B)).
Subsequently, monoculture spheroids consisting of human skeletal myoblasts were generated using microchips. Spheroids started to disintegrate, resulting in irregular shaped spheroids after 7 and 14 d of culture. To enhance spheroid quality, ascorbic acid was added to the SkFM in either a low [125 μM] or high [250 μM] concentration. Less spheroid disintegration and cell debris was observed when increasing the concentration of ascorbic acid (figure 1(A)). Live/dead analysis with calcein-AM/propidium iodide (green/red) showed the occurrence of slightly more cell death in the condition without ascorbic acid (figure 1(B)). Dead cells were located in the core region of the spheroids as well as at the periphery. The overall average viability (%) after 14 d of culture was 77 ± 9% (control condition), 82 ± 5% [125 μM] and 89 ± 3% [250 μM]. Diameter analysis (mean ± SD) revealed a decrease over time for each condition. In more detail, for the control condition this resulted in 179 ± 31 μm (day 1), 137 ± 11 μm (day 7) and 115 ± 17 μm (day 14). In the [125 μM] condition diameter values ranged from 172 ± 13 μm (day 1) to 106 ± 11 μm (day 7) and 88 ± 8 μm (day 14). At last in the [250 μM] condition following diameters were reported: 157 ± 14 μm (day 1), 132 ± 13 μm (day 7) and 120 ± 11 μm (day 14) (figure 1(C)). A mean roundness of ⩾82% was observed, except for the control condition on day 14 with a roundness of 75% (S.figure 2(A)). Circularity values were higher, after 14 d of culture, for the conditions with ascorbic acid: 70 ± 11% (control condition) compared to 90 ± 5% [125 μM] and 88 ± 5% [250 μM] (figure 1(D)).
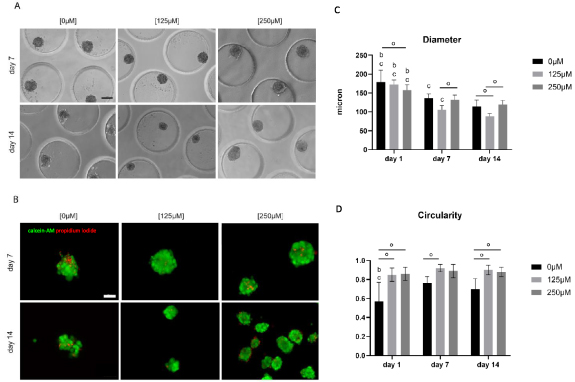
Figure 1. Analysis of morphology, viability and morphometry of monoculture myoblast spheroids with varying concentrations of ascorbic acid [0 μM], [125 μM] and [250 μM] added to the SkFM. (A) Phase-contrast microscopy displaying the overall morphology after 7 and 14 d of culture in varying medium conditions, scale bar: 100 μm. (B) Live/dead analysis performed on 7 and 14 d old spheroids in varying medium conditions with calcein-AM (green) staining living cells and propidium iodide (red) staining dead cells, scale bar: 100 μm. (C) Diameter and (D) circularity analysis of spheroids of all three conditions [0 μM], [125 μM] and [250 μM] after 1, 7 and 14 d. Significant differences (**** p < 0.0001) were marked, compared to the same condition on a day 1, b day 7 and c day 14 and comparing conditions within the same time point (°). All data is presented as mean ± SD. Analysis is based on data from independent microchip experiments (n = 3) analyzed using a two-way ANOVA and Tukey post-hoc.
Download figure:
Standard image High-resolution imageThe ability of myoblasts to fuse was evaluated qualitatively (figure 2(A)) and quantitively (figure 2(B)) by performing a tropomyosin staining and calculating the %NT. Tropomyosin positive signal was present at the peripheral part and in the center of the spheroids in the [0 μM] condition. In the [125 μM] and, especially, in the [250 μM] condition, positive staining was restricted to the center. %NT values (mean ± SD) decreased with increasing concentrations of ascorbic acid: 28 ± 10% (day 7); 43 ± 13% (day 14) in the control condition [0 μM], 20 ± 7% (day 7); 21 ± 5% (day 14) in the [125 μM] condition and 7 ± 6% (day 7); 6 ± 4% (day 14) in the [250 μM] condition (figure 2(B)). qPCR analysis displayed low expression of Myf5 and MyoD in the spheroid condition. An upregulation for differentiation markers MHC1 and MHC8 was observed in the spheroid condition, especially after 12 d of culture (figure 2(C)). For further evaluation of the morphology, 10 d old spheroids ([0 μM] condition) were examined with toluidin blue staining and TEM (figure 3). Toluidin blue staining performed on semi-thin sections displayed uneven spheroid edges with multiple nuclei grouped into separate structures (figure 3(A)). TEM images indicated the presence of nuclei containing two nucleoli (figure 3(B)), an abundant amount of mitochondria (figure 3(C)) and cells containing multiple nuclei (figure 3(D)).
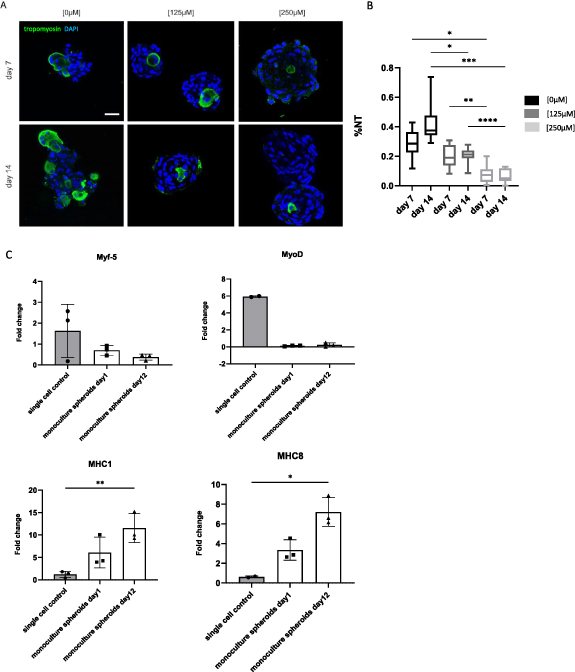
Figure 2. Qualitative and quantitative analysis of the myogenic capacity of monoculture myoblast spheroids. (A) Qualitative analysis after 7 and 14 d using confocal microscopy to visualize tropomyosin positive signal (green) and nuclei (DAPI; blue) within spheroids, scale bar: 50 μm. (B) Quantitative analysis of the myogenic capacity by calculating the %NT within spheroids after 7 and 14 d. The boxplot represents minimum to maximum values. Analysis is based on data gathered from pooled spheroids derived from three microchips. A Welch's ANOVA with Dunnett's T3 post-hoc was used. (C) qPCR analysis performed for Myf5, MyoD, MHC1 and MHC8. Gene expression is displayed as fold change. Each dot represents an independent replicate. Single cell myoblasts were used as a control. A one-way ANOVA with Tukey post-hoc was performed for Myf5 and MHC1. A Kruskal Wallis and Dunn's post-hoc was performed for MyoD and MHC8. * p < 0.05, ** p < 0.01, *** p < 0.001 and **** p < 0.0001.
Download figure:
Standard image High-resolution image
Figure 3. Evaluation of monoculture (human myoblasts) spheroids, cultured without ascorbic acid, after 10 d with toluidin blue staining performed on semi-thin sections (A) and transmission electron microscopy (BCD). (A) Toluidin blue staining performed on semi-thin sections displaying the unique morphology of monoculture myogenic spheroids. Black circles indicate uneven spheroid edges with multiple nuclei grouped into separate structures, scale bar: 10 μm. (B) Two nucleoli (black arrows) present within the same cell. (C) Mitochondria (black arrows) present in the cells. (D) Two nuclei (black arrows) surrounded by one basement membrane (white arrow), scale bar: 2 μm.
Download figure:
Standard image High-resolution image3.2. Generation of di-culture myogenic spheroids
For the generation of di-culture spheroids, different cell ratios of human ASCs with human myoblasts (5/5, 2/8 and 1/9) were tested (figure 4(A)). Cells spontaneously formed spheroids and remained their integrity up to 12 d in culture. A general decrease in diameter (mean ± SD) over time could be observed (figure 4(B)). This decrease was most clear in the 5/5 condition, with a diameter change from 227 ± 19 μm (day 1) to 119 ± 12 μm (day 12), and in the 1/9 condition, with diameters changing from 205 ± 24 μm (day 1) and 126 ± 17 μm (day 12). In contrast, after being cultured for 4 d, the diameter of 2/8 condition spheroids remained stable throughout the rest of the experiment. Spheroids of all conditions displayed a round morphology with an average per condition of >77% and significant differences within and between conditions (S.figure 2(B)). Circularity values decreased with the addition of more myoblasts. After 12 d of culture, this resulted in values of 78 ± 6% (5/5), 70 ± 7% (2/8) and 69 ± 10% (1/9) (figure 4(C)). Live/dead analysis performed after 12 d resulted in comparable cell viabilities (figure 4(D)). In more detail, the viability (%) ranged from 93 ± 4% (5/5 condition) to 79 ± 6% (2/8 condition) and 92 ± 5% (1/9 condition). The overall morphology of the co-culture spheroids was assessed with HE (figure 4(E)) and MSB (figure 4(F)) staining performed on day 12. HE showed the organization of nuclei randomly spread over the whole spheroid area. Clearly defined spheroid edges are the most prominently present in the 5/5 condition. In contrast, the 2/8 condition displays a morphology in which separate cells can be distinguished at the spheroids' periphery. More loose cells in between spheroids could be detected in the 1/9 condition indicating spheroids with inferior quality (figure 4(E)). In none of the di-culture conditions collagen deposition (blue) could be observed with MSB staining. Crystal scarlet red staining (typically used for fibrin) was present in all conditions, although more intensely in the conditions with more myogenic cells (2/8 and 1/9). Heterogenic morphology of spheroids could be observed within and between spheroids. Self-developing compartmentalization occurred in the condition with an equal amount of human ASCs and human myoblasts added (figure 4(F), black arrows). Tropomyosin positive staining was present in all conditions after 8 and 12 d of culture (figure 5(A)). However, poor %NT values (median ± IQR) could be observed for the 5/5 condition with respectively 1 ± 2% (day 4), 3 ± 2% (day 8) and 9 ± 7% (day 12). These values increased when generating spheroids with a higher amount of myoblasts resulting in 13 ± 19% (day 4), 53 ± 29% (day 8) and 20 ± 40% (day 12) for the 2/8 condition and 39 ± 18% (day 4), 49 ± 11% (day 8) and 63 ± 35% (day 12) for the 1/9 condition (figure 5(B)). High coefficients of variance were reported, especially for the 5/5 condition day 4 (111%), 2/8 condition day 4 (99%) and day 12 (100%). qPCR analysis displayed low expression of Myf5 and MyoD compared to the control condition. In contrary, MHC1 and MHC8 expression was higher. The expression of markers did not differ significantly between the di-culture conditions (figure 5(C)). Due to the morphological inferior quality of the 1/9 condition it was decided to exclude this condition in further experiments. Spheroids of 10 d old (5/5; 2/8 condition) were evaluated with toluidin blue staining and TEM (figure 6). Compartmentalization (5/5 condition) and fusion of nuclei was observed with toluidin blue staining (figures 6(A) and (B)) and confirmed earlier presented data (figures 4(E) and (F)). TEM analysis displayed the presence of nuclei containing two nucleoli (figure 6(C)), multivesicular bodies (figure 6(D)), multiple nuclei per cell (figure 6(E)) and developing ECM and intracellular vacuoles (figure 6(F)).
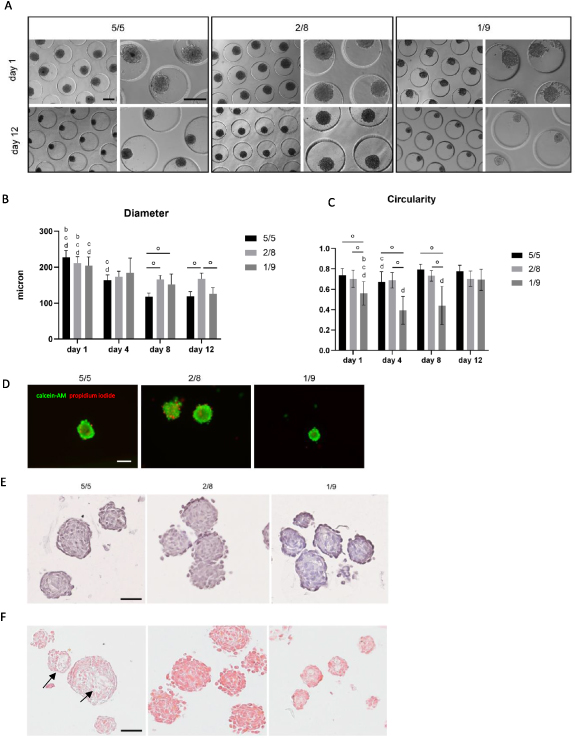
Figure 4. Analysis of morphology, viability and morphometry of di-culture spheroids consisting of human ASCs and human myoblasts in three different ratios: 5/5, 2/8 and 1/9. (A) Phase-contrast imaging of di-culture spheroids on day 1 and 12 of culture with different magnifications, scale bar: 200 μm. (B) Diameter and (C) circularity of di-culture spheroids analyzed after 1, 4, 8 and 12 d of culture. Significant differences were marked, compared to the same condition on a day 1, b day 4, c day 8 and d day 12 (p < 0.0001) and comparing conditions within the same time point °, p < 0.0001. All data is presented as mean ± SD. Analysis is based on data from independent microchip experiments (n = 3) analyzed using a two-way ANOVA and Tukey post-hoc. (D) Live/dead analysis of di-culture spheroids after 12 d in culture with calcein-AM (green) staining living cells and propidium iodide (red) staining dead cells, scale bar: 100 μm. (E) Hematoxylin/eosin staining on 12 d old spheroids displaying the general morphology, scale bar: 50 μm. (F) Martius Scarlet Blue staining on 12 d old spheroids displaying the extracellular matrix and a heterogeneous morphology with compartmentalization phenomenon (pointed by black arrows), scale bar: 50 μm.
Download figure:
Standard image High-resolution image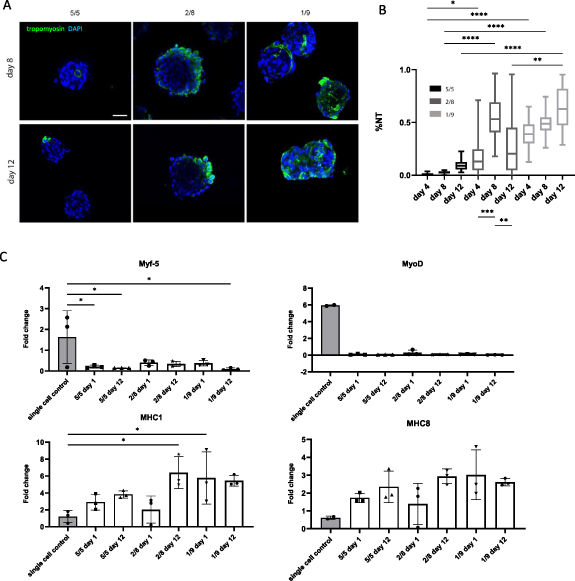
Figure 5. Qualitative and quantitative analysis of the myogenic capacity of di-culture myoblast spheroids. (A) Qualitative analysis after 8 and 12 d using confocal microscopy to visualize tropomyosin positive signal (green) and nuclei (DAPI; blue) within spheroids, scale bar: 50 μm. (B) Quantitative analysis of the myogenic capacity by calculating the %NT within spheroids after 8 and 12 d. The boxplot represents minimum to maximum values. Analysis is based on data gathered from pooled spheroids derived from three microchips. A Kruskal Wallis with Dunn's post-hoc was used. (C) qPCR analysis performed for Myf5, MyoD, MHC1 and MHC8. Gene expression is displayed as fold change. Each dot represents an independent replicate. Single cell myoblasts were used as a control. A one-way ANOVA with Tukey post-hoc was performed for Myf5 and MHC1. A Kruskal Wallis and Dunn's post-hoc was performed for MyoD and MHC8. * p < 0.05, ** p < 0.01, *** p < 0.001 and **** p < 0.0001.
Download figure:
Standard image High-resolution image
Figure 6. Evaluation of di-culture spheroids (human adipose-derived stem cells and human myoblasts) after 10 d with toluidin blue staining performed on semi-thin sections (AB) and transmission electron microscopy (CDEF). Toluidin blue staining performed on semi-thin sections displaying the unique morphology of di-culture myogenic spheroids of the 5/5 condition (A) and 2/8 condition (B), scale bar: 10 μm. Black arrows indicate fusion of nuclei. Dashed line indicates spheroid compartmentalization resulting in, visually, two different compartments within the spheroid. (C) Two nucleoli (black arrows) present within the same cell in the 5/5 condition. (D) Multivesicular bodies (black circles) in the 2/8 condition. (E) Two nuclei (black arrows) surrounded by one basement membrane in the 5/5 condition. (F) Intracellular vacuole (black arrow) surrounded by developing ECM (white arrows) in the 2/8 condition, scale bar: 2 μm.
Download figure:
Standard image High-resolution image3.3. Generation of vascularized myogenic spheroids
To incorporate vascular structures in the myogenic microtissue building blocks, a pre-vascularization strategy was applied. Myogenic spheroids containing endothelial cells were fabricated by adding HUVECs to the di-culture spheroids, resulting in a tri-culture set-up (HUVECs/human ASCs/human myoblasts). Two different ratios were tested based on the results from the di-culture experiments and earlier reported data [18, 27]: 1/4.5/4.5 and 1/1.8/7.2. Phase-contrast images show comparable results for both conditions with roundly shaped, integer spheroids over time (figure 7(A)). Live/dead analysis showed an overall good viability (%) for both conditions after 12 d with slightly more peripheral cell death for the 1/4.5/4.5 conditions (86 ± 4%), contrary to more dead cells present in the core region of the spheroids in the 1/1.8/7.2 condition (81 ± 4%) (figure 7(B)). Diameter analysis indicates significant differences with diameters (mean ± SD) between 184 ± 15 μm and 238 ± 26 μm. Diameters tended to be higher when lowering the myoblast percentage (figure 7(C)). Morphometric analysis of spheroid roundness resulted in no statistical differences with values ⩾83% (S.figure 2(C)). Circularity values on day 12 ranged from 72 ± 7% (1/4.5/4.5) to 80 ± 6% (1/1.8/7.2) (figure 7(D)). HE staining displayed little to no morphological differences between conditions (figure 7(E)). MSB staining revealed more collagen deposition (blue) in the condition with an equal amount of myoblasts and human ASCs added compared to the condition with a majority of myoblasts present (figure 7(F)). Tropomyosin positive signal was observed at the periphery of spheroids in both conditions after 12 d, although more dominantly present in the condition containing more myoblasts (figure 8(A)). In detail, %NT values (median ± IQR) ranged from 7 ± 14% (day 4) to 14 ± 52% (day 8) and 16 ± 76% (day 12) for the 1/4.5/4.5 condition. For the 1/1.8/7.2 condition values were higher with 41 ± 45% (day 4), 32 ± 34% (day 8) and 41 ± 49% (day 12) (figure 8(B)). Gene expression levels of Myf5 and MyoD were lower in the spheroid condition compared to the control. Upregulation for MHC1 and MHC8 was observed, especially for 1 d old spheroids (figure 8(C)). Ultimately, the ability of HUVECs to reside in the tri-culture spheroids and form endothelial networks, especially after the medium is switched from EGM-2 to SkFM, was evaluated with immunohistochemical staining for CD31. Several lumen appeared, reflecting the formation of capillary-like networks (figure 9(A)). CD31+ staining was observed (indicated by black arrows) starting from day 4 up to day 12 in both conditions. More CD31+ stained area seemed to be present in the condition with a higher percentage of myoblasts. This was confirmed by analysis of the %CD31+ area (mean ± SD) reporting 5 ± 2% (day 1), 4 ± 3% (day 4) and 4 ± 2% (day 12), for the 1/4.5/4.5 condition, and 8 ± 3% (day 1), 12 ± 6% (day 4) and 5 ± 2% (day 12) for the 1/1.8/7.2 condition (figure 9(B)). Gene expression level of PECAM was lower in the spheroid condition compared to the control. Upregulation for COL4 and COL8 was observed, especially for 1 d old spheroids (figure 9(C)). Due to the presence of more tropomyosin positive signal and CD31+ area, it was decided to select the 1/1.8/7.2 condition for qPCR (figure 9(C)) and morphological analysis with toluidin blue and TEM (figure 10). Toluidin blue staining confirmed the presence of lumen-like structures surrounded by endothelial cells (figures 10(A)–(C)). TEM images displayed the presence of actin filaments and glycogen granules (figure 10(D)). Also Weible-Palade bodies (figure 10(E)), found in endothelial cells, and lumen-like structures (figure 10(F)) were observed.
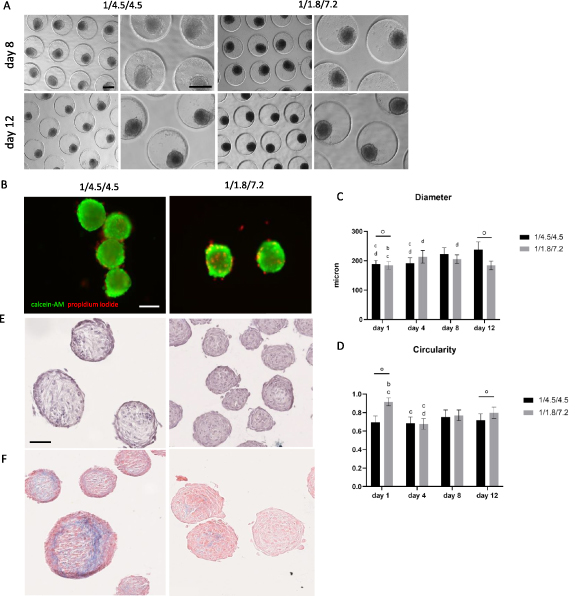
Figure 7. Analysis of morphology, viability and morphometry of tri-culture spheroids. (A) Phase-contrast imaging of tri-culture spheroids on day 8 and 12 of culture with different magnifications, scale bar: 200 μm. (B) Live/dead analysis of tri-culture spheroids after 12 d in culture with calcein-AM (green) staining living cells and propidium iodide (red) staining dead cells, scale bar: 100 μm. (C) Diameter and (D) Circularity of tri-culture spheroids analyzed after 1, 4, 8 and 12 d of culture. Significant differences were marked, compared to the same condition on a day 1, b day 4, c day 8 and d day 12 (p < 0.0001) and comparing conditions within the same time point °, p < 0.0001. All data is presented as mean ± SD. Analysis is based on data from independent microchip experiments (n = 3) analyzed using a two-way ANOVA and Tukey post-hoc. (E) Hematoxylin/eosin staining on 12 d old spheroids displaying the general morphology. (F) Martius Scarlet Blue staining on 12 d old spheroids displaying the deposition of extracellular matrix components (blue: collagen), scale bar: 50 μm.
Download figure:
Standard image High-resolution image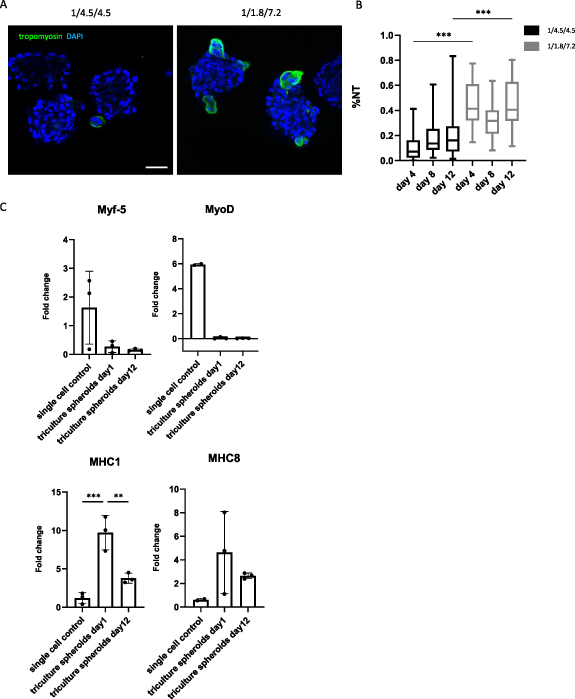
Figure 8. Qualitative and quantitative analysis of the myogenic capacity of tri-culture myoblast spheroids. (A) Qualitative analysis after 8 and 12 d using confocal microscopy to visualize tropomyosin positive signal (green) and nuclei (DAPI; blue) within spheroids, scale bar: 50 μm. (B) Quantitative analysis of the myogenic capacity by calculating the %NT within spheroids after 8 and 12 d. The boxplot represents minimum to maximum values. Analysis is based on data gathered from pooled spheroids derived from three microchips. A Kruskal Wallis with Dunn's post-hoc was used. (C) qPCR analysis performed for Myf5, MyoD, MHC1 and MHC8. Gene expression is displayed as fold change. Each dot represents an independent replicate. Single cell myoblasts were used as a control. A one-way ANOVA with Tukey post-hoc was performed for Myf5 and MHC1. A Kruskal Wallis and Dunn's post-hoc was performed for MyoD and MHC8. * p < 0.05, ** p < 0.01, *** p < 0.001 and **** p < 0.0001.
Download figure:
Standard image High-resolution image
Figure 9. Qualitative and quantitative analysis of the endogenic capacity of tri-culture spheroids. (A) CD31 staining (brown and indicated with black arrows) performed on tri-culture spheroids after 4, 8 and 12 d of culture. Positive staining represents the presence of endothelial cells forming capillary-like structures, scale bar: 50 μm. (B) Quantification of CD31+ area analyzed by a two-way ANOVA with Tukey post-hoc, **** p < 0.0001 and *** p < 0.001. Data is presented as mean ± SD. Analysis is based on ⩾15 spheroids gathered from independent microchips. (C) qPCR analysis performed for PECAM, COL4 and COL8. Gene expression is displayed as fold change. Each dot represents an independent replicate. Single cell HUVECs were used as a control. A Kruskal Wallis and Dunn's post-hoc was performed for all genes. * p < 0.05, ** p < 0.01, *** p < 0.001 and **** p < 0.0001.
Download figure:
Standard image High-resolution image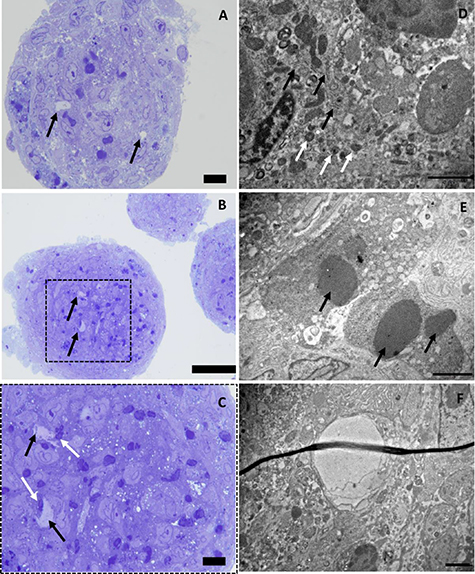
Figure 10. Evaluation of tri-culture spheroids consisting of HUVECs, human ASCs and human myoblasts (1/1.8/7.2) after 10 d with toluidin blue staining performed on semi-thin sections (ABC) and transmission electron microscopy (DEF). (ABC) Toluidin blue staining performed on semi-thin sections displaying the unique morphology of tri-culture spheroids with lumen-like structures (black arrows) surrounded by nuclei of endothelial cells (white arrows), scale bar: 10 μm (AC) and 50 μm (B). (D) Actin filaments (black arrows) and glycogen granules (white arrows). (E) Weible Palade bodies (black arrows). (F) Lumen-like structure, scale bar: 2 μm.
Download figure:
Standard image High-resolution image3.4. Self-assembly of single cells into spheroids
Single cells self-assemble into spheroids when seeded in a non-adherent microwell system due to the culturing environment and gravitational forces. Depending on the used cell type(s) and applied cell ratio, the assembling time can vary. To gain more knowledge about the initial spheroid formation phase, real-time live imaging of single cell assembly was performed for the first 48 h of culture (figure 11). The monoculture condition, as well as the di-culture (5/5; 2/8) and tri-culture conditions (1/1.8/7.2; 1/4.5/4.5) were analyzed. Live imaging started after medium complementation which is 3 h post-seeding (0 h). At 0 h single cells could still be distinguished in all conditions, although primary cellular aggregation was already observed for the conditions containing higher amounts of human ASCs. These same conditions formed spheroid shaped structures at 4 h, whilst the conditions containing more human myoblasts seemed to remain in the primary cellular aggregation phase where single cells could still be distinguished. After 8 h, all co-culture conditions led to the formation of spheroids in contrast to the monoculture condition, which only started its spheroid formation phase at 12 h (figure 11(A)). Quantification of the relative spheroid area (%) expressed in function of time confirmed these findings. The curve for both tri-culture conditions seemed to incline (4–8 h), after the initial decline. The di-culture conditions curve declined, resulting in a plateau-like curve. Although the initial decline of the monoculture curve was lagged compared to the co-culture conditions, the monoculture relative spheroid area (%) ended up being the lowest after 48 h (figure 11(B)).
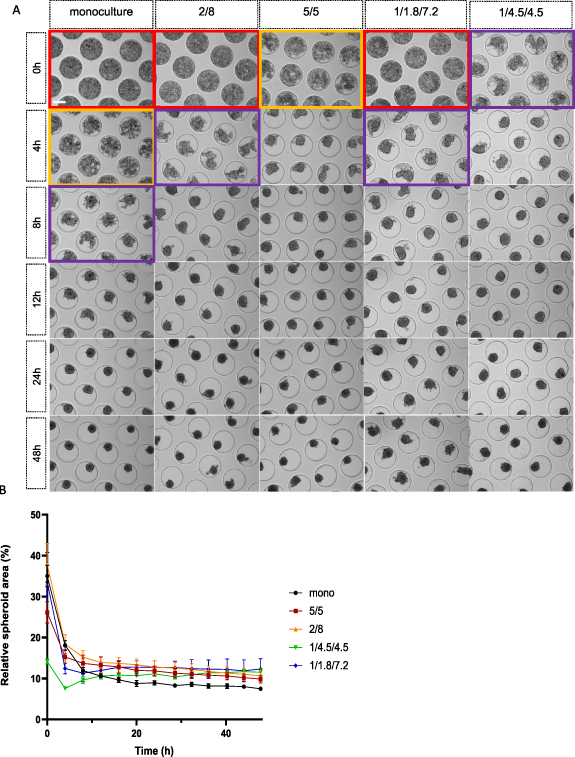
Figure 11. Brightfield imaging and relative spheroid area (%) analysis of single cell self-assembly into spheroids over a time-span of 48 h. (A) Real-time microscopic imaging of single cell assembling behavior into spheroids for the monoculture condition (human myoblasts), human ASCs/human myoblasts di-culture conditions (5/5; 2/8) and HUVECs/human ASCs/human myoblasts tri-culture conditions (1/4.5/4.5; 1/1.8/7.2). Red boxes indicate the single cell phase with cells lowered into the pores. Yellow boxes indicate the early cellular aggregation phase with single cells still being distinguishable. Purple boxes indicate the late cellular aggregation phase with the initiated formation of spheroid-shaped structures. Panels without colored boxes display spheroid formation, scale bar: 200 μm. (B) Graphical visualization of relative spheroid area (%) over time for the monoculture condition, di-culture conditions (5/5; 2/8) and tri-culture conditions (1/4.5/4.5; 1/1.8/7.2). All data is presented as mean ± SD.
Download figure:
Standard image High-resolution image3.5. Fusion of spheroid doublets
Once suitable microtissue building blocks are generated, the next step within SMTE is the assembly of microtissue building blocks to engineer a larger construct. For this, the fusion capacity of doublet myogenic spheroids in pores of the microwell chip was evaluated (figures 12 and 13). Monoculture (figure 12(A)) and tri-culture (1/1.8/7.2) spheroids (figure 12(B)) were cultured until a different spheroid maturation stage prior to doublet formation: early maturation (1 d old), mid maturation (3 d old) and late maturation (10 d old). Microscopic imaging of the same microchip area over time allowed qualitative analysis of doublet fusion for both culture conditions and for all three maturation stages (figure 12). In general, monoculture doublets appeared to be smaller compared to tri-culture doublets. Also, the maturation stage of the spheroids prior to doublet fusion seemed to have more impact in the monoculture condition. More cell debris could be observed in the tri-culture conditions, especially in the late maturation stage (figure 12). Quantitative analysis of doublet diameter (μm) from 0 h to 48 h (figures 13(A)–(C)) and contact angle (°) from 2 h to 24 h (figures 13(D)–(F)) was performed. The doublet diameter of monoculture spheroids measured at 0 h was the highest for spheroids with an early maturation stage and seemed to decrease with more maturation. Moreover, the decrease in doublet diameter of early matured monoculture spheroids seemed to be more abundant compared to mid and late matured spheroids. After 48 h of follow-up, the average diameter of these early matured doublets had decreased to around 63% of their original diameter compared to 72% and 81% for the mid and late matured spheroids, respectively. This resulted in doublet diameters (mean ± SD) ranging from 155 ± 27 μm (late) to 177 ± 25 μm (mid) and 204 ± 12 μm (early) (figure 13(A)). The maturation stage of tri-culture spheroids prior to fusion did not seem to highly affect the initial doublet diameter (figure 13(B)). During the first 24 h, the average diameter of early matured tri-culture spheroid doublets decreased to approximately 72% compared to 86% (mid) and 90% (late). After 48 h of tri-culture doublet fusion comparable average doublet diameters were reported: 235 ± 30 μm (early), 236 ± 22 μm (mid) and 244 ± 28 μm (late) (figure 13(B)). Analysis performed on the average doublet diameter after 48 h of fusion indicated statistical differences for all maturation stages (p < 0.0001) comparing mono- and tri-culture spheroids (figure 13(C)). Within each culture condition, doublet diameter of the early and late stages significantly differed (p < 0.01). The contact angle indicates to what extent spheroids have fused, with a maximum of 180 degrees which is integration to one round spheroid. The contact angle measurements indicated that early matured spheroids fused better than later matured spheroids, both for mono- (figures 13(D)–(F)) and tri-culture spheroids (figures 13(E)–(F)). Tri-culture spheroids however reach a plateau in contact angle around 150 degrees within 12 h, whereas monoculture spheroids need 24 h (figure 13).
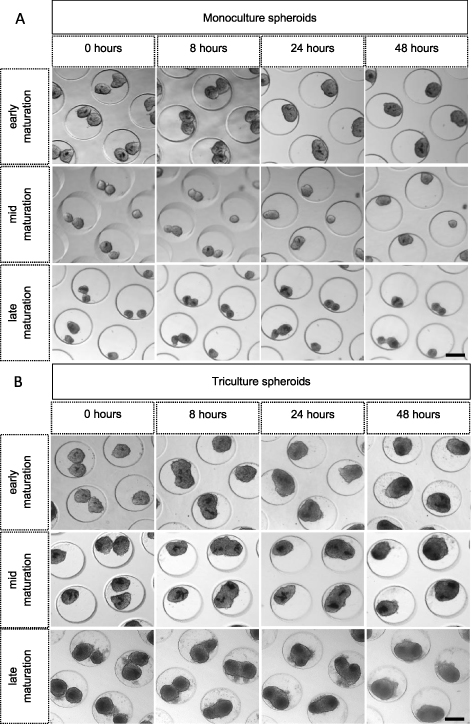
Figure 12. Phase-contrast imaging of mono- (human myoblasts) and tri-culture (1/1.8/7.2) doublet fusion over time for three different maturation stages: early (1 d old), mid (3 d old) and late (10 d old) maturation. (A) Monoculture and (B) tri-culture doublets from all three maturation stages are followed-up to evaluate fusion capacity. The same region was imaged over time. After 24 h of fusion, doublets were reshaped into one spheroid shape, scale bar: 200 μm.
Download figure:
Standard image High-resolution image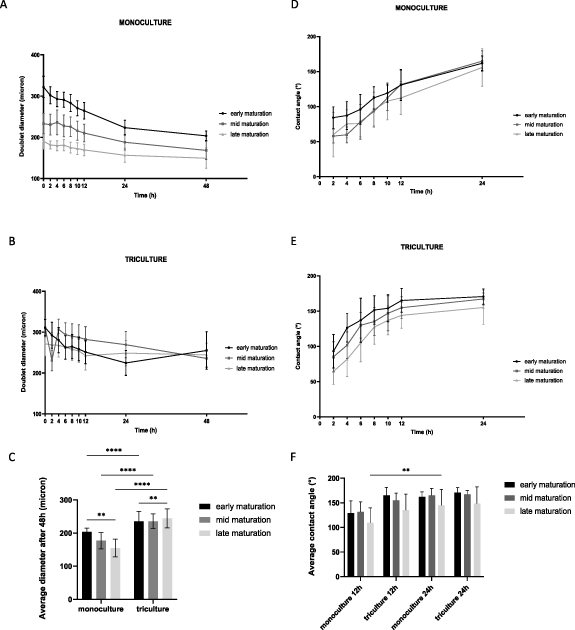
Figure 13. Quantitative analysis of the doublet diameter (μm) and contact angle (°) in between spheroids forming a doublet over time for both mono- (human myoblasts) and tri-culture conditions (1/1.8/7.2) and for three different maturation stages: early (1 d old), mid (3 d old) and late (10 d old) maturation. (A) Monoculture and (B) tri-culture doublet diameters analyzed for 48 h. (C) Average doublet diameter after 48 h of fusion comparing the mono- and tri-culture condition and all maturation stages. (D) Monoculture and (E) tri-culture contact angle analyzed for 24 h. (F) Average contact angle after 12 and 24 h of fusion comparing the mono- and tri-culture condition and all maturation stages. Data is presented as mean ± SD. Analysis was performed, based on images of ⩾ 8 doublets derived from separate microchips, using a two-way ANOVA with Tukey post-hoc, **** p < 0.0001, ** p < 0.01.
Download figure:
Standard image High-resolution image3.6. Sprouting capacity of encapsulated spheroids in fibrin gel
Tri-culture spheroids were encapsulated in a fibrin gel to evaluate sprouting capacity of GFP-HUVECs and the supportive qualities of fibrin as a hydrogel. Tri-culture spheroids (1/1.8/7.2) of an early maturation stage (one day old) were encapsulated in a 1 mg ml−1 fibrin gel for 10 d. After 4 d in EGM-2, supporting endothelial cell sprouting, a switch was made to SkFM to stimulate myoblast fusion and to avoid loss of myogenic cells. Phase-contrast and fluorescence microscopy images were taken at days 0, 1, 4, 8 and 10 (figure 14(A)). The angiogenic activity of encapsulated spheroids was evaluated by analyzing HUVEC-GFP sprout length (μm) (figure 14(B)) and number of HUVECs sprouts per spheroid (figure 14(C)). Starting from day 1, endothelial cells (in green), as well as other cell types involved (human ASCs and human myoblasts), started to sprout from the spheroid. On day 4 in EGM-2, the sprouting from GFP-HUVECs was maximal and then seemed to deteriorate, which coincided with the switch from EGM-2 to SkFM. The HUVEC sprout length (median ± IQR) was the highest after 4 d of culture (102 ± 66 μm) compared to day 1 (53 ± 27 μm), day 8 (42 ± 81 μm) and day 10 (51 ± 36 μm) (figure 14(B)). Also the number of HUVEC sprouts per spheroid (mean ± SD) was the highest at day 4 of analysis (5.28 ± 1.44) compared to day 1 (2.14 ± 0.79), day 8 (1.45 ± 0.65) and day 10 (0.74 ± 0.44) (figure 14(C)).

Figure 14. Microscopic and quantitative analysis of HUVEC sprouts arising from tri-culture spheroids consisting of GFP-HUVEC, human ASCs and human myoblasts (1/1.8/7.2) encapsulated in fibrin hydrogel on day 1, 4, 8 and 10. (A) Phase-contrast imaging of encapsulated tri-culture spheroids in fibrin gel. The green signal represents endothelial cells labeled with GFP, scale bar: 100 μm. (B) The HUVEC sprout length was analyzed using a Kruskall Wallis and Dunns post-hoc. Data is displayed in a truncated violin plot. (C) Number of HUVECs sprouts per spheroid was analyzed using a one-way ANOVA with Tukey post-hoc. Data is displayed in a boxplot graph with whiskers representing minimum and maximum values with **p < 0.01, ****p < 0.0001. Analysis is based on images gathered from separate fibrin gels (n = 3).
Download figure:
Standard image High-resolution image
4. Discussion
Volumetric muscle loss is characterized as an extensive and quick loss of at least 20% of the total muscle mass resulting in muscle impairment beyond regenerative capacity. Additionally, it involves damage to vasculature resulting in inflammation, fibrosis and scar formation [68]. SMTE presents a promising strategy to biofabricate a large skeletal muscle construct. The difficulty to build a vascular network in a large construct may be tackled by employing vascularized microtissue building blocks.
The goal of the present study was to investigate several parameters to generate myogenic and vascularized myogenic spheroids. The ability of human skeletal myoblasts to form integer spheroids and allow differentiation into myotubes was studied. Unfortunately, not all cell types can self-assemble into a spheroid shape when matrix-free techniques are being applied. Sometimes the use of an artificial ECM or the addition of a supportive cell type is needed to induce cellular aggregation [42]. The addition of mesenchymal stem cells, as a supportive cell source, and ascorbic acid, as a medium supplement, was evaluated. Moreover, a pre-vascularization strategy was applied to generate vascular myogenic spheroids by adding an endothelial cell component (HUVECs). Insights were gathered in the myogenic and angiogenic capacity of co-culture spheroids and the influence of cell culture medium as well as spheroid composition. Moreover, assembly of single cells into spheroids and spheroid fusion, depending on spheroid maturation stage, was studied in more detail. Spheroids were generated in a high-throughput manner using a non-adherent microchip system with pores as previously described [18–20, 26]. This technique allows the formation of high amounts of uniform sized spheroids in comparison with other techniques such as the hanging drop method and the use of spinner flasks [16, 21].
Monoculture spheroids were generated by seeding single cell human myoblasts in a non-adhesive microchip with round pores. Cell aggregation started approximately 3 h after cell medium complementation (6 h after initial cell seeding), resulting in spheroid shaped structures after 12 h. Remarkably, the myoblast spheroids only remained integer over time with the addition of ascorbic acid to the fusion medium, in either a low or high concentration. This was also reflected in the higher spheroid circularity values of the ascorbic acid containing conditions. High circularity values reflect better spheroid integrity due to more cell–cell adhesion or the formation of endogenous ECM. The decision to add ascorbic acid was based on earlier research reporting that the compound, serving as an anti-oxidant, benefits spheroid cell survival and stimulates the production of collagen as an ECM component, thus keeping the microtissues integer [33, 69, 70]. This was reflected in the live/dead analysis displaying slightly more cell death in the condition without ascorbic acid added to the fusion medium. Unfortunately, the addition of the anti-oxidant seemed to negatively influence the myogenic capacity of the spheroids, resulting in poor %NT values after 14 d of culture compared to fusion medium without ascorbic acid. In the control condition, myoblast fusion and cell proliferation continued when cells were involved in a spherical shaped structure, indicated by positively changing %NT values over time and TEM analysis displaying multiple nuclei per cell and multiple nucleoli per nuclei. Moreover, compared to the single cell condition, MHC1 and MHC8 were upregulated in the spheroids, whilst little to no expression of Myf5 and MyoD could be detected. Myf5 and MyoD are both considered as early myogenic markers. As where MyoD functions especially downstream from Pax7, Myf5 tends to act more in parallel with it. Myosin heavy chain isoforms, MHC1 and MHC8, are defined as myogenic differentiation markers [71]. The difference in expression of MHC1 and MHC8 indicates a tendency for more myogenic maturation in the spheroids compared to the single cell control.
To tackle the issue of ascorbic acid being needed for maintaining the spheroid's integrity, but having a detrimental effect on myoblast fusion, other possibilities were explored. The addition of a supportive cell type, such as fibroblasts or mesenchymal stem cells, has been shown to improve tissue-specific ECM deposition and the formation of spheroids [18, 72]. Moreover, by adding a supportive cell type, the tissue composition mimics the native tissue more accurately, since skeletal muscle tissue is not only composed of myofibers, but also of mesenchyme derived cells such as fibroblasts and adipocytes as well as endothelial cells [73]. Human ASCs are a widely used mesenchymal stem cell source for TE applications. Due to their self-renewal and differentiation capacities, paracrine functions and immunosuppressive character, these cells seem to play a key role in regenerative medicine [74, 75]. In addition, since it is a quite facile cell type to isolate, potential resides in a complete autologous tissue composition [76]. Consequently, integer co-culture spheroids consisting of human ASCs and human myoblasts were successfully generated using different ratios: 5/5, 2/8 and 1/9. This indicates that the addition of ascorbic acid to the fusion medium is no longer needed to retain spheroid integrity when adding a supportive cell source. The more human ASCs were added to the di-culture condition, the shorter the time-span of spheroid formation. Morphometric analysis revealed a general decrease in diameter over time, especially for the 5/5 and 1/9 condition. In the contrary, the diameter of the 2/8 condition remained stable starting from day 4 onwards, therefore we considered this ratio to be the optimal di-culture condition whilst not needing the addition of ascorbic acid to the fusion medium to maintain spheroid integrity. With the 1/9 condition coming close to the monoculture condition where no ascorbic acid was added to the fusion medium, cellular loss likely contributed to the spheroid diameter decrease. Moreover, circularity values lowered when adding more myoblasts. Indeed, HE staining showed loose cells in between the spheroids in the 1/9 condition indicating its inferior quality. The 2/8 condition displayed a morphology in which separate cells could be distinguished at the spheroids' periphery. Morphological analysis using MSB staining indicated the absence of collagen and a heterogenous character within and between individual spheroids. TEM analysis elucidated the development of ECM and proliferation capacity of incorporated cells, resulting in the presence of f.e. multivesicular bodies, nuclei containing multiple nucleoli and cells containing multiple nuclei. Self-developing compartmentalization, especially in the 5/5 condition, enforced the heterogenic character. This heterogeneity can be explained by the differential adhesion hypothesis stating that cells self-arrange to maximize adhesive bonds and minimize the free energy resulting in a unique morphology for each individual spheroid [13, 14]. When evaluating the myoblast fusion by performing a tropomyosin staining and calculating the %NT, the 2/8 and 1/9 condition reached higher values than the monoculture control condition. This confirms the hypothesis that the addition of supportive cells in a small percentage supports and improves the myogenic capacity. High variances in %NT values within the same condition denote once more the heterogeneity of co-culture spheroids. Seemingly, the addition of human ASCs as a mesenchymal cell source supports and stimulates the human skeletal myoblasts. The enhancing effect of mesenchymal stem cells on myoblast fusion and skeletal muscle regeneration was previously reported [77, 78]. Likewise, mesenchymal stem cells are required for homeostatic maintenance of skeletal muscle tissue [79].
When aiming for the engineering of macro constructs, the diffusion limits of oxygen and nutrients within a tissue should be brought into consideration. In most of the mammalian tissues, the common diffusion distance ranges from 10 to 30 μm. In fact, cells rarely exceed 200 μm as a maximum distance from the nearest capillary [80]. This means that cells in the core of a newly engineered macro construct will suffer from hypoxia and insufficient nutrient supply resulting in poor cell viability rates when no vascular network is incorporated. Vasculogenesis, de novo formation of blood vessels, as well as angiogenesis, the formation of blood vessels via sprouting or splitting from existing vasculature, are both of key importance when it comes to vascularization [81]. Nevertheless, tissue engineered macro constructs in clinically relevant sizes will range from mm to multiple cm. Thus, solely relying on the naturally occurring angiogenesis process after implantation will likely not be enough to reach through and keep the incorporated cells viable [62]. Therefore, pre-vascularization strategies are being studied. Some studies focus on the seeding of vessel-forming cells onto synthetic or natural decellularized matrix scaffolds, whilst others use the benefits of generating spheroids [82]. Vascular spheroids were generated by co-culturing HUVECs, human fibroblasts and human ASCs [18]. The same technique of co-culturing HUVECs and human ASCs was used for generating vascularized adipogenic spheroids [20]. Our study focused on extending the previously described mono- and di-culture myogenic spheroid set-up by co-culturing HUVECs, human ASCs and human myoblasts in two different tri-culture ratios (1/4.5/4.5 and 1/1.8/7.2). The first ratio was chosen based on previously reported data [18] whilst the second ratio was based on the optimal di-culture condition ratio (2/8). Both conditions resulted in the formation of integer spheroids during a 12 d culture period. Initial spheroid formation was faster for the 1/4.5/4.5 condition compared to the 1/1.8/7.2 condition. The same finding could be observed for the di-culture condition: the more human ASCs added to the co-culture condition, the more rapid the cell aggregation process. Tri-culture spheroids had an overall increase in diameter over time which is contrary to the general diameter decrease in the di-culture conditions. This increase in diameter was already observed in the first 48 h of cell assembly when comparing mono-, di- and tri-culture conditions. Diameter increase of tri-culture spheroids containing HUVECs and human ASCs has been formerly observed and it was suggested this was related to production of ECM components [18]. Also, it is known that when co-culturing human ASCs and endothelial cells a bidirectional synergistic effect occurs. Endothelial cells express paracrine factors that positively influence the proliferation capacity of human ASCs. In turn, human ASCs act like pericyte-like cells and start to express angiogenic factors (e.g. vascular endothelial growth factor (VEGF)) which stimulate endothelial cell proliferation and migration [83, 84]. Thus, the expression of more ECM components and the synergy between cell types can be underlying mechanisms to the increase in diameter and the faster formation of spheroids when higher amounts of human ASCs are being added. MSB staining to evaluate the morphology and ECM of tri-culture spheroids showed positive staining for collagen. Note that in the di-culture conditions no collagen deposition could be detected. qPCR for COL4 and COL8 confirmed the expression of collagen. Consequently, collagen production is stimulated by adding an endothelial cell component to the heterocellular spheroids, probably caused by a synergistic effect of all three cell types involved. However, the formation of endogenous ECM components in the spheroids can also lead to inhibition of cell motility and, thus, can influence the kinetics of fusion and differentiation processes [10]. The possible influence of endogenous ECM development on fusion and differentiation kinetics can be seen when analyzing the myogenic character of the tri-culture spheroids. Tropomyosin positive signal is especially seen at the peripheral part of spheroids. At the periphery myoblasts can benefit from the spaciousness for allowing fusion into myotubes. Moreover, due to ECM formation in the spheroids' center, the access to cell medium and oxygen is also more prominent at the periphery since spheroid sizes increased. In addition, the formation of capillary-like structures was evaluated. CD31+ staining could be observed after 4 d and was present throughout the whole culture period, even after switching from endothelial medium to muscle fusion medium. This indicates that endothelial cell networks are primarily formed in the first 4 d of spheroid culturing, supported by the endothelial cell medium. Although a decrease in %CD31+ area was seen between day 8 and 12, especially in the 1/1.8/7.2 condition. This decrease can be a response to the switch of cell culture medium from EGM2 to SkFM. CD31 and toluidin blue staining, as well as TEM analysis, displayed the formation of lumen-like structures, with co-presence of endothelial cell specific granules, in the center of spheroids. A possible explanation could be the occurrence of hypoxic conditions in the center of spheroids. The vascular network is one of the first systems sensing low oxygen conditions leading to a cascade of cellular signals aiming to circumvent the negative influence of hypoxia. One of the main processes is the activation of hypoxia inducible factors resulting in endothelial cells and pericytes expressing angiogenic genes [85]. Also, more CD31+ staining was displayed in the tri-culture condition with a higher amount of myoblasts added. A possible reason could be found in the interaction between the myogenesis and angiogenesis processes. Endothelial cells and myogenic precursor cells interact through the secretion of three effectors: apelin, oncostatin M and periostin. Both cell types benefit from privileged interactions resulting in endothelial cells stimulating the growth of myogenic precursor cells, whilst this last cell type exhibits angiogenic-like properties [86, 87]. Moreover, VEGF and its receptors, Flk1 and Flt1, are not only being expressed by endothelial cells, but also in quiescent myoblasts and regenerating muscle fibers. VEGF expression is required for the angiogenesis and vasculogenesis process, as well as for the response mechanism of skeletal muscle tissue to exercise and modulation of skeletal myoblast fusion [88]. Therefore, VEGF has a conspicuous role in vascularization of myogenic tissue [89]. The formation of myogenic spheroids containing capillary-like structures in our work, demonstrates the synergistic effect of co-culturing HUVECs, human ASCs and human myoblasts.
Efficient formation of connected myotubes requires myoblasts to be close to one another. Culturing myoblasts as spheroids already stimulates this behavior. Although, for further formation of myotubes and maturation into myofibers, it is necessary that myogenic spheroids also fuse together allowing the formation of macro sized constructs. Earlier research on chondrogenic spheroids indicated the importance of spheroid maturation prior to further use on the end morphology of the tissue construct [19]. It was reported that for mimicking the chondrogenic phenotype most optimally, articular chondrocyte spheroids should be cultured until a late maturation stage was reached. The optimal maturation stage for (vascularized) myogenic spheroids prior to allowing fusion into larger constructs remains unknown. In this study, monoculture and tri-culture spheroids were cultured up to different maturation stages (1, 3 and 10 d) prior to allowing fusion. Monoculture fused doublets appeared to be smaller compared to tri-culture doublets after 48 h of fusion for all maturation stages. Also, the maturation stage of spheroids prior to allowing fusion had more impact in the monoculture condition. The initial and post-48 h fusion doublet diameter of monoculture spheroids was the highest in the early matured condition and decreased corresponding more maturation. These findings indicate the importance of spheroid maturation stage and its influence on the tissue properties. On the contrary, the maturation stage of tri-culture spheroids did not seem to highly impact the initial doublet diameter. A possible explanation could be the presence of contractile forces of maturing myoblasts and the development of a contractile apparatus over time influencing spheroid doublet compaction. Since monoculture spheroids only contain human myoblasts, the formation of the contractile apparatus could be accelerated compared to the tri-culture condition containing fewer myogenic cells. It was shown that the appearance of sarcomeres during skeletal muscle recovery indeed depends on the presence of an adequate amount of myoblasts [90]. In line with the increase in tri-culture spheroid diameter over time, after 48 h of fusion the average doublet diameter of the tri-culture condition was higher compared to the monoculture condition. Early development of endogenous ECM in the tri-culture condition due to the synergistic effect of co-culturing HUVECs, human ASCs and human myoblasts can increase spheroid size and doublet diameter. As for the contact angle, which approaches 180° as fusion is allowed, an increase was observed over time for both the mono- and tri-culture conditions and for all maturation stages. Fusion of tri-culture spheroids happened mainly in the first 12 h whilst monoculture spheroids require 24 h to reach a similar fused spheroid morphology. In literature, the fusion rate of monoculture spheroids (cardiac myocytes) and co-culture spheroids (cardiac myocytes and cardiac fibroblasts) was compared as well. It was shown that the addition of fibroblasts, as a supportive cell source, indeed facilitated spheroid fusion leading to a higher fusion pace for co-culture spheroids [91]. Furthermore, co-culture spheroids consisting of smooth muscle cells and endothelial cells completed doublet fusion in 8–12 h [28]. Since the average contact angle of doublets after 24 h in this study did not seem to differ much between conditions, it is concluded that both conditions and all maturation stages still allow fusion of spheroids as long as enough time is provided.
As the development of extended vasculature is also of importance when working towards a macro tissue, endothelial cell sprouting from the spheroid shape should be possible. Upon activation of quiescent endothelial cells by expression of VEGF, endothelial cells evolve into tip cells. This migratory cell type not only activates adjacent endothelial cells in becoming stalk cells which keep dividing, it also guides the sprout towards mitogenic gradients [92]. General sprouting angiogenesis assays are mostly performed for only 24–48 h in a supportive hydrogel such as collagen or fibrin [93]. In this study, tri-culture spheroids were encapsulated in a fibrin gel and sprout formation was evaluated over time. Fibrin is known to promote angiogenesis by triggering and supporting the formation of endothelial networks with longer and more branched sprouts [94, 95]. In addition, it is reported that fibrin allows the formation and alignment of myotubes [5, 65, 96]. Extension of follow-up time up to 10 d instead of the more conventional 24–48 h follow-up was conducted for future perspectives to be able to time the formation of myotubes with an extended vasculature development. As a result of this experiment, HUVECs sprouts emerged from the spheroids starting from the first day amongst sprouts of other cell types. The maximum amount of HUVEC sprouts and HUVEC sprout length is reached after being exposed to EGM-2 for 4 d. When EGM-2 is switched to fusion medium, deterioration of HUVECs sprouts was observed. Sprouts emerging from the other cell types remained present. This indicates the importance of medium composition in co-cultures.
5. Conclusion
The aim of the present study was to biofabricate myogenic spheroids consisting of human skeletal myoblasts in a high-throughput manner. The addition of ascorbic acid to the fusion medium improved spheroid integrity, but counteracted the fusion of myoblasts. Adding human ASCs in a co-culture set-up improved spheroid integrity, enhanced formation of ECM and supported myogenic capacity. A pre-vascularization strategy was applied by adding HUVECs to the co-culture set-up. Tri-culture spheroids allowed the formation of capillary-like structures and a more extended ECM with collagen production, whilst retaining the spheroid myogenic capacity. In addition, when encapsulated in a hydrogel, HUVECs sprouting from the spheroid shape was allowed. The suitability of myogenic spheroids containing endothelial cells serving as building blocks to generate macro tissues, whether or not in the presence of a biomaterial, was approbated by successful doublet fusion. Although, further research concerning the formation of aligned myotubes is needed when aiming for myogenic macro tissue engineering.
In conclusion, this present study displays the high-throughput generation of uniform myogenic microtissues containing capillary-like structures. Moreover, the relevance of the 3D tissue environment, with tissue-specific microarchitecture, makes it a suitable tool for in vitro drug-testing and human disease modeling. Preceding using this method for skeletal muscle macro tissue engineering, further research needs to be performed.
Acknowledgments
This research is supported and funded by KU Leuven (Internal Funds KU Leuven STG/19/016)
Data availability statement
All data that support the findings in this study are included within the article (and any supplementary files).
Conflict of interest
The authors declare having no conflicts of interest.
Supplementary data (0.2 MB PDF)