
Abstract
In recent years, engineering biomimetic cellular microenvironments have been a top priority for regenerative medicine. Collagen II, which is arranged in arches, forms the predominant fiber network in articular cartilage. Due to the shortage of suitable microfabrication techniques capable of producing 3D fibrous structures, in vitro replication of the arch-like cartilaginous tissue constitutes one of the major challenges. Hence, in the present study, we report a 3D bioprinting approach for fabricating arch-like constructs using two types of bioinks, gelatin methacryloyl (GelMa) and silk fibroin-gelatin (SF-G). The bioprinted SF-G constructs displayed increased proliferation of the encapsulated human bone marrow-derived mesenchymal stem cells compared to the GelMA constructs. Biochemical assays, gene, and protein expression exhibited the superior role of SF-G in forming the fibrous collagen network and chondrogenesis. Protein-protein interaction study using Metascape evaluated the function of the proteins involved. Further GeneMANIA and STRING analysis using Col 2A1, SOX 9, ACAN, and the genes upregulated on day 21 in RT-PCR, i.e. β-catenin, TGFβR1, Col 1A1 in SF-G and PRG4, Col 10A1, MMP 13 in GelMA validated our in vitro results. These findings emphasized the role of SF-G in regulating the Wnt/β-catenin and TGF-β signaling pathways. Hence, the 3D bioprinted arch-like constructs possess a substantial potential for cartilage regeneration.
Export citation and abstract BibTeX RIS

Original content from this work may be used under the terms of the Creative Commons Attribution 4.0 license. Any further distribution of this work must maintain attribution to the author(s) and the title of the work, journal citation and DOI.
1. Introduction
Three-dimensional (3D) bioprinting is an appealing technology in modern scientific research that continues to promote ground-breaking innovations in regenerative medicine applications. However, the biomimicry degree of the fabricated clinically relevant 3D-engineered structure or the composition of the most optimal bioink for functional tissue regeneration are still open challenges. For example, there are numerous studies on bioprinted cartilage [1–3], where the bioink-containing cells have been deposited layer-by-layer in a wood-pile pattern (0°–90° alignment). These bioprinted structures have been mainly used to study the gene expression or the histological alignment of cells; nevertheless, limited studies have tried to replicate the architecture of collagen II in articular cartilage [4, 5]. Hence, it becomes essential to understand how selecting a suitable bioink to simulate the specific geometry/architecture of collagen II will help to impart distinct functionality toward better chondrogenesis.
Engineering articular cartilage tissue comes with a significant challenge. This involves the fabrication and optimization of a 3D cellular environment able to induce certain constituents essential for cellular viability, conservation of cell phenotype, initiation of (re)differentiation, fabrication of cartilage-specific extracellular matrix (ECM), and preservation of the ECM within the construct [6]. The different ECM constituents and their related organization often serve as indicators for cartilage tissue engineering strategies, aiming at replicating the various developmental stages of articular cartilage, and hence the fabrication of functional tissue constructs [7]. However, bioprinted constructs cannot completely replicate the hierarchical organization of the native articular cartilage. Although the precise level of resemblance needed for engineering a wholly functional tissue is still unknown [8], it has been observed in a few studies that regulating the architecture of the fabricated biological constructs while printing is a promising strategy to bridge the gap between the native and the bioprinted construct [8, 9]. One mechanism in developing human embryonic tissue involves phenotypically identical cells experiencing self-assembly to produce a specific domain [10]. More research needs to be done on how bioink and fabrication design elements can generate in vitro tissue patterning and anatomically meaningful tissue organization. Hence, whether the cells entrapped within the polymer materials during printing in a specific geometry interact with the bioink and undergo self-organization remains an unexplored area of research.
Even though a wide array of bioinks have been investigated for the engineering of articular cartilage tissue, there is still a feeble understanding of the role played by these biomaterials in regulating various molecular signaling pathways during in vitro chondrogenic differentiation [11]. In this regard, silk fibroin-gelatin (SF-G) has already been shown to intrinsically stimulate the Wnt pathway in primary chondrocytes and mesenchymal progenitor cells [10]. Another unique feature of the SF-G bioink is that it aids in abating hypertrophy during chondrogenesis [1, 12, 13]. In addition to SF-G, gelatin methacryloyl (GelMA) has also demonstrated promising results as a bioink for cartilage bioprinting and is nowadays frequently used in many bioprinting applications. It has assisted in producing cartilage-like matrix and tissue formation in chondrocytes and mesenchymal stem cells (MSCs) [14–16]. A high polymer concentration is required for printing with GelMA, and ink and nozzle temperature precision are crucial in achieving a desirable printed construct owing to its low viscosity [17]. In the presence of a photoinitiator and UV light with a suitable wavelength, GelMA precursor experiences a radical polymerization resulting in the formation of a covalently cross-linked hydrogel [15]. Although GelMA has been used extensively for cartilage bioprinting, it remains unclear whether it triggers any signaling pathway during chondrogenic differentiation. Hence, it would be highly intriguing to study whether GelMA plays any role in modulating cartilage signaling pathways.
Collagen II, which forms the predominant fiber network in articular cartilage, is organized into arch-like layers and divided into three zones, namely the tangential or superficial zone, the transitional or middle zone, followed by the basal or deep zone [18]. Cartilage tissue attains its distinct and complex mechanical characteristics from this collagen fiber arch arrangement and proteoglycan aggregates intertwined in it [19, 20]. Once the cartilage tissue is laid during the developmental phase, articular chondrocytes have little or no capacity to replicate the collagen's overall architecture in case of an injury or any degenerative event [21]. Collagen content in native tissue is most concentrated in the superficial zone and diminishes further from the articular surface, resulting in an irregular distribution [22]. The force distribution that cartilage encounters in vivo, which results in an anisotropic arrangement in native tissue, is the cause of this zonal variance. The fibrils typically have lower dimensions close to the surface, with the mean fibril diameter in the superficial zone being 30–35 nm and in the deep zone 40–80 nm [23]. The mechanism of remodeling or regenerating the defective collagen architecture by the chondrocytes at the molecular and ultrastructural level is poorly understood. Collagen II organization in articular cartilage can be expressed mathematically in the form of arches [24, 25]. This arch-like macro architecture of collagen is accountable for the zonal appearance of the articular cartilage, which in a scanning electron microscope appears to be folding over the radial collagen fiber bundles [26]. An arch-like structure can be generated by a hypotrochoidal curve such that it has a more porous inner core, followed by a dense shell as the outer layer [4]. The unique feature of the chondrocytes in articular cartilage is that morphologically and biochemically, they can adapt themselves to the framework of the surrounding microenvironment [27]. Therefore, instead of following a classical wood-pile pattern, we hypothesized that an arch-like pattern of the cell-laden bioprinted construct might aid in producing an anatomically relevant structure, approaching the collagen II architecture in articular cartilage. In past studies, we have shown the significance of scaffold architecture [4, 5] as it directs and impacts the development of cartilaginous tissue [28]. Moreover, our previous study [5] has established the significance of arch-like design in improving mechanical strength and chondrogenesis compared to the traditional wood-pile pattern. Hence, it would be important to decipher the effect of using such architecture and study the role of the bioink formulation in bioprinting approaches.
Here, we report a comparative study using SF-G and GelMA laden with human bone marrow MSCs (BM-MSCs) as a bioink for bioprinting to provide the optimum culture conditions towards cell chondrogenic differentiation. The cellular morphology and collagen expression change between the SF-G and GelMA construct when human BM-MSCs encapsulated within these hydrogels were printed in an arch-like orientation was investigated and compared with the traditional wood-pile pattern. Precisely, we have focused on the following objectives: which of the two bioinks (SF-G or GelMA) employed in our study is more effective at promoting chondrogenic differentiation in gene and protein expression. Hypertrophic differentiation during articular cartilage development is a significant challenge [29]. Hence, gene expression analysis using hypertrophic markers such as Col 10A1, MMP 13, and protein expression was performed to ascertain which bioink helps abate hypertrophy during articular cartilage development. Although SF-G has been well established in regulating the Wnt/β-catenin and TGF-β signaling pathway [10, 11], whether GelMA plays any role in regulating this and other signaling pathway remains inexplicable. Further, we analyzed which bioink produced a better fibrous collagen network of ECM when printed in this specific design. To the best of our knowledge, this is the first study comparing the effect of different bioinks towards mimicking the collagen II architecture of articular cartilage by printing it in an arch-like pattern.
2. Experimental section
2.1. Materials
Bombyx mori cocoons were benevolently provided by Central Silk Technological Research Institute (Central Silk Board), Bangalore, Ministry of Textiles, Government of India, and GelMA was obtained from Sigma (bloom 300, degree of substitution 60%, 900 622). Details of all other reagents used in the study are mentioned, along with the experimental method.
2.2. Cell culture and expansion
Human BM-MSCs (Donor d8011L, female, age 22) were procured from Texas A&M Health Science Centre, College of Medicine, Institute for Regenerative Medicine [30]. The cells were expanded at a density of 5000 cells cm−2 in a proliferation media comprised of Minimum essential medium alpha (α-MEM) supplemented with Glutamax (Gibco, USA) and 10% FBS (Sigma Aldrich), 1% (v/v) Ascorbic acid (Sigma Aldrich), 1% (v/v) penicillin-streptomycin (ThermoFisher Scientific), in a humidified environment at 37 °C and 5% CO2. The cells were used within passages 3–4 for all experiments. Subculture was done at 80% confluency.
2.3. Preparation of the bioink
In this study, two bioinks were formulated. GelMA hydrogel for bioprinting was prepared by dissolving 10% GelMA (w/v) (Sigma Aldrich) in PBS at 37 °C (determined by the highest printable concentration) and maintaining them at this temperature for around 2–2.5 h to form a homogenous solution. 0.25% (w/v) of the photoinitiator lithium phenyl-2,4,6-trimethyl-benzoyl phosphinate (LAP) (Sigma-Aldrich) was then added to the solution [31]. The resultant solution was briefly vortexed and sterile-filtered before use.
The SF solution from Bombyx mori was extracted following the protocol described elsewhere [3, 32, 33]. The SF-G blend was formulated by dissolving 8% of the gelatin (G) from porcine skin type A (Sigma-Aldrich) in autoclaved SF solution (5%). Briefly, 80 mg of the G powder was added to 800 µl of the SF solution, and the resultant mixture was then incubated in a water bath at 37 °C for 30 min. 100 μl of media supplement (10X α-MEM, Gibco) plus 10% FBS was added to the prepared SF-G blend to aid cellular activity. The cell-encapsulated bioink was prepared by adding 1 × 10⁷ cells ml−1 to the GelMA and SF-G hydrogel separately. Photo-crosslinking in the case of GelMA was achieved by exposing the constructs to UV light (365 nm, 700 mA) for 2 min post-printing. In the case of SF-G, 800 units ml−1 of mushroom tyrosinase (Sigma-Aldrich) was added to the bioink before printing to initiate cross-linking.
2.4. Preparation of 3D bioprinted constructs
As described before [5], a custom-written Python code (Python Software Foundation, Version 3.7.0) was produced to design the bioprinting pathway. The X and Y coordinates were determined using a hypotrochoidal function (equations (1) and (2)) where R = the radius of the large circle, r = the radius of the rolling process, and d = the distance between the center of the rolling circle and the point which is traced. With the variables set at R = 10, r = 0.34, and d = 4. Afterwards, cut-off values were set at −5 to 5 in the X direction and greater than 8 in the Y direction to mark the construct's boundaries. After each hypotrochoidal layer, one meandering layer followed the construct's outline and had a fixed strand distance of 1000 µm. The hypotrochoidal layer was substituted with a meandering layer of the same tool pathway length as a control,
The human BM-MSCs laden GelMA and SF-G bioinks were gently loaded into the sterile 3 ml syringe fitted with a pneumatic piston. Air bubbles in the syringe were eliminated before gelling and then mounted on the pressure-based direct dispensing printhead of the Bioprinter (BioScaffolder 3.1, GeSiM, Germany). The optimal printing parameters were a pressure of 45 ± 10 kPa and a 200 mm min−1 speed. A microcapillary nozzle of 200 µm (Nordson® EFD® Tapered Tip, 27 ga TT) was used to print all the constructs. The final 3D-printed structure was composed of seven layers. In the case of SF-G, printing was carried out 20 min after adding mushroom tyrosinase to achieve an appropriate initial degree of reticulation.
The human BM-MSCs-laden GelMA constructs were transferred to non-adherent six-well plates (ThermoFisher Scientific) post-printing and photo-crosslinked for 2 min. In contrast, the SF-G constructs were kept for around 20–30 min at room temperature (RT) before their transfer into the six-well plate. The cells were initially allowed to expand in cell proliferation medium for 48 h, then replaced with the chondrogenic differentiation medium. The chondrogenic medium was composed of DMEM/F12 (Gibco) supplemented with Glutamax, 1% 100X of ITS (insulin-transferrin-selenium) liquid media supplement (Thermo Fischer Scientific), 40 μg ml−1 Proline (Sigma-Aldrich), 0.1 μM dexamethasone (Sigma-Aldrich), 37.5 μg ml−1 ascorbic acid (Sigma-Aldrich), 1% penicillin-streptomycin (Thermo Fisher Scientific), and 10 ng ml−1 TGF-β1 (PeproTech). The 3D bioprinted constructs were examined until day 21. The medium was changed on alternate days.
2.5. Field emission scanning electron microscopy (FE-SEM)
The bioprinted constructs on days 7 and 21 were fixed in 4% paraformaldehyde for 20 min, followed by two PBS washes. The fixed and the printed acellular constructs were first dehydrated in a graded ethanol series and then air-dried. Samples were then gold-sputtered (up to 15–20 nm thickness) employing an EMITECH K550X (UK) sputter coater set at 20 mA for 80 sec. The coated samples were imaged at varied magnifications using a JEOL JSM-7500 F (JEOL, Japan) FE-SEM at an accelerating voltage of 5 kV. Image clarity and electrostatic distortion were improved in the case of FE-SEM compared to the conventional SEM.
2.6. Cell viability assessment of the 3D bioprinted constructs
Cell viability of the human BM-MSCs laden 3D bioprinted constructs was determined on day 14 by a live/dead assay kit (ThermoFisher Scientific). Three constructs of GelMA and SF-G were washed with PBS and then incubated with ethidium homodimer-1 (6 μM) and calcein-AM (4 μM) for 30 min at 37 °C, 5% CO2 in the dark. They were washed twice with PBS following incubation and then imaged using fluorescence microscopy (Nikon Eclipse Ti-S) to determine the viable (green) and dead (red) cells. ImageJ was used to count and analyze the number of live and dead cells, and cell viability was determined as the percentage of live cells to the total number of cells.
2.7. Biochemical analysis
2.7.1. Deoxyribonucleic acid (DNA) and glycosaminoglycan (GAG) estimation
For DNA quantification, constructs on days 7 and 21 were harvested, placed in Eppendorf tubes, snap-frozen in liquid nitrogen, and stored at −80 °C until further analysis. The constructs were then thawed at RT. The ECM was digested by a Proteinase K treatment. Samples were placed in 1.5 ml Eppendorf tubes and treated for 16 h at 56 °C with 250 ml of 50 mm Tris/1 mm EDTA/1 mM iodoacetamide solution containing 1 mg ml−1 Proteinase K. Following digestion, the samples were freeze-thawed thrice in liquid N2 to promote DNA extraction. DNA content was measured with a CyQuant cell proliferation assay kit (Thermofisher). Briefly, cellular RNA was degraded by incubating the samples in a lysis buffer containing RNase A for 1 h at RT. 100 µl of each sample (triplicates) were placed in a 96-well plate, and 100 µl of 2X GR-dye solution was added and left to incubate for 15 min at RT. A standard curve was prepared with a DNA standard solution, and fluorescence intensity was measured at an emission wavelength of 520nm (excitation wavelength of 480 nm). Samples from the Proteinase K digestion step were further utilized to measure GAG content using a 1,9-dimethyl-methylene blue zinc chloride double salt (DMMB, Sigma-Aldrich) solution (16mg l−1 DMMB). In brief, 150 µl of DMMB solution was mixed with 25 µl of sample and 5 µl of 2.3 M NaCl on a well plate with a transparent bottom, and the absorbance difference at 525 and 595 nm was measured. Data was compared to a standard curve obtained using chondroitin sulfate from shark cartilage [34].
2.7.2. Total collagen estimation
The total collagen content of the bioprinted constructs was measured using the Hydroxyproline assay [35]. Proteinase K-treated samples were hydrolyzed in 12 M HCl at 120 °C for 18 h. The content was then dried under a chemical safety cabinet at 55 °C for 48 h. The dried mass was reconstituted in H2O. 100 μl of the Chloramine T/Oxidation buffer mixture was added to each sample and standard, and incubated at RT for 20min. 100 μl of the diluted DMAB (4 Dimethylaminobenzaldehyde) reagent was added to each sample and standard, and incubated for 20 min at 60 °C. Absorbance was measured at 560 nm. Readings were corrected by subtracting the blank value from all readings. The amount of hydroxyproline in the samples was calculated based on the standard curve. According to reports [36], collagen contains 13% hydroxyproline, which translates to a hydroxyproline-to-collagen ratio of 1:7.69. This ratio was used for the estimation of collagen content.
2.8. Gene expression analysis
The bioprinted constructs were collected on days 1, 7, and 21. GelMA constructs were homogenized in 1 ml of trizol reagent (Invitrogen). In contrast, SF-G constructs were digested using 250 μg ml−1 protease XIV enzyme (Sigma) for 20 min at 37 °C to isolate the embedded cells. Cells were separated from the gel debris by centrifugation at 1200 rpm. Total RNA was extracted using RNeasy Minikit with on-column DNase treatment (Qiagen) according to the manufacturer's protocol. The quality and quantity of RNA were determined on a BioDrop μLITE+ (BioDrop, Cambridge, United Kingdom). cDNA was synthesized using at least 100 ng of total RNA, using the iScript cDNA synthesis kit (Bio-Rad) on a 20 μl reaction following manufacturer instructions. Owing to the low concentration of cDNA obtained from the constructs, a preamplification step was carried out using SSO Advanced PreAmp Supermix (Bio-Rad). A total volume of 10 μl with iQ SYBR Green Supermix (Bio-Rad) was used for the Quantitative PCR, along with 0.2 μM forward and reverse primers (table 1) and 3 ng cDNA and DEPC treated water. An equivalent volume of DNase and RNase-free water was used for no-RT controls. A CFX96™ IVD real-time PCR system (BioRad) was used, samples were incubated for 3 min at 95 °C, and the thermocycling was 15 sec at 95 °C and 30 sec at 58 °C for 39 cycles. GAPDH was used as a housekeeping gene. Relative gene expression was determined by the 2−ΔΔCt method. Monolayer human BM-MSCs at Day 0 (cultured without chondrogenic factors) were used as a comparator or control.
Table 1. List of genes analyzed using qRT-PCR.
| Gene name | Full name | Forward primer | Reverse primer |
|---|---|---|---|
| GAPDH | Glyceraldehyde-3- phosphate-dehydrogenase | ATGGGGAAGGTGAAGGTCG | TAAAAGCAGCCCTGGTGACC |
| MMP 13 | Matrix metallopeptidase 13 | CCAGACTTCACGATGGCATTG | GGCATCTCCTCCATAATTTGGC |
| Col 1A1 | Collagen type I alpha 1 chain | AGGGCCAAGACGAAGACATC | AGATCACGTCATCGCACAACA |
| Col 2A1 | Collagen type II alpha 1 chain | GGCAATAGCAGGTTCACGTACA | CGATAACAGTCTTGCCCCACTT |
| Col 10A1 | Collagen type X alpha 1 chain | GACTCCCTCCTCACTGTCGC | AGGGAAGTCTCCCTCACTTGT |
| ACAN | Aggrecan | AGGCAGCGTGATCCTTACC | GGCCTCTCCAGTCTCATTCTC |
| SOX 9 | SRY-box transcription factor 9 | TTCCGCGACGTGGACAT | TCAAACTCGTTGACATCGAAGGT |
| PRG4 | Proteoglycan 4, lubricin | CAGAGGTCTCTACTCCAACTACC | AGTCATTTCAGGTTTAGTCGCTG |
| CTNNB1 | Catenin beta-1/ β-catenin | CATCTACACAGTTTGATGCTGCT | GCAGTTTTGTCAGTTCAGGGA |
| TGFβR1 | TGF beta receptor 1 | ACGGCGTTACAGTGTTTCTG | GCACATACAAACGGCCTATCTC |
2.9. Gene analysis and construction of protein–protein interaction (PPI) network
Metascape (https://metascape.org/gp/index.html#/main/step1) was used to analyze gene set enrichment and annotation. We evaluated the functions of the chondrogenic and signaling genes used in the present study. PPIs among all input genes were fabricated from the PPI database to form a PPI network [37].
GeneMANIA (http://genemania.org/) is a web interface server that helps examine the target gene's co-expression, pathways, co-localization, and domain-protein similarity, apart from their genetic and protein relationships. This server was used to analyze and predict the PPIs of the differentially expressed genes used for the study [38].
STRING V 10.0, a database of known and predicted protein interactions (search tool for the retrieval of interacting genes/proteins), was used to investigate the interactions between proteins coded by the differentially regulated genes (http://string-db.org/). These interactions were studied to understand how the BM-MSCs encapsulated in the GelMA and SF-G constructs exhibited protein expression during chondrogenic differentiation [39].
2.10. Immunofluorescence
Day 7 and 21 constructs were collected and fixed with 4% paraformaldehyde for 30 min, followed by rinsing in PBS for immunofluorescence analysis. They were then permeabilized for 20 min in 0.1% Triton X-100 solution (Millipore Sigma) [40, 41]. After washing three times for 5 min each with PBS, blocking was done overnight in a solution of 3% BSA (Bovine Serum Albumin, Sigma-Aldrich) and 0.01% Triton X-100 in PBS. The next day the blocking buffer was removed, and GelMA samples were incubated overnight at 4 °C with mouse anti-collagen I (1:250) (ab23446, Abcam), rabbit anti-collagen II (1:250) (ab34712, Abcam), and mouse anti-collagen X (1:250) (ab49945, Abcam) primary antibodies. For SF-G, mouse anti-collagen I (1:250) (ab23446, Abcam), mouse anti-collagen II (1:5) (CIIC1-S, DSHB), and mouse anti-collagen X (1:250) (ab49945, Abcam) primary antibodies were used. The next day, the incubation was stopped, and the constructs were washed three times with 0.3% BSA and 0.01% Triton X-100 in PBS. Secondary antibodies anti-rabbit AlexaFluor 647 and anti-mouse AlexaFluor 488 (both from ThermoFisher Scientific) were added and incubated in the dark for 2 h at RT in PBS (1:200). This was followed by rinsing with PBS and staining with DAPI (1 μg ml−1) (Thermo-Fisher Scientific) in PBS for 30 min. After final rinsing with PBS, GelMA samples were observed under fluorescence microscopy (Nikon Eclipse Ti-S), image acquisition for SF-G was done by Leica SP5 (Leica Microsystems) inverted confocal laser scanning microscope.
2.11. Histological analysis
The bioprinted constructs were collected on days 7 and 21, washed with PBS, fixed in 4% paraformaldehyde for 1 h at RT, and then washed twice with PBS. They were then dehydrated in a sequential series of ethanol solutions, xylene treated and embedded in paraffin, and sliced into 6 µm sections. After rehydration with xylene and in ethanol series, the samples were stained with hematoxylin and eosin (H & E) to study the cell morphology. Representative images were captured for further analysis using the Leica software application suite (LAS V3.8) in the Leica DMi8 inverted microscope.
2.12. ELISA assay for collagen II
The levels of collagen II secreted by the bioprinted constructs were quantified via a colorimetric test using an ELISA kit for collagen II (Bioconnect diagnostics). Briefly, supernatant on days 1, 7, 14, and 21 was collected, and the test was performed following the manufacturer's protocol using a microplate reader (Tecan Infinite M200-Pro). Collagen II levels in the media were quantified against the kit standard curve. Experiments were performed in triplicates.
2.13. Statistical analysis
All data were presented as mean ± SD and evaluated with one-way ANOVA and Bonferroni's multiple comparison tests, with n denoting the number of different experiments. The differences were considered significant at p 0.05 (*), p 0.01 (**), p 0.001 (***), and p 0.0001 (****). Graph Pad Prism (5.01), San Diego, California, USA, was used for statistical analysis. Origin 2021 software from OriginLab was used for plotting the graphs.
3. Results
3.1. Morphological analysis of 3D bioprinted constructs
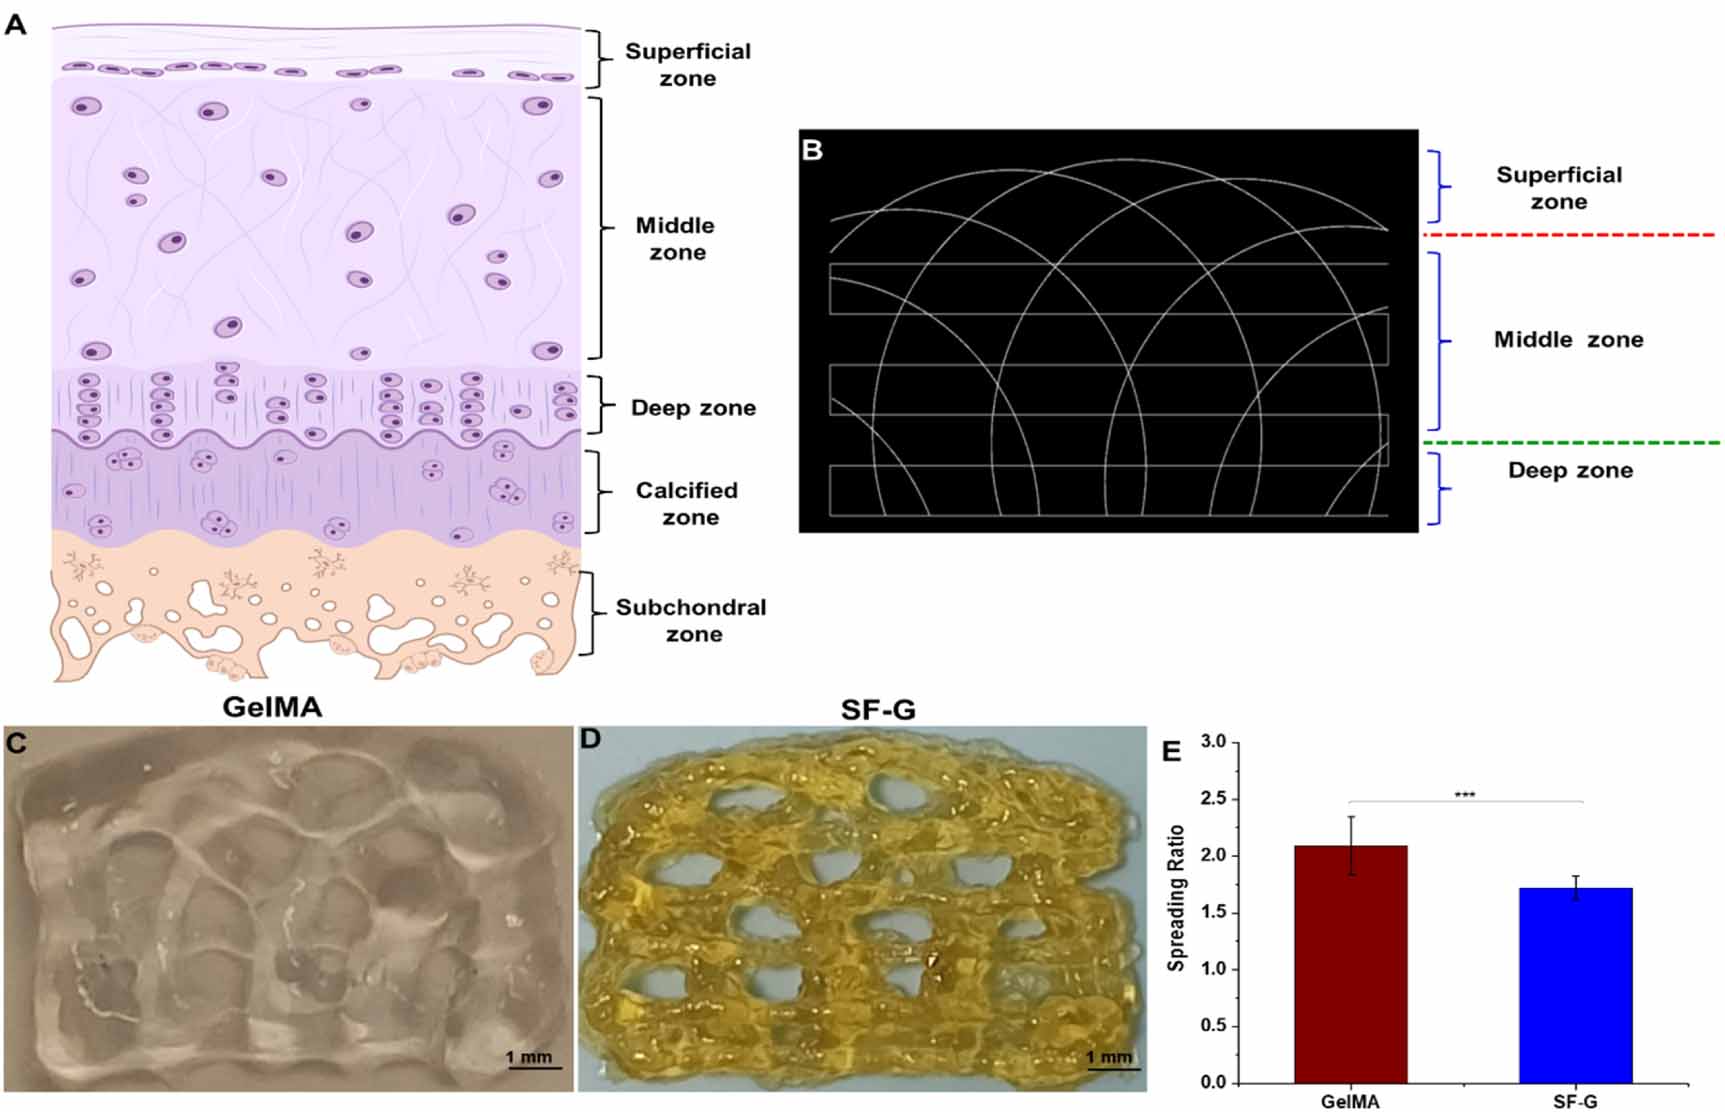
The final tool path was generated with the help of a Python script displayed in figure 1(A) using a G-code simulator representing the different zones of articular cartilage. Figures 1(B) and (C) show the arch architecture of the GelMA and SF-G constructs post-bioprinting. We then assessed the printability of each hydrogel. For every bioink, the filament spreading ratio defined as the printed filament's width divided by the needle's diameter was measured. SF-G exhibited the lowest spreading ratio (1.72 ± 0.104), whereas that observed with GelMA was 2.09 ± 0.25) (figure 1(E)).

Figure 1. (A) Different zones of articular cartilage. (B) The final tool pathway visualized in a G-code simulator representing the distinct zones in articular cartilage; (C) and (D) 3D bioprinted GelMA and SF-G constructs depicting the arch architecture. The collagen fiber bundles are in the sub-micron range, whereas the fiber diameter of the printed construct is in the micron range; (E) graphical representation of the spreading ratio (filament diameter/needle diameter) post bioprinting, data represented as mean ± SD significant at p < 0.001.
Download figure:
Standard image High-resolution imageFE-SEM was employed to investigate the morphology of the bioprinted acellular constructs and cells encapsulated within them at 7 and 21 days after chondrogenic differentiation (figure S1). The GelMA and SF-G acellular constructs exhibited the pores of the designed arch architecture (figures S1(A) and (B)). However, it should be noted that the dehydration steps involved during SEM processing might have resulted in the distortion of the structure. FE-SEM micrographs of the BM-MSCs encapsulated bioprinted constructs on days 7 and 21 during the chondrogenic differentiation displayed cell attachment to the scaffolds' surface. On day 7, cells were dispersed in the GelMA constructs (figure S1(C)). On day 21, although cells were evident in a distributed form, some also formed clusters in the scaffolds (figure S1(D)). Similar results were obtained with the SF-G constructs, where both clusters of cells and dispersed ones were visible on day 7 (figure S1(E)). Interestingly on day 21, the cells became more densely packed and in cluster condition with spherical morphology (figure S1(F)).
3.2. Assessment of cellular viability and migration in the 3D bioprinted constructs
A live-dead assay was carried out on day 14 to determine the viability of the BM-MSCs encapsulated in both GelMA and SF-G bioprinted constructs (figure 2). More live cells were evident between the constructs on the SF-G condition (figures 2(F) and (H)). A significant difference (p < 0.0001) in the percentage of viability was observed between the GelMA constructs (89.25%) and the SF-G constructs (91.16%) on day 14 (figure 2(I)).
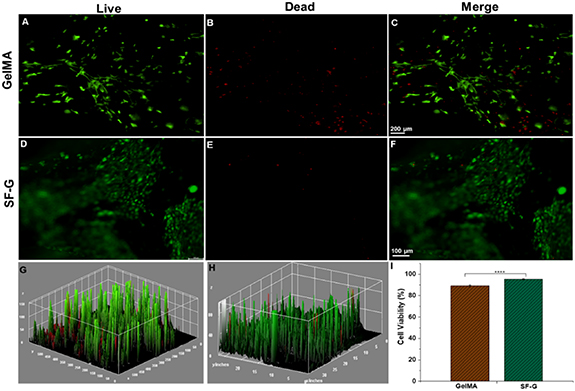
Figure 2. Live/dead assay of 3D bioprinted GelMA and SF-G constructs on day 14. Live cells are displayed in green (calcein AM) (A) and (D), and dead cells in red (ethidium homodimer) (B) and (E). Merged images (C) and (F) and the 3D interactive surface plot of GelMA and SF-G (G) and (H) display negligible dead cells on either of the bioprinted constructs. (I)The bar graph shows the cell viability of the BM-MSCs on day 14 for the GelMA and SF-G bioprinted constructs, significant at p < 0.0001(****).
Download figure:
Standard image High-resolution image3.3. Assessment of cell proliferation rate and biochemical assay
Quantitative evidence of cell proliferation was provided by estimating the DNA in the bioprinted constructs (figure 3). Both the GelMA and SF-G constructs exhibited comparable DNA values within 21 days of the chondrogenic culture (figure 3(A)). The highest DNA content was observed with the SF-G on day 7, which was significantly higher than the GelMA constructs at the same time (p < 0.0001). However, a decline in the proliferation rate was observed in both cases on day 21 of culture.
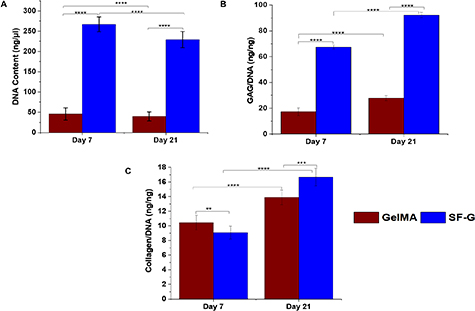
Figure 3. BM-MSCs encapsulated GelMA and SF-G bioprinted constructs on days 7 and 21. Showing (A)The total DNA content (ng μ−1). (B) Glycosaminoglycan (GAGs) content normalized to the DNA content (ng ng−1). (C) Collagen content normalized to the DNA content (ng ng−1), significant at p < 0.0001(****).
Download figure:
Standard image High-resolution imageAfter 7 and 21 days of culture, GAG deposition during the differentiation process was assessed by colorimetric quantification from the digested bioprinted constructs (figure 3(B)). After 3 weeks of culture, the levels of accumulated GAGs/DNA content increased in all experimental groups. This result specifies chondrogenic differentiation and the development of a cartilaginous matrix. The quantity of the normalized GAG content was lower on day 7 in both the bioprinted constructs and in the range of 17–67 ng ng−1 of DNA (p < 0.0001). However, there was a significant increase in the GAG content on day 21 (p < 0.0001), with SF-G constructs exhibiting the highest expression (92.3 ng ng−1 of DNA) compared to its GelMA counterpart (27.89 ng ng−1 of DNA) (p < 0.0001).
The total collagen content normalized to the DNA was also determined at the same time points in both constructs (figure 3(C)). At 3 weeks of culture, the total collagen production was highest in the SF-G bioprinted constructs (16.67 ng ng−1 of DNA). Although the GelMA bioprinted constructs exhibited a rise in the total collagen content with the culture period, it was less than its SF-G counterpart (p < 0.0001). Interestingly, on day 7 GelMA constructs displayed higher total collagen production (10.46 ng ng−1 of DNA) than the SF-G bioprinted constructs (9.07 ng ng−1 of DNA).
3.4. Gene expression profile
Articular cartilage differentiation was assessed by investigating the relative gene expression of the markers mentioned in table 1 after 1, 7, and 21 days of differentiation (figure 4). An increased expression in the case of SF-G bioprinted constructs was observed for the chondrogenic markers Col 2A1, SOX 9, and ACAN, compared to the GelMA ones. A significant 8.6-fold increase was observed in Col 2A1 expression levels in SF-G constructs on day 21, which was much more than that observed on day 1 (4-fold) (p < 0.0001). A similar trend was observed with ACAN and SOX 9 with an upregulated fold change of 7.9 and 12.7- on day 21 compared to that observed on day 1.
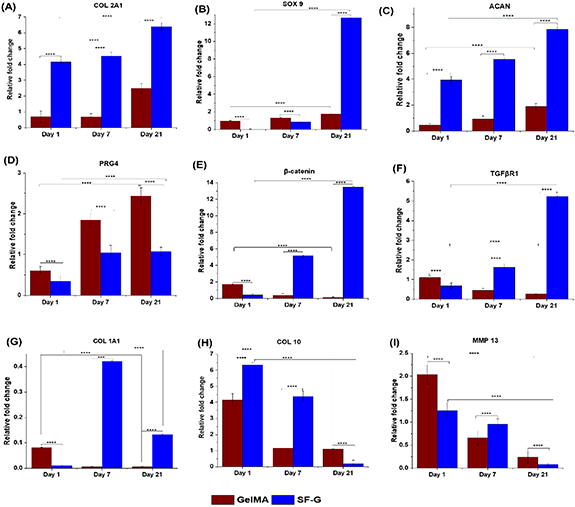
Figure 4. Relative gene expression analysis for BM-MSCs laden GelMA and SF-G bioprinted constructs depicting the expression of chondrogenic markers (COL 2A1, SOX 9, ACAN). Articular superficial zone protein (PRG4), signaling pathway markers (β-catenin, TGFβR1), de-differentiation marker (COL 1A1), and hypertrophy-specific markers (COL 10, MMP 13) on day 1, 7, and 21, significant at p < 0.05(*), p < 0.01(**), p < 0.001(***) and p < 0.0001(****).
Download figure:
Standard image High-resolution imagePRG4 expression, a definitive marker of articular cartilage cells [42], was the highest on day 21 (2.5-fold) in GelMA constructs, which generally displayed an increasing trend with culture time. SF-G constructs showed an increased expression on day 7 (1.2-fold), which continued on day 21. Overall, the bioprinted GelMA constructs manifested higher PRG4 expression than their SF-G counterparts (1.36-fold higher) on day 21.
We also assessed the expression of TGFβR1 and β-catenin on the bioprinted GelMA and SF-G constructs. A rising trend in the expression level of TGFβR1 was observed in SF-G constructs with increasing culture period, with the highest expression being 5-fold on day 21. However, the bioprinted GelMA constructs displayed an opposite trend with a downregulation in the expression with culture time, with expression levels less than 1-fold in all time-periods. An upregulated expression of β-catenin was conspicuous as the culture time progressed, with the highest expression of 13.5-fold observed on day 21 compared to day 1 (0.4-fold) (p < 0.0001). However, the GelMA constructs displayed an opposite trend with a downregulation in the expression with increasing time. On day 21, it showed a nominal expression (0.01), significantly less than that observed on day 1 (1.7).
Col 1A1 showed a low expression in SF-G constructs on day 1, with a sharp increase on day 7, and downregulated on day 21 (fold change less than 1). GelMA constructs showed a decline in Col 1A1 expression level on day 7 (from 0.81 on day 1–0.05-fold), which continued until day 21.
As the culture time increased, a diminishing trend in the expression of Col 10A1 and MMP 13, which are hypertrophic indicators, was seen in SF-G, for example, from 6.34-fold to less than 1-fold change in Col 10A1 at day 21. GelMA constructs also followed the same trend; however, the expression level was around 2-fold less than SF-G on day 1 (4.2-fold), which declined on day 7 and remained almost constant on day 21 (p < 0.0001).
3.5. PPI networks and projection of the co-existing proteins
Further, we established PPI using Metascape, a software that combines interactome analysis, gene annotation, and functional enrichment that was used for comprehensive enrichment analysis of all the differentially demonstrated genes [37]. The analysis results assisted in identifying the top biological processes connected with the input genes used in our study. The investigation revealed separate clusters of different ontology concepts. These analyzed results were depicted in the form of a heat map (figure 5(A)), where the highly enriched terms were related to GO:0060351: cartilage development involved in endochondral bone morphogenesis (−11, −log(P)), WP474: endochondral ossification (−13, log10(P)), GO:0001501: skeletal system development (−11.5, −log(P)), etc. The terms with a p-value of 0.01, a minimum count of 3, and an enrichment factor >1.5 (the difference between the observed counts and the counts expected by chance) were divided into clusters based on their membership similarities for each given list.
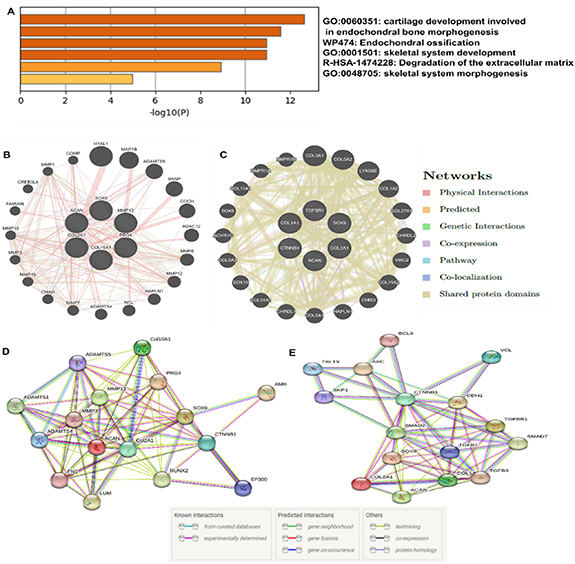
Figure 5. (A) Gene ontological enrichment heatmap by Metascape. (B) and (C) Prediction of protein-protein interaction using GeneMANIA in GelMA and SF-G, respectively. Lines with variable colors represent their relationships. (D) and (E) STRING protein-protein expression of the proteins in GelMA and SF-G constructs under chondrogenic differentiation.
Download figure:
Standard image High-resolution imageFrom the RT-PCR analysis, the genes that showed upregulated expression on day 21 were chosen for further analysis with GeneMANIA. This was done to recognize the predicted functional partners of the upregulated and downregulated genes studied (figures 5(B) and (C)) [38]. In the case of GelMA, Col 2A1, SOX 9, ACAN, PRG4, Col 10A1, and MMP 13 were selected for the analysis. Whereas in SF-G, Col 2A1, SOX 9, ACAN, CTNNB1, TGFβR1, and Col 1A1 were used. In both cases, the GeneMANIA database's prediction findings revealed that 20 proteins were related to the expressed genes, regulated differently in the present study. Some of the predicted functional partners observed in GelMA were ADAMTS5, the main aggrecanase involved in articular cartilage degradation, leading to osteoarthritis [43]. COMP gene, which interacts with other ECM proteins such as the collagens and fibronectin, contributes to cartilage's structural integrity [44]. Other genes, such as MMP 1 and MMP 3, were also observed. CHRDL-2, which acts as a cartilage ECM-associated protein, was found in SF-G [45]. SOX 8 is the earliest limb cartilage marker, and its induction occurs independently before BMP signaling is activated. SOX 10 is also shown to act as a functional partner that correlates with SOX 8 and SOX 9 to establish the digit cartilages [46]. Apart from these, CTNNBIP1 and TGFβR1 genes were also involved. The TGF-β pathway promotes early chondrogenesis while suppressing cartilage hypertrophy and breakdown [47].
An extensive degree of gene networking was discovered by ontological gene analysis using STRING among the same genes investigated using GeneMANIA (figures 5(D) and (E)). We observed the association of pathways linked to calcium-independent cell-matrix interaction, cartilage condensation, embryonic skeletal joint morphogenesis, positive regulation of mesenchymal cell proliferation, chondrocyte development, developmental induction, cartilage development involved in endochondral bone morphogenesis, endochondral ossification in case of GelMA (tables S1(A) and (B)). Whereas in SF-G, cartilage condensation, cartilage development involved in endochondral bone morphogenesis, positive regulation of mesenchymal cell proliferation, developmental induction, chondrocyte development, chondrocyte differentiation, ECM organization, embryonic organ morphogenesis, regulation of canonical Wnt signaling pathway was observed with a group of 4–5 genes involved per pathway (tables S2(A) and (B)).
3.6. Immunofluorescence analysis
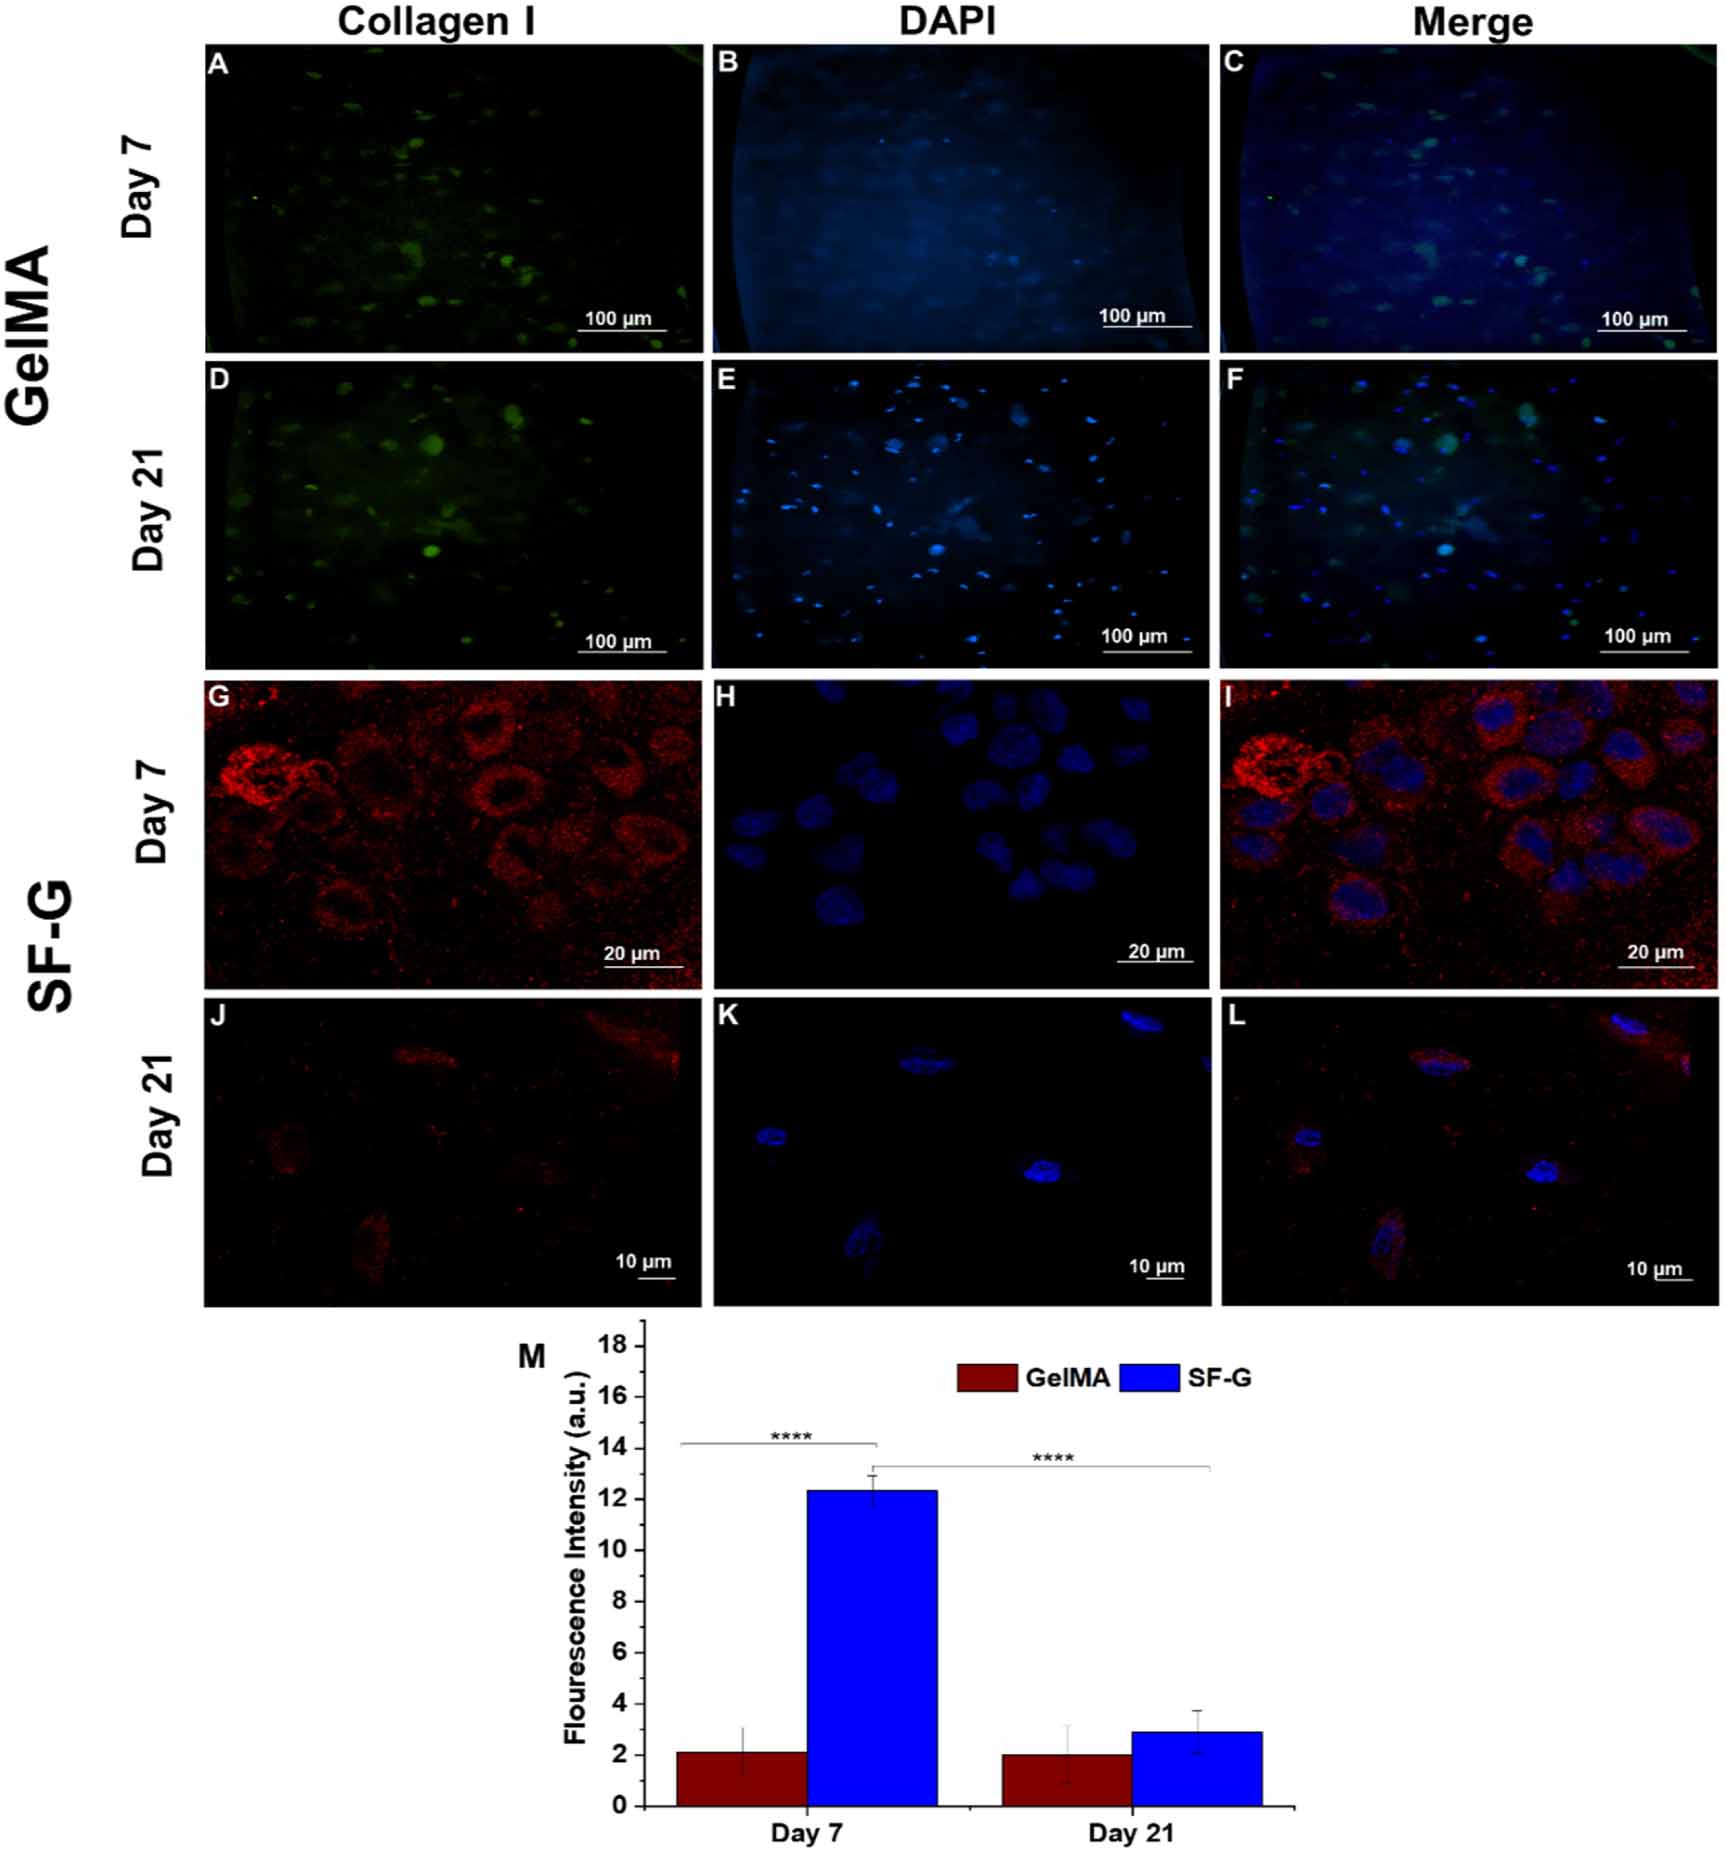
Immunofluorescence analysis was conducted on days 7 and 21 to assess the deposition of specific collagens under chondrogenic differentiation culture conditions (figures 6–8). Bioprinted GelMA constructs on day 7 exhibited intracellular expression of collagen I (figure 6(C)), but the expression in SF-G was extracellular (figure 6(I)), with cells displaying distinct round morphology. It is important to note that there was not much difference in the expression levels in GelMA bioprinted constructs on day 21 compared to day 7 (figures 6(C) and (F)). Whereas in SF-G, the intensity of collagen I was relatively higher on day 7 than on day 21 (figures 6(I) and (L)), which was in accordance with our gene expression findings.
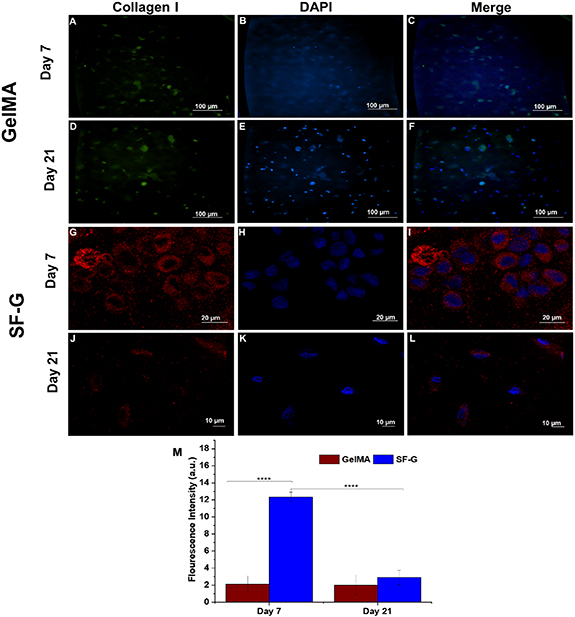
Figure 6. Immunofluorescence analysis depicting the protein expression of Collagen I in the GelMA (A)–(F) and SF-G (G)–(L) bioprinted constructs on days 7 and 21; (M) Fluorescence intensity comparison graphs. Data represented as mean ± SD, significant at p < 0.0001.
Download figure:
Standard image High-resolution imageConcerning the expression of the chondrogenic differentiation protein collagen II, collagen fibrils were found uniformly distributed around the cells in SF-G, which were parallelly oriented following three weeks of chondrogenic differentiation (figure 7(L)). An enhanced expression was noticeable on day 21 in both GelMA and SF-G (figures 7(F) and (L)), compared to day 7 (figures 7(C) and (I)), where the expression level was nominal. Interestingly, the expression levels on day 21 in SF-G were relatively higher than GelMA constructs and were extracellular, which further validated our gene expression results.
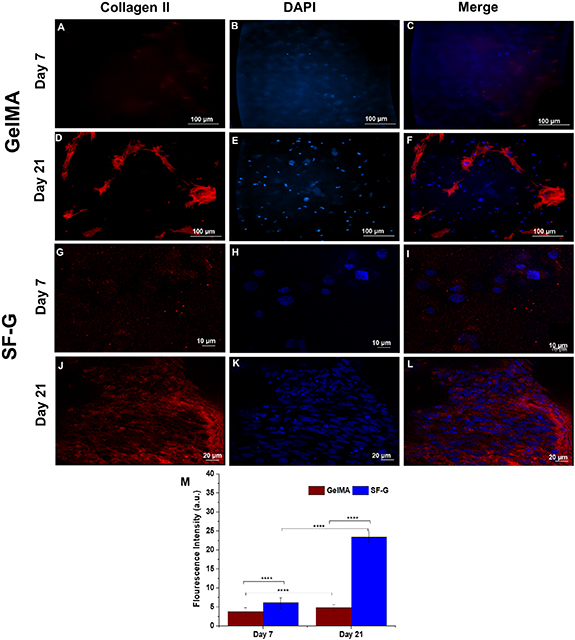
Figure 7. Immunofluorescence analysis depicting the protein expression of Collagen II in the GelMA (A)–(F) and SF-G (G)–(L) bioprinted constructs on days 7 and 21; (M) Fluorescence intensity comparison graphs. Data represented as mean ± SD, significant at p < 0.0001.
Download figure:
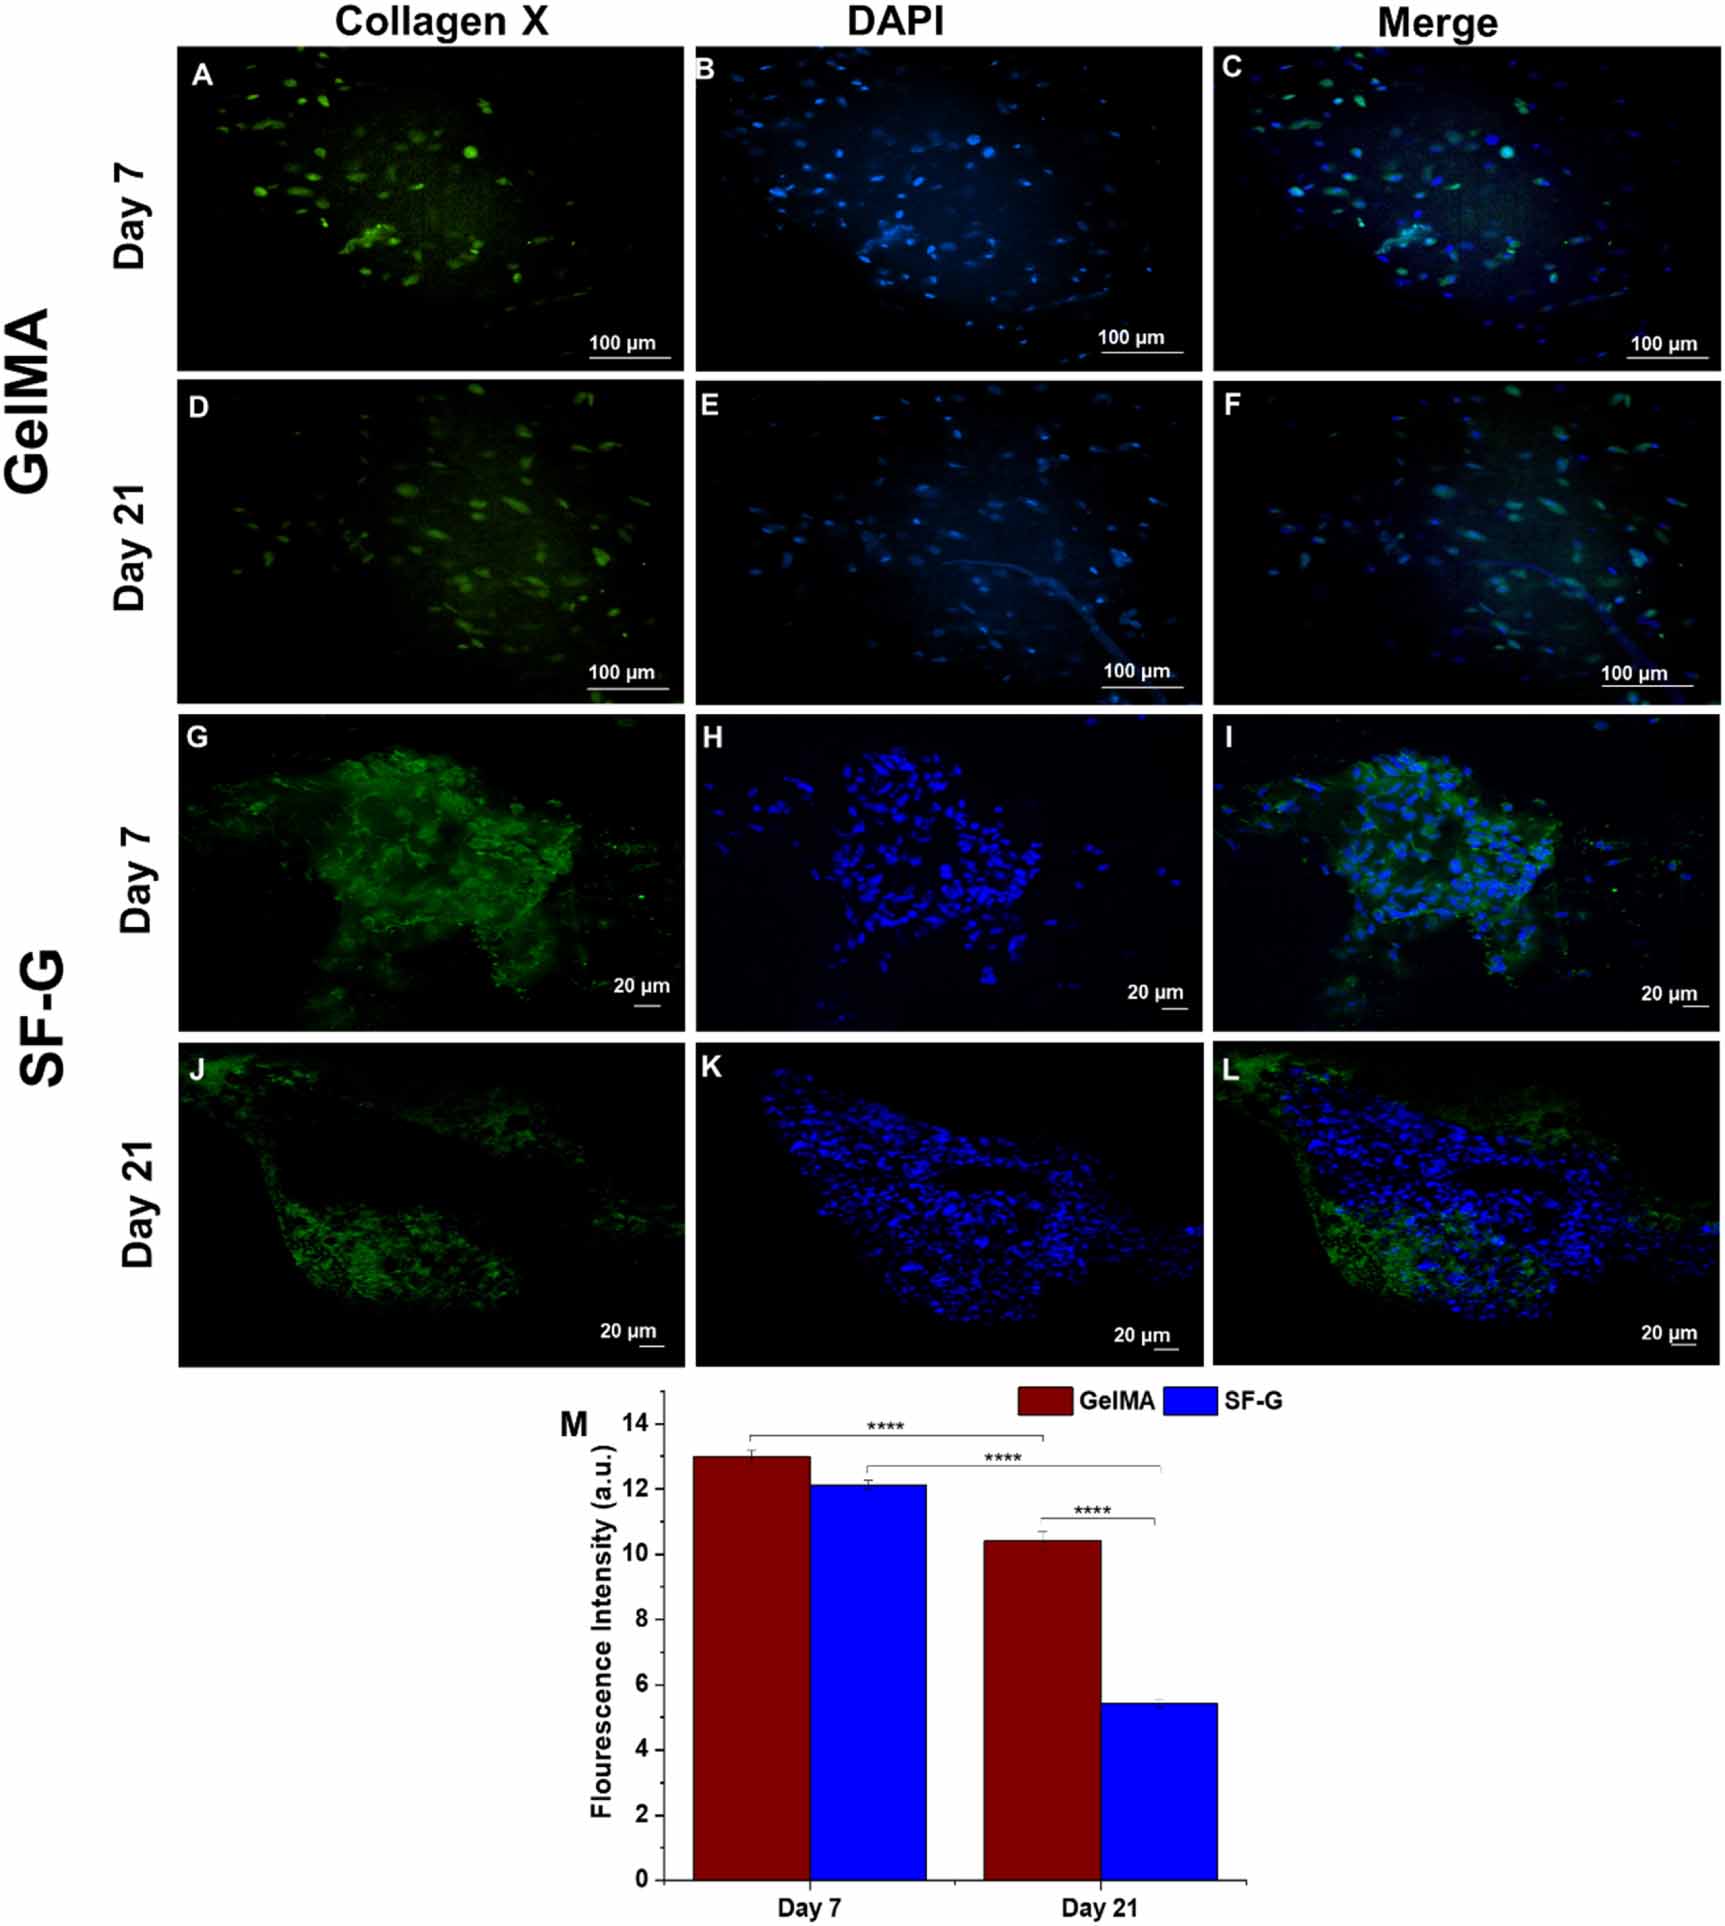
Standard image High-resolution imageCollagen X, a marker of cellular hypertrophy, manifested indistinguishable expression on days 7 and 21 in the GelMA constructs (figures 8(C) and (F)). Although the expression levels were noticeable then, it was predominantly intracellular on day 7. The cells inside the constructs had an elongated morphology, not typical of the chondrocytes in hyaline cartilage. Although the SF-G constructs displayed increased collagen X expression on day 7 (figure 8(I)) than the GelMA, the expression level decreased on day 21 (figure 8(L)). Notably, the collagen fibers showed uniform distribution on day 7 in SF-G, which became somewhat dispersed on day 21.

Figure 8. Immunofluorescence analysis depicting the protein expression of Collagen X in the GelMA (A)–(F) and SF-G (G)–(L) bioprinted constructs on days 7 and 21; (M) Fluorescence intensity comparison graphs. Data represented as mean ± SD, significant at p < 0.0001.
Download figure:
Standard image High-resolution image3.7. Histological analysis
Histological staining was used to further examine the cell morphology and cartilaginous matrices production by the BM-MSCs after 7 and 21 days of chondrogenic differentiation in the GelMA and SF-G constructs (figure S2). The GelMA constructs showed a sparse distribution of cells on days 7 and 21, although of round or spherical morphology (figures S2(B) and (D)). The SF-G constructs exhibited a homogenous distribution of BM-MSCs, and some cells displayed a spread morphology on day 21 (figure S2(H)). While those on day 7 manifested round morphology akin to those of chondrocytes (figure S2(H)).
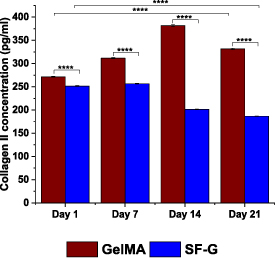
3.8. Quantification of collagen II using ELISA
ELISA was carried out to estimate the amount of secreted collagen II in the culture medium under chondrogenic differentiation from both constructs at different time points (figure 9). The secretion of collagen II from GelMA and SF-G constructs was 271.5–381.5 pg ml−1 and 186.5–256.5 pg ml−1, respectively. With an increase in the culture period, an enhancement in the collagen II levels in the media was observed in the GelMA constructs until day 14; however, on day 21, there was a sharp decline in the levels with a drop from 381.5–331.5 pg ml−1. The levels were much higher than that observed on day 1 (p < 0.0001). The SF-G constructs exhibited an opposite trend to that observed with the total collagen estimation by hydroxyproline assay. Although a slight increase in the collagen II level was observed on day 7, it continued to drop until day 21, with the quantity becoming 186.5 pg ml−1 compared to that secreted on day 1 (251.5 pg ml−1) (p < 0.0001).
Figure 9. ELISA analysis for secreted collagen II in the culture media of the BM-MSCs encapsulated GelMA and SF-G bioprinted constructs on day 1, 7, 14, and 21, significant at p < 0.05 (*), p < 0.01 (**), p < 0.001 (***) and p < 0.0001 (****).
Download figure:
Standard image High-resolution image
4. Discussion
The basis of fabrication of next-generation tissue engineering constructs involves the precise recreation of the 3D hierarchical complexities of the ECM, as well as simulating the architecture, mechanical characteristics, and biochemical gradients of the native tissue [48, 49].
Towards that end, in the present study, we reported the fabrication of a 3D bioprinted hypotrochoid construct that mimics the zonal architecture of the collagen network in articular cartilage. To determine whether a biomaterial exhibits greater chondrogenesis when bioprinted in a specific architecture (arch-like design), two kinds of bioinks, GelMA and SF-G, were utilized instead of the standard 0°–90° alignment.
Several bioinks have been investigated for 3D bioprinting of cartilage; for example, Abbadessa et al fabricated methacrylated pHPMA-lac-PEG hydrogels (a thermoresponsive triblock copolymer) [50]. It was established that adding polysaccharides, such as methacrylated chondroitin sulfate or methacrylated hyaluronic acid, could enhance the mechanical characteristics, stability, and printability of the hydrogel-based structures. GelMA hydrogels have displayed promising cartilage regeneration results due to their adaptable mechanical properties and ability to simulate the native cartilage matrix [51]. Besides, stem cell attachment, proliferation, and chondrogenic differentiation due to their remarkable cytocompatibility make them suitable candidates for cartilage tissue engineering [52]. Similarly, SF has the potential to serve as a supporting matrix owing to its characteristic of enabling cell adhesion, proliferation, and surface chemistry for a variety of cell types, including chondrocytes [53]. Previous studies [1, 12] have shown that the SF-G bioink laden with BM-MSCs exhibited around 80% cell viability up to 40 days post-printing. The SF-G bioink has been used to develop 3D bioprinted cartilage, which assisted in abating hypertrophy [1, 12, 13]. Owing to these properties, we have selected GelMA and SF-G bioinks, loaded with BM-MSCs, for printing in an arch-like fashion and directing the cells toward chondrogenic differentiation.
Morphological analysis of 3D-printed hydrogel-based constructs is crucial since it plays a major role in investigating their surface texture, size, and internal structure [54]. We determined the morphology of our printed constructs using FE-SEM. However, the SEM approach for evaluating hydrogel constructs has several constraints primarily linked to sample preparation. As it is well known that hydrogel-based constructs' have high-water content, dehydration steps can expedite the shrinkage and densification of the printed constructs [55, 56]. This might be one of the probable reasons for the distortion of our designed arch architecture in the bioprinted constructs. The precision of the extruded fibers determines how accurate a 3D-printed construct will be. Theoretically, the diameter of the extruded fiber should be equal to the inner diameter of the extrusion needle [57]. Although not much difference was observed in the printability as discerned from the spreading ratio, lower spreading ratios are preferred for the bioprinting of cell-laden constructs with high precision [58]. This difference in the theoretical vs. experimental fiber diameter is due to a number of factors, including the extrusion pressure, speed, and cell density that may affect the rheological properties, etc [59]. During bioprinting, the bioink is extruded in a specific alignment or geometry, indirectly affecting the cell behavior, particularly by promoting cell-cell clustering along with proximity and confinement effects [8]. For instance, Theodoridis et al [60] reported the fabrication of 3D-printed polycaprolactone scaffolds by varying the pattern of the scaffold geometry towards chondrogenic differentiation of adipose‐tissue–derived MSCs. The constructs with a 45° rotational layer loop were the best of the three examined patterns for inducing chondrogenic differentiation. At the same time, the 3D honeycomb‐like pattern offered incredible support for cell proliferation and scaffold penetration. It also showed the highest growth rate in the final construct's mechanical characteristics compared to the one with a rectilinear layered pattern. Hence, it can be concluded that the selection of an ideal scaffold architecture can more closely resemble the native articular cartilage tissue.
The notable viability of the cells encapsulated on both scaffolds implies that the arch architecture selected for our study does not constrain cell growth. Even though decreased cell viability was observed in the case of GelMA compared to its SF-G counterpart, as discerned via Live-Dead staining, the percentage of cell viability was more than 85%. A high percentage of BM-MSCs viability in GelMA constructs despite UV exposure has also been validated by Lopez Perez et al [61]. They demonstrated that human BM-MSCs were substantially unaffected by UV-B exposure and retained their stem cell properties. Another reason for the viability percentage of more than 85% is the rapid consumption of the radicals generated by UV exposure during cross-linking; as a result, UV radiation during cross-linking has no such adverse effects on the cells [62]. This signifies the potential of the GelMA and SF-G bioinks for supporting the proliferation of the encapsulated BM-MSCs post-printing. Moreover, the low percentage of dead cells in both cases signifies that the hydrogel is non-toxic and cytocompatible. On day 14, the cells within the constructs exhibited a spread morphology, a distinguishing feature of BM-MSCs. This could be due to the adhesion sites in the GelMA [31] and the SF-G constructs [63]. Additionally, the encapsulated cells are clustered in the hydrogel because cell distribution throughout the material is improved via bioprinting [10]. These results also point to the cellular self-assembly of the encapsulated cells in the 3D bioprinted constructs, as observed from the live-dead images mostly in the case of SF-G.
Both constructs promoted cellular proliferation, GAG production, cell adhesion, and survival. Concerning proliferation, SF-G constructs displayed enhanced DNA production than the GelMA counterparts. However, the decrease in the proliferation rate, as seen from the DNA content after three weeks, likely denotes a significant equilibrium between stem cell proliferation and differentiation along with limited cellular proliferation [64]. This was validated by the previous finding, which demonstrated that the proliferation rate of MSCs decreased as they got closer to differentiating [65]. It should be noted that the reason for the higher DNA content in SF-G compared to the GelMA constructs is because of the enzymatic cross-linking of SF-G with mushroom tyrosinase and the presence of β-sheet. This would have offered the encapsulated BM-MSCs a steady but favorable microenvironment compared to the photo-crosslinked GelMA counterpart [12]. GAGs and collagen II are abundant in the ECM composition specific to articular cartilage. Hence, it is crucial to corroborate that the fabricated scaffold targeted for mimicking the composition of articular cartilage should be similar to that of the native tissue [66]. The existence of GAGs in both construct types designates chondrogenic differentiation and the temporal cartilaginous matrix formation after three weeks. The higher content of GAGs and collagen normalized to DNA in SF-G might be again due to the closely packed β-sheets that may have given a rigid matrix environment for the cells in SF-G. This, in turn, may have encouraged increased collagen production under chondrogenic differentiation for three weeks [12]. Although day 0 would provide a starting point for the biochemical assay, we know from the literature that cells need a few days to adapt to the bioprinting process [67], hence the choice of day 7. The focus of the study is not on cell proliferation but the form-function relationship. The enhanced GAG and collagen production combined with decreasing cell proliferation suggests that the reduced cell proliferation in SF-G is primarily assigned to their state of differentiation and elevated matrix production [65]. This highlights how effective SF-G constructs are at preserving cellular functionality compared to GelMA as a cell-encapsulating biomaterial.
Enhanced Col 2A1 expression in SF-G constructs on day 21 obtained by qRT-PCR validates the findings of our total collagen estimation by hydroxyproline assay. Surprisingly, ELISA's assessment of collagen II in the media showed contrasting results. A probable reason for the reduced collagen II levels in the SF-G group compared with its GelMA counterpart might be the variation in surface chemistry, the biophysical environment around the cells, and matrix degradation [68]. However, due to the stability of the β-sheet-enriched matrix, we rule out the possibility of degradation of the silk scaffold within three weeks of in vitro culture in this study. Decreased collagen II secretion in the media in SF-G compared to its total collagen content can be due to the enhanced fibril development and nucleation, which might vacate the soluble collagen pool resulting in lesser collagen II leaching out in the media [69]. Another reason that cannot be ignored is that GelMA constructs have been photo-crosslinked after printing the entire construct; as a result, the degree of cross-linking might vary from layer to layer. This could affect the pore size, which could, in turn, result in more collagen reaching the medium rather than getting entrapped [70]. Besides, the encapsulated cells in GelMA constructs might be deficient in sufficient structural stability, which may have led to their washing away into the media [71].
The chondrogenic differentiation ability of the encapsulated BM-MSCs in both constructs was evaluated by specific differentiation markers cultured for three weeks. Enhanced expression of chondrogenic specific markers (Col 2A1, SOX 9, and ACAN) in SF-G constructs with increased culture time denoted superior chondrogenic potential of SF-G constructs compared to GelMA. It has been demonstrated that exposure to TGF-β during chondrogenesis causes MSCs to pursue a condensation process that results in SOX 9 expression. As a result, the cells inside the scaffolds commence differentiation and develop ACAN and collagen II [72]. Indeed, it is essential to highlight that the most significant regulator of chondrogenesis is SOX 9, whose enhanced expression is critical for sustaining the chondrocyte phenotype [73]. Interestingly, SOX 9 controls the transcription of chondrogenic proteins Col 2A1 and ACAN by directly binding and activating their promoter sites [74, 75]. In contrast, the expression of PRG4, which stands for lubricin and is primarily found in the superficial cartilage region, was higher in GelMA constructs. The Wnt/β-catenin signaling pathway is crucial in cell migration, proliferation, and chondrogenic differentiation [10]. Similarly, the TGF-β signaling pathway controls the expression of those growth and transcription factors, which ultimately regulate the proliferation and differentiation of the chondrocytes [76]. The intrinsic role of SF-G in stimulating the Wnt/β-catenin and TGF-β pathway in primary chondrocytes and mesenchymal progenitor cells has been elucidated previously [10, 12]. In the present study, we wanted to determine whether GelMA can regulate these pathways akin to that observed with SF-G. However, compared to SF-G, there was a drastic reduction in the expression of β-catenin and TGFβR1 during the culture period in GelMA constructs. It should be noted that the canonical β-catenin signal is crucial not only for articular cartilage differentiation [77] but also for hypertrophic differentiation [78, 79]. Therefore, the expression of β-catenin alone cannot convincingly discriminate between hypertrophic and articular cartilage differentiation. Hence, we looked into the hypertrophic differentiation of BM-MSCs encapsulated in the bioprinted GelMA and SF-G constructs using Col 10A1 and MMP 13 markers. The declined expression of the hypertrophic markers with increasing culture time denotes that none of the bioprinted constructs underwent hypertrophy. Noteworthy, the hypertrophic expression levels of SF-G were less than GelMA, which again points to its role in abating hypertrophy and articular cartilage formation, akin to our previous results [11]. The same results were also reflected in the immunofluorescence analysis, where the expression of collagen II was higher in SF-G on day 21 than in GelMA constructs on day 21. However, it should be noted that in GelMA, collagen II is present in the intracellular/pericellular region, whereas in SF-G it is produced extracellularly. Further, the reduced expression of collagen X on day 21 in SF-G compared to GelMA validates the role of SF-G as a better bioink than GelMA towards chondrogenic differentiation of BM-MSC and in regulating the canonical Wnt/β-catenin signaling pathway. Besides, it helps modulate the hypertrophy as ascertained from gene and protein expression analysis [11].
We carried out PPI network analysis to validate our gene expression results and to further obtain deep mechanistic insights into the gene and protein level. The STRING analysis results validated the Metascape and GeneMANIA and corroborated that our 3D bioprinted constructs supported chondrogenic differentiation of the encapsulated BM-MSCs. Further, the PPI analysis confirmed the role of SF-G in supporting cellular adhesion and proliferation of the encapsulated BM-MSCs, and showed that the bioink provided a suitable niche for their differentiation into embryonic-like articular cartilage. These results have also shed light on regulating the Wnt/β-catenin and TGFβR1 signaling pathways in SF-G, not observed in GelMA. Interestingly, we found similarities between the signaling pathways associated with the 3D bioprinted constructs and with the morphogenesis of in vivo skeletal system along with embryonic development, as depicted from the PPI network. This might indicate that our SF-G constructs bioprinted in an arch-like fashion have the potential of providing the necessary instructive cues for stimulating morphogenesis pathways, which in the future might help us to develop patient-specific 3D bioprinted articular hyaline cartilage.
5. Conclusion
In this study, we fabricated a biomimetic arch-like construct of cartilaginous tissue using 3D bioprinting. We have emphasized the architecture of the construct that resembles the collagen II arrangement in native tissue. Both GelMA and SF-G showed potential for chondrogenesis. However, the 3D bioprinted SF-G constructs produced the best articular cartilage chondrogenesis, as evidenced by the expression of chondrogenic specific markers Col 2A1, ACAN, SOX 9 along with the decreased expression of the hypertrophic markers Col 10A1 and MMP 13. Immunofluorescence analysis further validated these findings specific for collagen I, II, and X. Unlike GelMA, SF-G showed better expression with Wnt/β-catenin and TGF-β signaling markers, which play a significant role in chondrogenesis. PPI network study also established that SF-G used to encapsulate BM-MSCs provided a suitable environment for their chondrogenic differentiation.
Acknowledgments
J C is grateful to the Department of Science and Technology (DST), India, for the Inspire Fellowship (SRF) No. IF160365. We are also grateful to ZonMw (Project Number 11630095101) for funding. This work is also part of the project 3D-MENTOR (with Project Number 18647) of the VICI research programme, which is financed by the Dutch Research Council (NWO). Figure 1(A) has been developed by the licensed version of BioRender.
Data availability statement
All data that support the findings of this study are included within the article (and any supplementary files).
Conflict of interest
The authors declare that there is no conflict of interest.
Supplementary data (3.1 MB DOCX)